Estimated zip code population in 2022: 7,034 Zip code population in 2010: 6,295 Zip code population in 2000: 4,808
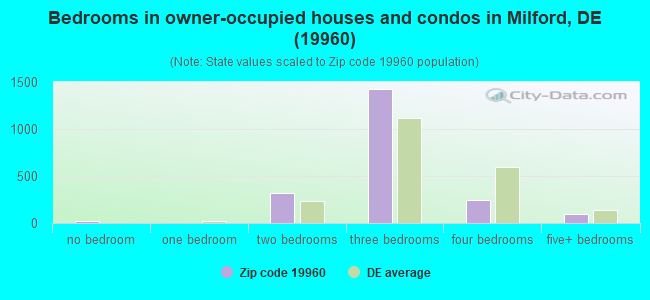
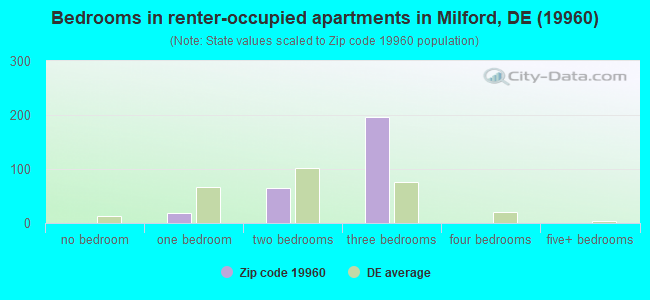
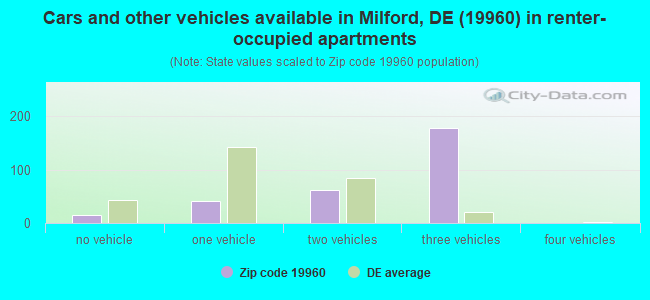
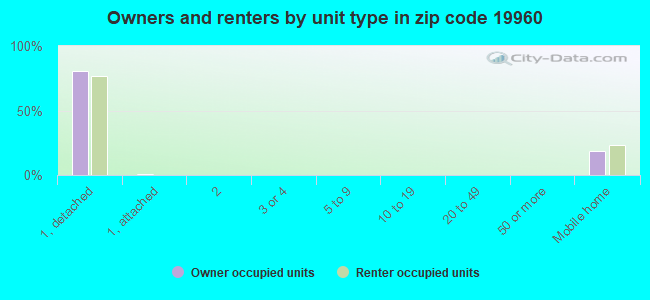
Houses and condos: 2,520 Renter-occupied apartments: 285
% of renters here:
12%
State:
26%
March 2022 cost of living index in zip code 19960: 81.4 (low, U.S. average is 100)
Land area: 29.5 sq. mi. Water area: 0.3 sq. mi.
Population density: 238 people per square mile
(very low).
OSM Map
General Map
Google Map
MSN Map
OSM Map
General Map
Google Map
MSN Map
OSM Map
General Map
Google Map
MSN Map
OSM Map
General Map
Google Map
MSN Map
Please wait while loading the map...
Real estate property taxes paid for housing units in 2022:
This zip code:
0.3% ($879)
Delaware:
0.5% ($1,635)
Median real estate property taxes paid for housing units with mortgages in 2022: $879 (0.3%) Median real estate property taxes paid for housing units with no mortgage in 2022: $878 (0.3%)
Averages for the 2020 tax year for zip code 19960, filed in 2021:
Average Adjusted Gross Income (AGI) in 2020: $47,141 (Individual Income Tax Returns)
Here:
$47,141
State:
$74,239
Salary/wage: $41,667 (reported on 83.9% of returns)
Here:
$41,667
State:
$59,982
(% of AGI for various income ranges: 1222.5% for AGIs below $25k, 3709.1% for AGIs $25k-50k, 6660.0% for AGIs $50k-75k, 9272.0% for AGIs $75k-100k, 15231.4% for AGIs $100k-200k)
Taxable interest for individuals: $736 (reported on 19.8% of returns)
This zip code:
$736
Delaware:
$1,604
(% of AGI for various income ranges: 9.2% for AGIs below $25k, 14.9% for AGIs $25k-50k, 24.9% for AGIs $50k-75k, 27.5% for AGIs $75k-100k, 48.6% for AGIs $100k-200k)
Ordinary dividends: $2,550 (reported on 8.6% of returns)
Here:
$2,550
State:
$8,303
(% of AGI for various income ranges: 8.1% for AGIs below $25k, 16.3% for AGIs $25k-50k, 57.4% for AGIs $50k-75k, 30.5% for AGIs $75k-100k, 135.9% for AGIs $100k-200k)
Net capital gain/loss in AGI: +$5,359 (reported on 7.8% of returns)
Here:
+$5,359
State:
+$19,461
(% of AGI for various income ranges: 1.3% for AGIs below $25k, 10.5% for AGIs $25k-50k, 30.9% for AGIs $50k-75k, 84.0% for AGIs $75k-100k, 489.5% for AGIs $100k-200k)
Profit/loss from business: +$10,368 (reported on 14.4% of returns)
Here:
+$10,368
State:
+$13,079
(% of AGI for various income ranges: 161.9% for AGIs below $25k, 127.6% for AGIs $25k-50k, 218.0% for AGIs $50k-75k, 249.0% for AGIs $75k-100k, 631.8% for AGIs $100k-200k)
Taxable individual retirement arrangement distribution: $13,060 (reported on 7.2% of returns)
19960:
$13,060
Delaware:
$22,095
(% of AGI for various income ranges: 41.8% for AGIs below $25k, 47.3% for AGIs $25k-50k, 144.3% for AGIs $50k-75k, 344.0% for AGIs $75k-100k, 593.6% for AGIs $100k-200k)
Total itemized deductions: $24,006 (reported on 4.6% of returns)
Here:
$24,006
State:
$30,452
(% of AGI for various income ranges: 78.5% for AGIs $25k-50k, 300.6% for AGIs $50k-75k, 263.5% for AGIs $75k-100k, 750.0% for AGIs $100k-200k)
Charity contributions: $8,627 (reported on 3.2% of returns)
Here:
$8,627
State:
$8,999
(% of AGI for various income ranges: 110.3% for AGIs $50k-75k, 255.9% for AGIs $100k-200k)
Taxes paid: $5,069 (reported on 4.6% of returns)
19960:
$5,069
State:
$7,483
(% of AGI for various income ranges: 9.7% for AGIs $25k-50k, 48.3% for AGIs $50k-75k, 68.5% for AGIs $75k-100k, 195.0% for AGIs $100k-200k)
Earned income credit: $2,350 (reported on 20.7% of returns)
Here:
$2,350
State:
$2,247
(% of AGI for various income ranges: 103.8% for AGIs below $25k, 90.5% for AGIs $25k-50k)
Percentage of individuals using paid preparers for their 2020 taxes: 91.4%
Here:
91%
State:
92%
(% for various income ranges: 90.0% for AGIs below $25k, 91.9% for AGIs $25k-50k, 92.0% for AGIs $50k-75k, 93.3% for AGIs $75k-100k, 91.7% for AGIs $100k-200k, 100.0% for AGIs over 200k)
Averages for the 2012 tax year for zip code 19960, filed in 2013:
Average Adjusted Gross Income (AGI) in 2012: $38,393 (Individual Income Tax Returns)
Here:
$38,393
State:
$61,157
Salary/wage: $33,887 (reported on 86.8% of returns)
Here:
$33,887
State:
$50,642
(% of AGI for various income ranges: 79.9% for AGIs below $25k, 85.5% for AGIs $25k-50k, 73.6% for AGIs $50k-75k, 73.7% for AGIs $75k-100k, 68.4% for AGIs $100k-200k)
Taxable interest for individuals: $992 (reported on 20.9% of returns)
This zip code:
$992
Delaware:
$1,571
(% of AGI for various income ranges: 0.5% for AGIs below $25k, 0.6% for AGIs $25k-50k, 0.6% for AGIs $50k-75k, 0.2% for AGIs $75k-100k, 0.6% for AGIs $100k-200k)
Ordinary dividends: $2,133 (reported on 9.6% of returns)
Here:
$2,133
State:
$6,610
(% of AGI for various income ranges: 0.3% for AGIs below $25k, 0.3% for AGIs $25k-50k, 0.8% for AGIs $50k-75k, 0.4% for AGIs $75k-100k, 0.9% for AGIs $100k-200k)
Net capital gain/loss in AGI: +$2,790 (reported on 6.4% of returns)
Here:
+$2,790
State:
+$11,439
(% of AGI for various income ranges: 1.0% for AGIs $50k-75k, 0.9% for AGIs $75k-100k, 0.9% for AGIs $100k-200k)
Profit/loss from business: +$7,893 (reported on 13.5% of returns)
Here:
+$7,893
State:
+$12,773
(% of AGI for various income ranges: 6.6% for AGIs below $25k, 2.1% for AGIs $25k-50k, 2.3% for AGIs $50k-75k, 3.0% for AGIs $75k-100k, 1.2% for AGIs $100k-200k)
Taxable individual retirement arrangement distribution: $14,104 (reported on 7.4% of returns)
19960:
$14,104
Delaware:
$16,790
(% of AGI for various income ranges: 2.1% for AGIs below $25k, 1.5% for AGIs $25k-50k, 3.0% for AGIs $50k-75k, 3.2% for AGIs $75k-100k, 4.1% for AGIs $100k-200k)
Total itemized deductions: $17,242 (24% of AGI, reported on 22.8% of returns)
Here:
$17,242
State:
$23,216
Here:
24.0% of AGI
State:
19.8% of AGI
(% of AGI for various income ranges: 6.0% for AGIs below $25k, 7.8% for AGIs $25k-50k, 12.4% for AGIs $50k-75k, 13.7% for AGIs $75k-100k, 12.1% for AGIs $100k-200k)
Charity contributions: $3,381 (reported on 17.0% of returns)
Here:
$3,381
State:
$3,791
(% of AGI for various income ranges: 0.5% for AGIs below $25k, 1.1% for AGIs $25k-50k, 1.5% for AGIs $50k-75k, 2.3% for AGIs $75k-100k, 2.0% for AGIs $100k-200k)
Taxes paid: $3,821 (reported on 22.8% of returns)
19960:
$3,821
State:
$8,129
(% of AGI for various income ranges: 0.4% for AGIs below $25k, 1.1% for AGIs $25k-50k, 2.4% for AGIs $50k-75k, 3.0% for AGIs $75k-100k, 4.3% for AGIs $100k-200k)
Earned income credit: $2,504 (reported on 25.1% of returns)
Here:
$2,504
State:
$2,231
(% of AGI for various income ranges: 8.0% for AGIs below $25k, 1.4% for AGIs $25k-50k)
Percentage of individuals using paid preparers for their 2012 taxes: 42.8%
Here:
43%
State:
47%
(% for various income ranges: 37.9% for AGIs below $25k, 38.7% for AGIs $25k-50k, 51.4% for AGIs $50k-75k, 52.4% for AGIs $75k-100k, 70.0% for AGIs $100k-200k)
Averages for the 2004 tax year for zip code 19960, filed in 2005:
Average Adjusted Gross Income (AGI) in 2004: $33,339 (Individual Income Tax Returns)
Here:
$33,339
State:
$54,038
Salary/wage: $29,608 (reported on 87.6% of returns)
Here:
$29,608
State:
$44,625
(% of AGI for various income ranges: 94.9% for AGIs below $10k, 82.0% for AGIs $10k-25k, 83.8% for AGIs $25k-50k, 77.1% for AGIs $50k-75k, 81.3% for AGIs $75k-100k, 57.5% for AGIs over 100k)
Taxable interest for individuals: $957 (reported on 31.5% of returns)
This zip code:
$957
Delaware:
$1,734
(% of AGI for various income ranges: 2.3% for AGIs below $10k, 1.2% for AGIs $10k-25k, 0.7% for AGIs $25k-50k, 1.0% for AGIs $50k-75k, 0.3% for AGIs $75k-100k, 1.1% for AGIs over 100k)
Taxable dividends: $1,296 (reported on 13.1% of returns)
Here:
$1,296
State:
$5,362
(% of AGI for various income ranges: 1.1% for AGIs below $10k, 0.5% for AGIs $10k-25k, 0.2% for AGIs $25k-50k, 0.6% for AGIs $50k-75k, 0.2% for AGIs $75k-100k, 1.1% for AGIs over 100k)
Net capital gain/loss: +$8,708 (reported on 7.7% of returns)
Here:
+$8,708
State:
+$17,328
(% of AGI for various income ranges: -1.0% for AGIs below $10k, -0.2% for AGIs $10k-25k, 0.4% for AGIs $25k-50k, 0.7% for AGIs $50k-75k, 0.1% for AGIs $75k-100k, 11.2% for AGIs over 100k)
Profit/loss from business: +$7,520 (reported on 13.3% of returns)
Here:
+$7,520
State:
+$12,191
(% of AGI for various income ranges: 2.2% for AGIs below $10k, 4.2% for AGIs $10k-25k, 3.4% for AGIs $25k-50k, 3.5% for AGIs $50k-75k, 1.9% for AGIs $75k-100k, 1.5% for AGIs over 100k)
Profit/loss from farming: +$583 (reported on 0.5% of returns)
Here:
+$583
State:
-$1,323
IRA payment deduction: $2,974 (reported on 1.6% of returns)
19960:
$2,974
Delaware:
$3,027
Total itemized deductions: $13,890 (22% of AGI, reported on 25.8% of returns)
Here:
$13,890
State:
$19,441
Here:
22.3% of AGI
State:
19.3% of AGI
(% of AGI for various income ranges: 10.3% for AGIs below $10k, 5.4% for AGIs $10k-25k, 9.9% for AGIs $25k-50k, 13.1% for AGIs $50k-75k, 14.5% for AGIs $75k-100k, 11.0% for AGIs over 100k)
Charity contributions deductions: $2,650 (4% of AGI, reported on 20.8% of returns)
Here:
$2,650
State:
$3,727
Here:
4.0% of AGI
State:
3.5% of AGI
(% of AGI for various income ranges: 0.8% for AGIs below $10k, 0.5% for AGIs $10k-25k, 1.3% for AGIs $25k-50k, 2.4% for AGIs $50k-75k, 1.9% for AGIs $75k-100k, 2.1% for AGIs over 100k)
Total tax: $4,187 (reported on 69.1% of returns)
19960:
$4,187
State:
$8,958
(% of AGI for various income ranges: 2.1% for AGIs below $10k, 3.6% for AGIs $10k-25k, 6.4% for AGIs $25k-50k, 8.8% for AGIs $50k-75k, 10.7% for AGIs $75k-100k, 17.1% for AGIs over 100k)
Earned income credit: $1,904 (reported on 22.8% of returns)
Here:
$1,904
State:
$1,733
Percentage of individuals using paid preparers for their 2004 taxes: 58.5%
Here:
58%
State:
55%
(% for various income ranges: 48.4% for AGIs below $10k, 59.5% for AGIs $10k-25k, 59.6% for AGIs $25k-50k, 63.3% for AGIs $50k-75k, 65.7% for AGIs $75k-100k, 72.6% for AGIs over 100k)
Household received Food Stamps/SNAP in the past 12 months: 253 Household did not receive Food Stamps/SNAP in the past 12 months: 2,101
Women who had a birth in the past 12 months: 69 (27 now married, 38 unmarried) Women who did not have a birth in the past 12 months: 1,685 (537 now married, 1,136 unmarried)
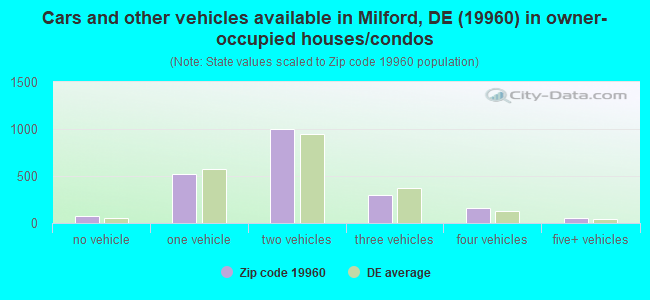
Housing units in zip code 19960 with a mortgage: 1,275 (236 second mortgage, 201 both second mortgage and home equity loan) Median monthly owner costs for units with a mortgage: $1,392 Median monthly owner costs for units without a mortgage: $406
Residents with income below the poverty level in 2022:
This zip code:
6.5%
Whole state:
9.4%
Residents with income below 50% of the poverty level in 2022:
This zip code:
4.5%
Whole state:
4.6%
Median number of rooms in houses and condos:
Here:
5.9
State:
6.9
Median number of rooms in apartments:
Here:
6.7
State:
4.4
Notable locations in this zip code not listed on our city pages
Churches in zip code 19960 include: Siloam Church (A), Union Church (B), Little Union Baptist Church (C), Mount Calvary Pentecostal Church (D), Full Gospel Holiness Church (E), Wesley Chapel (F), Lincoln United Methodist Church (G), Metropolitan United Methodist Church (H), Church Tabernacle (I). Display/hide their locations on the map
In group quarters: 2 (-1 institutionalized population)
Size of family households: 853 2-persons, 392 3-persons, 240 4-persons, 196 5-persons, 41 6-persons, 115 7-or-more-persons
Size of nonfamily households: 382 1-person, 157 2-persons
872 married couples with children.
346 single-parent households (80 men, 266 women).
83.3% of residents of 19960 zip code speak English at home.
11.5% of residents speak Spanish at home (47% very well, 23% well, 22% not well, 8% not at all).
4.3% of residents speak other Indo-European language at home (57% very well, 43% well).
1.0% of residents speak Asian or Pacific Island language at home (54% very well, 46% well).
0.3% of residents speak other language at home (100% very well).
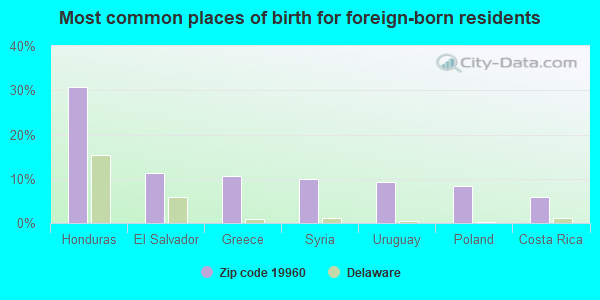
Foreign born population: 811 (11.5%) (56.6% of them are naturalized citizens)
This zip code:
11.5%
Whole state:
9.9%
31%Honduras
11%El Salvador
11%Greece
10%Syria
9%Uruguay
8%Poland
6%Costa Rica
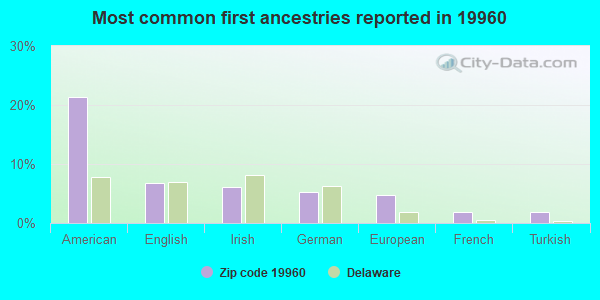
21%American
7%English
6%Irish
5%German
5%European
2%French
2%Turkish
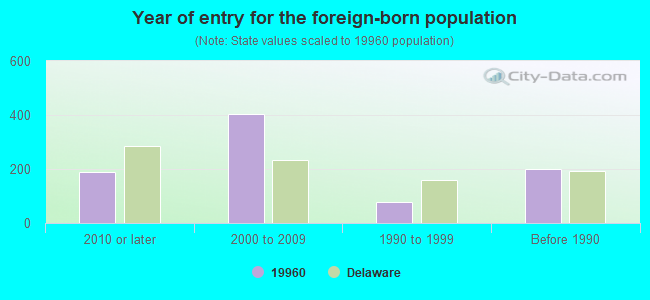
Year of entry for the foreign-born population
1882010 or later
4022000 to 2009
791990 to 1999
201Before 1990
Private high school in in this zip code not listed on the city page:
GENEVA ACADEMY (Students: 33, Location: 11146 PONDER RD, Grades: KG-12)
Facilities with environmental interests located in this zip code:
FITZGERALDS AUTO SALVAGE (N. OF RT 207 & W. OF RT 113 in LINCOLN, DE)
AIR MINOR (AIRS/AFS) - ICIS-, ENFORCEMENT/COMPLIANCE ACTIVITY Conditionally Exempt Small Quantity Generators, less than 100 kg/month of hazardous waste (Resource Conservation and Recovery Act (tracking hazardous waste)) - notification Business SIC classification: SCRAP AND WASTE MATERIALS Organizations: SCOTT FITZGERALD (CONTACT/OWNER)
EVELYN I. MORRIS EARLY CHILDHOOD CENTER (8609 THIRD STREET in LINCOLN, DE)
(National Center for Education Statistics) - STATE ID-670 Organizations: MILFORD SCHOOL DISTRICT (SCHOOL DISTRICT)
CHRISTIAN TABERNACLE ACADEMY (ROAD #207 in LINCOLN, DE)
COMPLIANCE ACTIVITY (Tracking inspections of insecticide, fungicide, and rodenticide, and toxic substances)
HARRINGTON EQUIP CO INC (COUNTY RD 225 in LINCOLN, DE)
Small Quantity Generators, between 100 kg and 1000 kg of hazardous waste/month (Resource Conservation and Recovery Act (tracking hazardous waste)) - notification Organizations: THOMAS H HARRINGTON JR (CONTACT/OWNER)
R & M TRUCKING (RD 2 BOX 435 in LINCOLN, DE)
Conditionally Exempt Small Quantity Generators, less than 100 kg/month of hazardous waste (Resource Conservation and Recovery Act (tracking hazardous waste)) - notification Organizations: RONALD & MARIAN SMITH (CONTACT/OWNER)
Housing units lacking complete plumbing facilities: 3.9% Housing units lacking complete kitchen facilities: 1.4%
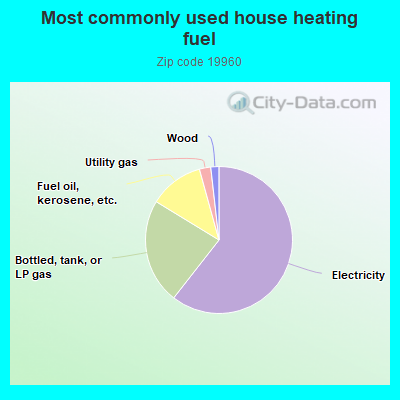
60.7%Electricity
23.2%Bottled, tank, or LP gas
12.0%Fuel oil, kerosene, etc.
2.5%Utility gas
1.8%Wood
Population in 1990: 4,435. Population change in the 1990s: +373 (+8.4%).
Place of birth for U.S.-born residents:
This state: 3,943
Northeast: 1,105
Midwest: 90
South: 861
West: 68
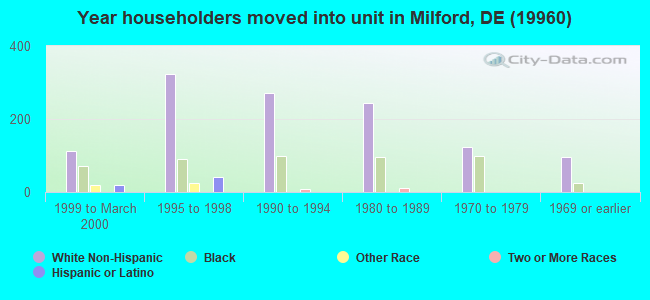
64% of the 19960 zip code residents lived in the same house 5 years ago. Out of people who lived in different houses, 56% lived in this county. Out of people who lived in different counties, 50% lived in Delaware.
95% of the 19960 zip code residents lived in the same house 1 year ago. Out of people who lived in different houses, 37% moved from this county. Out of people who lived in different houses, 69% moved from different state.
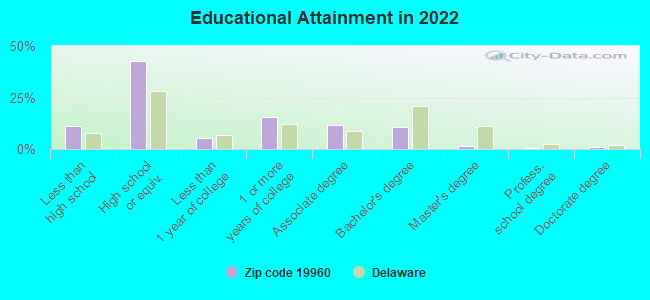
Private vs. public school enrollment:
Students in private schools in grades 1 to 8 (elementary and middle school): 37
Here:
6.3%
Delaware:
11.5%
Students in private schools in grades 9 to 12 (high school): 80
Here:
15.0%
Delaware:
12.1%
Students in private undergraduate colleges:
Here:
0.2%
Delaware:
19.2%
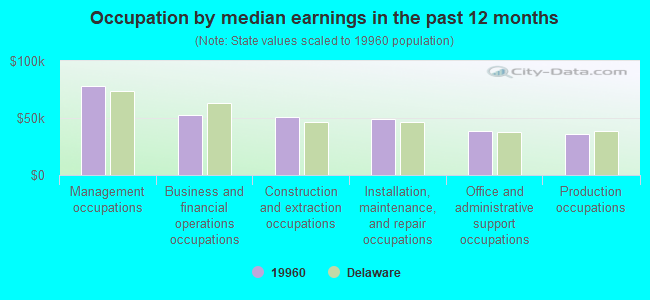
Occupation by median earnings in the past 12 months ($)
78,083Management occupations
52,639Business and financial operations occupations
51,066Construction and extraction occupations
49,512Installation, maintenance, and repair occupations
38,521Office and administrative support occupations
35,686Production occupations
Companies with federal contracts located in this zip code:
A1 WILDLIFE MANAGEMENT SERVICE (17002 STAYTONVILLE ROAD in LINCOLN, DE; small business) : $4,500 in 2 contractsin 2001
$4,750 with Army for Miscellaneous Service and Trade Equipment. Taking place in MD. Signed on 2001-06-11. Completion date: 2001-07-16.
-$250, same as above.Signed on 2001-09-07. Completion date: 2001-07-16.
Top industries in this zip code by the number of employees in 2005:
Wholesale Trade: Recyclable Material Merchant Wholesalers (50-99 employees: 1 establishment)
Construction: Commercial and Institutional Building Construction (20-49: 1, 1-4: 1)
Health Care and Social Assistance: Other Individual and Family Services (10-19: 1, 1-4: 2)
Construction: Other Heavy and Civil Engineering Construction (10-19: 1, 1-4: 1)
Administrative and Support and Waste Management and Remediation Services: Solid Waste Collection (10-19: 1)
Construction: Highway, Street, and Bridge Construction (10-19: 1)
Educational Services: Elementary and Secondary Schools (10-19: 1)
Construction: Electrical Contractors (10-19: 1)
Construction: Plumbing, Heating, and Air-Conditioning Contractors (5-9: 1, 1-4: 2)
People in group quarters in 2010:
4 people in group homes intended for adults
Fatal accident statistics in 2014:
Fatal accident count: 1
Vehicles involved in fatal accidents: 2
Fatal accidents caused by drunken drivers: 1
Fatalities: 1
Persons involved in fatal accidents: 2
Pedestrians involved in fatal accidents: 0
Fatal accident statistics in 2013:
Fatal accident count: 2
Vehicles involved in fatal accidents: 4
Fatal accidents caused by drunken drivers: 1
Fatalities: 3
Persons involved in fatal accidents: 8
Pedestrians involved in fatal accidents: 0
2002 - 2018 National Fire Incident Reporting System (NFIRS) incidents
According to the data from the years 2002 - 2018 the average number of fires per year is 18. The highest number of fires - 27 took place in 2002, and the least - 4 in 2003. The data has a dropping trend.
When looking into fire subcategories, the most incidents belonged to: Outside Fires (48.8%), and Structure Fires (39.2%).
Fire incident types reported to NFIRS in Zip Code 19960


+$583
-$1,323
 Nearest zip codes: 19941, 19963, 19954, 19968, 19947, 19946.


 (Students: 33, Location: 11146 PONDER RD, Grades: KG-12)

 According to the data from the years 2002 - 2018 the average number of fires per year is 18. The highest number of fires - 27 took place in 2002, and the least - 4 in 2003. The data has a dropping trend.
 When looking into fire subcategories, the most incidents belonged to: Outside Fires (48.8%), and Structure Fires (39.2%).