Estimated zip code population in 2022: 763 Zip code population in 2010: 857 Zip code population in 2000: 365
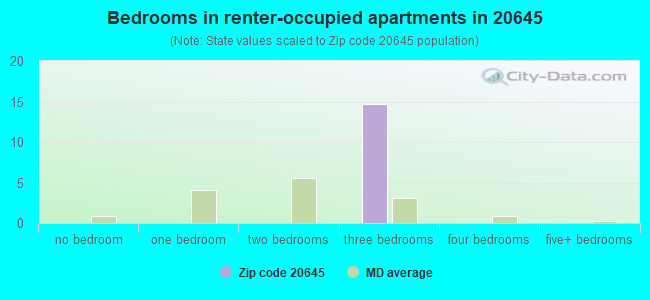
Houses and condos: 289 Renter-occupied apartments: 15
% of renters here:
5%
State:
32%
March 2022 cost of living index in zip code 20645: 131.2 (high, U.S. average is 100)
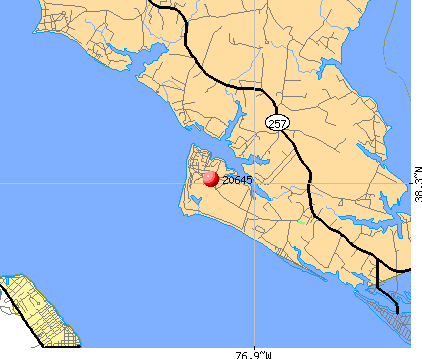
Land area: 2.2 sq. mi. Water area: 1.6 sq. mi.
Population density: 348 people per square mile
(very low).
OSM Map
General Map
Google Map
MSN Map
OSM Map
General Map
Google Map
MSN Map
OSM Map
General Map
Google Map
MSN Map
OSM Map
General Map
Google Map
MSN Map
Please wait while loading the map...
Real estate property taxes paid for housing units in 2022:
This zip code:
1.1% ($4,824)
Maryland:
0.9% ($3,777)
Median real estate property taxes paid for housing units with mortgages in 2022: $4,941 (1.0%) Median real estate property taxes paid for housing units with no mortgage in 2022: $4,574 (1.2%)
Business Search- 14 Million verified businesses
Males: 355
(46.5%)
Females: 408
(53.5%)
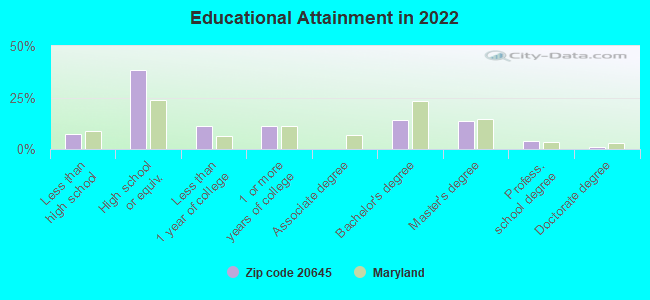
For population 25 years and over in 20645:
High school or higher: 92.2%
Bachelor's degree or higher: 32.2%
Graduate or professional degree: 18.2%
Mean travel time to work (commute): 50.8 minutes
For population 15 years and over in 20645:
Never married: 23.8%
Now married: 63.3%
Separated: 0.0%
Widowed: 6.8%
Divorced: 6.1%
Zip code 20645 compared to state average:
Unemployed percentage significantly below state average.
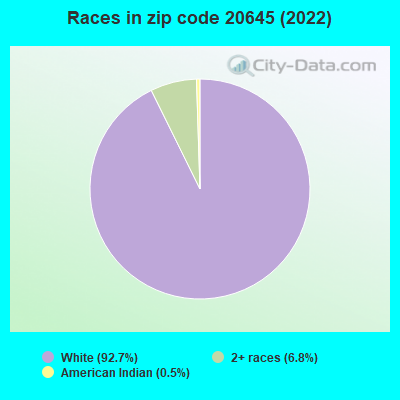
Black race population percentage significantly below state average.
Hispanic race population percentage significantly below state average.
Median age significantly above state average.
Foreign-born population percentage significantly below state average.
Renting percentage significantly below state average.
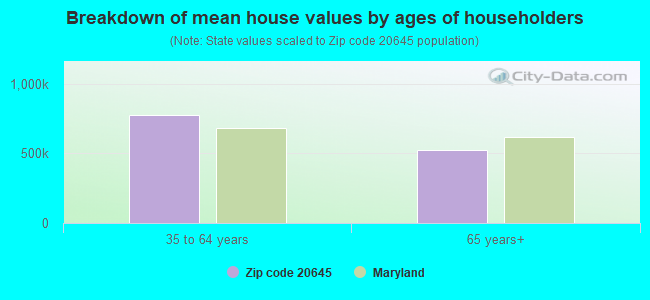
Estimated median house/condo value in 2022: $447,379
20645:
$447,379
Maryland:
$398,100
Median resident age:
This zip code:
51.2 years
Maryland median age:
39.7 years
Average household size:
This zip code:
2.6 people
Maryland:
2.5 people
Averages for the 2020 tax year for zip code 20645, filed in 2021:
Average Adjusted Gross Income (AGI) in 2020: $113,826 (Individual Income Tax Returns)
Here:
$113,826
State:
$86,905
Salary/wage: $92,759 (reported on 81.0% of returns)
Here:
$92,759
State:
$73,953
(% of AGI for various income ranges: 894.0% for AGIs below $25k, 3333.3% for AGIs $25k-50k, 6086.7% for AGIs $50k-75k, 6750.0% for AGIs $75k-100k, 18902.2% for AGIs $100k-200k)
Taxable interest for individuals: $1,026 (reported on 45.2% of returns)
This zip code:
$1,026
Maryland:
$1,528
(% of AGI for various income ranges: 133.3% for AGIs $50k-75k, 40.0% for AGIs $75k-100k, 123.3% for AGIs $100k-200k)
Ordinary dividends: $4,378 (reported on 21.4% of returns)
Here:
$4,378
State:
$8,028
(% of AGI for various income ranges: 136.7% for AGIs $50k-75k, 392.2% for AGIs $100k-200k)
Net capital gain/loss in AGI: +$14,612 (reported on 19.0% of returns)
Here:
+$14,612
State:
+$25,238
(% of AGI for various income ranges: 46.7% for AGIs $25k-50k, 1283.3% for AGIs $100k-200k)
Profit/loss from business: +$18,750 (reported on 19.0% of returns)
Here:
+$18,750
State:
+$11,398
(% of AGI for various income ranges: 526.7% for AGIs $50k-75k, 1491.1% for AGIs $100k-200k)
Taxable individual retirement arrangement distribution: $17,060 (reported on 11.9% of returns)
20645:
$17,060
Maryland:
$20,944
(% of AGI for various income ranges: 947.8% for AGIs $100k-200k)
Total itemized deductions: $29,425 (reported on 38.1% of returns)
Here:
$29,425
State:
$30,672
(% of AGI for various income ranges: 1766.7% for AGIs $25k-50k, 1455.0% for AGIs $75k-100k, 2806.7% for AGIs $100k-200k)
Charity contributions: $6,300 (reported on 33.3% of returns)
Here:
$6,300
State:
$9,065
(% of AGI for various income ranges: 440.0% for AGIs $50k-75k, 524.4% for AGIs $100k-200k)
Taxes paid: $9,375 (reported on 38.1% of returns)
20645:
$9,375
State:
$8,475
(% of AGI for various income ranges: 420.0% for AGIs $25k-50k, 520.0% for AGIs $75k-100k, 948.9% for AGIs $100k-200k)
Earned income credit: $2,150 (reported on 4.8% of returns)
Here:
$2,150
State:
$2,151
(% of AGI for various income ranges: 86.0% for AGIs below $25k)
Percentage of individuals using paid preparers for their 2020 taxes: 95.2%
Here:
95%
State:
90%
(% for various income ranges: 100.0% for AGIs below $25k, 100.0% for AGIs $25k-50k, 100.0% for AGIs $50k-75k, 100.0% for AGIs $75k-100k, 93.8% for AGIs $100k-200k, 80.0% for AGIs over 200k)
Averages for the 2012 tax year for zip code 20645, filed in 2013:
Average Adjusted Gross Income (AGI) in 2012: $106,711 (Individual Income Tax Returns)
Here:
$106,711
State:
$72,703
Salary/wage: $87,590 (reported on 78.9% of returns)
Here:
$87,590
State:
$62,228
(% of AGI for various income ranges: 80.0% for AGIs below $25k, 70.2% for AGIs $25k-50k, 61.0% for AGIs $50k-75k, 65.8% for AGIs $75k-100k, 67.3% for AGIs $100k-200k, 60.1% for AGIs over 200k)
Taxable interest for individuals: $1,082 (reported on 57.9% of returns)
This zip code:
$1,082
Maryland:
$1,413
(% of AGI for various income ranges: 1.0% for AGIs below $25k, 0.7% for AGIs $25k-50k, 0.4% for AGIs $50k-75k, 0.5% for AGIs $75k-100k, 0.7% for AGIs $100k-200k, 0.5% for AGIs over 200k)
Ordinary dividends: $3,473 (reported on 28.9% of returns)
Here:
$3,473
State:
$6,933
(% of AGI for various income ranges: 4.6% for AGIs below $25k, 2.2% for AGIs $50k-75k, 1.6% for AGIs $100k-200k)
Net capital gain/loss in AGI: +$2,675 (reported on 21.1% of returns)
Here:
+$2,675
State:
+$14,830
Profit/loss from business: +$9,450 (reported on 15.8% of returns)
Here:
+$9,450
State:
+$12,606
Taxable individual retirement arrangement distribution: $15,471 (reported on 18.4% of returns)
20645:
$15,471
Maryland:
$17,065
Total itemized deductions: $32,731 (23% of AGI, reported on 68.4% of returns)
Here:
$32,731
State:
$27,886
Here:
23.3% of AGI
State:
22.8% of AGI
(% of AGI for various income ranges: 36.9% for AGIs $25k-50k, 19.0% for AGIs $50k-75k, 19.3% for AGIs $75k-100k, 23.8% for AGIs $100k-200k, 17.4% for AGIs over 200k)
Charity contributions: $3,777 (reported on 57.9% of returns)
Here:
$3,777
State:
$4,452
(% of AGI for various income ranges: 3.4% for AGIs $50k-75k, 1.7% for AGIs $75k-100k, 2.1% for AGIs $100k-200k, 2.3% for AGIs over 200k)
Taxes paid: $13,708 (reported on 65.8% of returns)
20645:
$13,708
State:
$11,690
(% of AGI for various income ranges: 9.0% for AGIs $25k-50k, 6.9% for AGIs $50k-75k, 7.2% for AGIs $75k-100k, 9.4% for AGIs $100k-200k, 8.5% for AGIs over 200k)
Percentage of individuals using paid preparers for their 2012 taxes: 52.6%
Here:
53%
State:
52%
(% for various income ranges: 37.5% for AGIs below $25k, 100.0% for AGIs $25k-50k, 50.0% for AGIs $75k-100k, 58.3% for AGIs $100k-200k, 66.7% for AGIs over 200k)
Averages for the 2004 tax year for zip code 20645, filed in 2005:
Average Adjusted Gross Income (AGI) in 2004: $108,326 (Individual Income Tax Returns)
Here:
$108,326
State:
$60,339
Salary/wage: $73,862 (reported on 84.7% of returns)
Here:
$73,862
State:
$52,211
(% of AGI for various income ranges: 85.4% for AGIs below $10k, 67.0% for AGIs $10k-25k, 72.8% for AGIs $25k-50k, 57.3% for AGIs $50k-75k, 73.3% for AGIs $75k-100k, 53.6% for AGIs over 100k)
Taxable interest for individuals: $1,698 (reported on 68.7% of returns)
This zip code:
$1,698
Maryland:
$1,701
(% of AGI for various income ranges: 1.5% for AGIs below $10k, 0.5% for AGIs $10k-25k, 2.4% for AGIs $25k-50k, 1.7% for AGIs $50k-75k, 0.6% for AGIs $75k-100k, 1.0% for AGIs over 100k)
Taxable dividends: $3,122 (reported on 36.0% of returns)
Here:
$3,122
State:
$4,235
(% of AGI for various income ranges: 3.5% for AGIs below $10k, 1.2% for AGIs $25k-50k, 0.7% for AGIs $50k-75k, 0.1% for AGIs $75k-100k, 1.2% for AGIs over 100k)
Net capital gain/loss: +$17,198 (reported on 27.5% of returns)
Here:
+$17,198
State:
+$15,888
(% of AGI for various income ranges: -10.6% for AGIs below $10k, -0.9% for AGIs $25k-50k, -0.1% for AGIs $75k-100k, 6.2% for AGIs over 100k)
Profit/loss from business: +$34,333 (reported on 14.8% of returns)
Here:
+$34,333
State:
+$12,221
IRA payment deduction: $3,833 (reported on 3.1% of returns)
20645:
$3,833
Maryland:
$2,968
Self-employed pension: $20,462 (reported on 3.4% of returns)
Here:
$20,462
Maryland:
$17,155
Total itemized deductions: $32,871 (23% of AGI, reported on 72.5% of returns)
Here:
$32,871
State:
$22,960
Here:
23.4% of AGI
State:
23.3% of AGI
(% of AGI for various income ranges: 84.3% for AGIs below $10k, 22.1% for AGIs $25k-50k, 30.7% for AGIs $50k-75k, 28.1% for AGIs $75k-100k, 20.1% for AGIs over 100k)
Charity contributions deductions: $4,125 (3% of AGI, reported on 66.6% of returns)
Here:
$4,125
State:
$4,031
Here:
3.1% of AGI
State:
3.9% of AGI
(% of AGI for various income ranges: 2.4% for AGIs $25k-50k, 4.8% for AGIs $50k-75k, 2.5% for AGIs $75k-100k, 2.4% for AGIs over 100k)
Total tax: $18,601 (reported on 87.6% of returns)
20645:
$18,601
State:
$10,167
(% of AGI for various income ranges: 2.5% for AGIs below $10k, 3.6% for AGIs $10k-25k, 6.3% for AGIs $25k-50k, 7.2% for AGIs $50k-75k, 8.5% for AGIs $75k-100k, 17.9% for AGIs over 100k)
Earned income credit: $1,316 (reported on 4.9% of returns)
Here:
$1,316
State:
$1,700
Percentage of individuals using paid preparers for their 2004 taxes: 64.0%
Here:
64%
State:
55%
(% for various income ranges: 63.4% for AGIs below $10k, 55.9% for AGIs $10k-25k, 61.9% for AGIs $25k-50k, 60.4% for AGIs $50k-75k, 68.9% for AGIs $75k-100k, 66.2% for AGIs over 100k)
Household received Food Stamps/SNAP in the past 12 months: 13 Household did not receive Food Stamps/SNAP in the past 12 months: 276
Women who had a birth in the past 12 months: 20 (20 now married, 0 unmarried) Women who did not have a birth in the past 12 months: 93 (42 now married, 50 unmarried)
Housing units in zip code 20645 with a mortgage: 206 (19 second mortgage, 20 both second mortgage and home equity loan) Median monthly owner costs for units with a mortgage: $2,443 Median monthly owner costs for units without a mortgage: $860
Median number of rooms in houses and condos:
Here:
6.4
State:
7.3
Notable locations in this zip code not listed on our city pages
Size of family households: 134 2-persons, 46 3-persons, 34 4-persons, 20 6-persons
Size of nonfamily households: 56 1-person
135 married couples with children.
19 single-parent households (11 men, 8 women).
99.6% of residents of 20645 zip code speak English at home.
Foreign born population: 0 (0.0%)
:
0.0%
Whole state:
16.7%
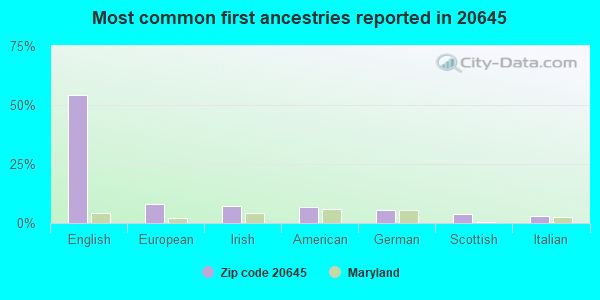
54%English
8%European
7%Irish
7%American
5%German
4%Scottish
3%Italian
Year of entry for the foreign-born population
02010 or later
02000 to 2009
01990 to 1999
8Before 1990
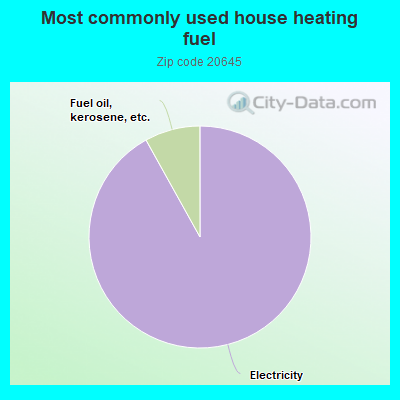
92.3%Electricity
8.1%Fuel oil, kerosene, etc.
Population in 1990: 87. Population change in the 1990s: +278 (+319.5%).
Place of birth for U.S.-born residents:
This state: 286
Northeast: 97
Midwest: 21
South: 235
West: 102
64% of the 20645 zip code residents lived in the same house 5 years ago. Out of people who lived in different houses, 67% lived in this county. Out of people who lived in different counties, 50% lived in Maryland.
97% of the 20645 zip code residents lived in the same house 1 year ago. Out of people who lived in different houses, 47% moved from this county. Out of people who lived in different houses, 58% moved from different state.
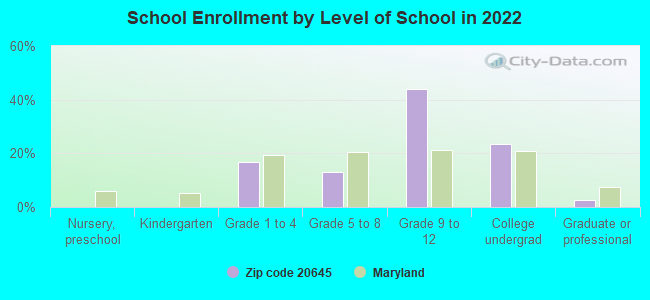
Private vs. public school enrollment:
Students in private schools in grades 1 to 8 (elementary and middle school):
Here:
0.0%
Maryland:
15.2%
Students in private schools in grades 9 to 12 (high school):
Here:
0.0%
Maryland:
14.4%
Students in private undergraduate colleges:
Here:
0.0%
Maryland:
20.2%
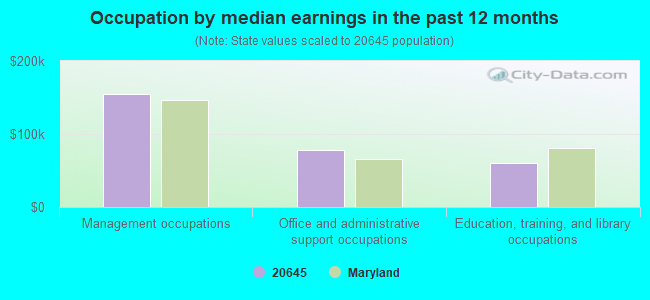
Occupation by median earnings in the past 12 months ($)
154,381Management occupations
77,553Office and administrative support occupations
60,806Education, training, and library occupations
Companies with federal contracts located in this zip code:
POE CONSULTING GROUP INC (11325 ETHAN COURT in ISSUE, MD; small business) : $99,375 in 2 contractsfrom 2004 to 2005
$80,000 with Army for Program Management/Support Services. Signed on 2004-12-15. Completion date: 2005-12-14.
$19,375, same as above.Signed on 2005-09-10. Completion date: 2005-12-14.
Top industries in this zip code by the number of employees in 2005:
Arts, Entertainment, and Recreation: Golf Courses and Country Clubs (50-99 employees: 1 establishment)
Construction: Electrical Contractors (5-9: 1)
Construction: Residential Remodelers (5-9: 1)
Construction: New Single-Family Housing Construction (except Operative Builders) (1-4: 3)
Professional, Scientific, and Technical Services: Administrative Management and General Management Consulting Services (1-4: 1)
Accommodation and Food Services: Full-Service Restaurants (1-4: 1)
Arts, Entertainment, and Recreation: All Other Amusement and Recreation Industries (1-4: 1)
Wholesale Trade: Fish and Seafood Merchant Wholesalers (1-4: 1)
Construction: Land Subdivision (1-4: 1)
Home Mortgage Disclosure Act Aggregated Statistics For Year 2009 (Based on 2 partial tracts)
A) FHA, FSA/RHS & VA Home Purchase Loans
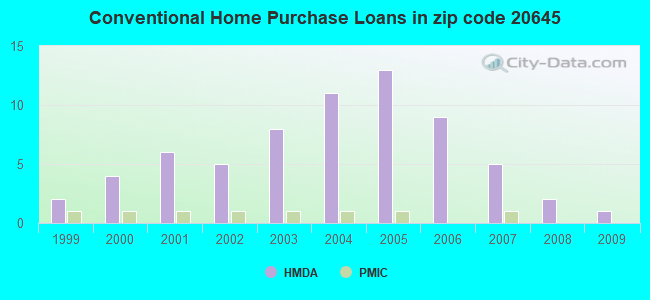
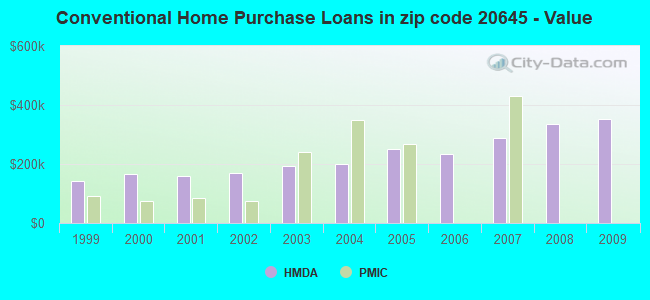
B) Conventional Home Purchase Loans
C) Refinancings
D) Home Improvement Loans
F) Non-occupant Loans on < 5 Family Dwellings (A B C & D)
Number
Average Value
Number
Average Value
Number
Average Value
Number
Average Value
Number
Average Value
LOANS ORIGINATED
2
$221,665
1
$352,520
11
$256,077
1
$94,390
2
$331,275
APPLICATIONS APPROVED, NOT ACCEPTED
0
$0
0
$0
1
$330,470
0
$0
0
$0
APPLICATIONS DENIED
0
$0
0
$0
5
$289,050
1
$46,570
0
$0
APPLICATIONS WITHDRAWN
0
$0
0
$0
2
$292,875
0
$0
0
$0
FILES CLOSED FOR INCOMPLETENESS
0
$0
0
$0
1
$202,140
0
$0
0
$0
Aggregated Statistics For Year 2008 (Based on 2 partial tracts)
A) FHA, FSA/RHS & VA Home Purchase Loans
B) Conventional Home Purchase Loans
C) Refinancings
D) Home Improvement Loans
F) Non-occupant Loans on < 5 Family Dwellings (A B C & D)
Number
Average Value
Number
Average Value
Number
Average Value
Number
Average Value
Number
Average Value
LOANS ORIGINATED
2
$239,220
2
$334,230
8
$256,211
1
$128,410
1
$378,870
APPLICATIONS APPROVED, NOT ACCEPTED
0
$0
0
$0
1
$214,910
0
$0
0
$0
APPLICATIONS DENIED
0
$0
1
$392,300
4
$309,155
1
$129,430
1
$180,090
APPLICATIONS WITHDRAWN
0
$0
1
$144,100
2
$242,250
0
$0
0
$0
FILES CLOSED FOR INCOMPLETENESS
0
$0
0
$0
1
$210,750
0
$0
0
$0
Aggregated Statistics For Year 2007 (Based on 2 partial tracts)
A) FHA, FSA/RHS & VA Home Purchase Loans
B) Conventional Home Purchase Loans
C) Refinancings
D) Home Improvement Loans
F) Non-occupant Loans on < 5 Family Dwellings (A B C & D)
Number
Average Value
Number
Average Value
Number
Average Value
Number
Average Value
Number
Average Value
LOANS ORIGINATED
1
$269,590
5
$288,102
11
$262,727
2
$120,415
2
$253,965
APPLICATIONS APPROVED, NOT ACCEPTED
0
$0
1
$277,330
2
$231,375
0
$0
0
$0
APPLICATIONS DENIED
0
$0
1
$278,350
9
$288,439
1
$122,420
1
$249,290
APPLICATIONS WITHDRAWN
0
$0
1
$156,370
3
$275,283
0
$0
0
$0
FILES CLOSED FOR INCOMPLETENESS
0
$0
0
$0
1
$334,560
0
$0
0
$0
Aggregated Statistics For Year 2006 (Based on 2 partial tracts)
B) Conventional Home Purchase Loans
C) Refinancings
D) Home Improvement Loans
F) Non-occupant Loans on < 5 Family Dwellings (A B C & D)
Number
Average Value
Number
Average Value
Number
Average Value
Number
Average Value
LOANS ORIGINATED
9
$233,600
19
$213,963
3
$72,367
2
$225,900
APPLICATIONS APPROVED, NOT ACCEPTED
1
$291,420
2
$289,735
0
$0
0
$0
APPLICATIONS DENIED
2
$176,915
8
$241,274
1
$131,400
0
$0
APPLICATIONS WITHDRAWN
1
$172,350
7
$263,186
1
$79,060
0
$0
FILES CLOSED FOR INCOMPLETENESS
0
$0
2
$164,945
0
$0
0
$0
Aggregated Statistics For Year 2005 (Based on 2 partial tracts)
A) FHA, FSA/RHS & VA Home Purchase Loans
B) Conventional Home Purchase Loans
C) Refinancings
D) Home Improvement Loans
F) Non-occupant Loans on < 5 Family Dwellings (A B C & D)
Number
Average Value
Number
Average Value
Number
Average Value
Number
Average Value
Number
Average Value
LOANS ORIGINATED
1
$125,270
13
$252,030
21
$223,425
3
$99,647
3
$252,263
APPLICATIONS APPROVED, NOT ACCEPTED
0
$0
1
$230,240
3
$184,423
1
$53,730
0
$0
APPLICATIONS DENIED
0
$0
2
$264,260
7
$212,524
2
$57,120
1
$101,830
APPLICATIONS WITHDRAWN
0
$0
2
$270,210
7
$234,371
1
$84,970
1
$154,910
FILES CLOSED FOR INCOMPLETENESS
0
$0
0
$0
2
$189,980
0
$0
0
$0
Aggregated Statistics For Year 2004 (Based on 2 partial tracts)
A) FHA, FSA/RHS & VA Home Purchase Loans
B) Conventional Home Purchase Loans
C) Refinancings
D) Home Improvement Loans
F) Non-occupant Loans on < 5 Family Dwellings (A B C & D)
Number
Average Value
Number
Average Value
Number
Average Value
Number
Average Value
Number
Average Value
LOANS ORIGINATED
1
$127,310
11
$200,325
15
$191,489
2
$107,165
3
$182,477
APPLICATIONS APPROVED, NOT ACCEPTED
0
$0
1
$129,210
2
$149,140
1
$36,430
0
$0
APPLICATIONS DENIED
0
$0
2
$177,100
6
$176,113
1
$61,680
0
$0
APPLICATIONS WITHDRAWN
0
$0
1
$171,190
7
$180,404
1
$21,750
0
$0
FILES CLOSED FOR INCOMPLETENESS
0
$0
0
$0
1
$211,850
0
$0
0
$0
Aggregated Statistics For Year 2003 (Based on 2 partial tracts)
A) FHA, FSA/RHS & VA Home Purchase Loans
B) Conventional Home Purchase Loans
C) Refinancings
D) Home Improvement Loans
F) Non-occupant Loans on < 5 Family Dwellings (A B C & D)
Number
Average Value
Number
Average Value
Number
Average Value
Number
Average Value
Number
Average Value
LOANS ORIGINATED
2
$140,085
8
$191,708
28
$161,940
1
$27,890
3
$147,290
APPLICATIONS APPROVED, NOT ACCEPTED
0
$0
1
$124,830
3
$126,143
0
$0
0
$0
APPLICATIONS DENIED
0
$0
0
$0
5
$144,818
1
$18,180
0
$0
APPLICATIONS WITHDRAWN
1
$90,370
1
$97,310
5
$145,052
0
$0
0
$0
FILES CLOSED FOR INCOMPLETENESS
0
$0
0
$0
1
$107,890
0
$0
0
$0
Aggregated Statistics For Year 2002 (Based on 2 partial tracts)
A) FHA, FSA/RHS & VA Home Purchase Loans
B) Conventional Home Purchase Loans
C) Refinancings
D) Home Improvement Loans
F) Non-occupant Loans on < 5 Family Dwellings (A B C & D)
Number
Average Value
Number
Average Value
Number
Average Value
Number
Average Value
Number
Average Value
LOANS ORIGINATED
2
$159,540
5
$170,558
15
$154,040
1
$15,180
2
$109,280
APPLICATIONS APPROVED, NOT ACCEPTED
0
$0
0
$0
1
$179,510
0
$0
0
$0
APPLICATIONS DENIED
0
$0
0
$0
4
$112,950
1
$25,180
0
$0
APPLICATIONS WITHDRAWN
0
$0
1
$52,050
4
$135,908
0
$0
0
$0
FILES CLOSED FOR INCOMPLETENESS
0
$0
0
$0
0
$0
0
$0
0
$0
Aggregated Statistics For Year 2001 (Based on 2 partial tracts)
A) FHA, FSA/RHS & VA Home Purchase Loans
B) Conventional Home Purchase Loans
C) Refinancings
D) Home Improvement Loans
F) Non-occupant Loans on < 5 Family Dwellings (A B C & D)
Number
Average Value
Number
Average Value
Number
Average Value
Number
Average Value
Number
Average Value
LOANS ORIGINATED
2
$115,375
6
$159,092
11
$153,598
1
$24,820
1
$150,090
APPLICATIONS APPROVED, NOT ACCEPTED
0
$0
1
$74,820
2
$146,695
0
$0
0
$0
APPLICATIONS DENIED
0
$0
1
$50,520
4
$138,080
1
$20,880
0
$0
APPLICATIONS WITHDRAWN
0
$0
1
$77,310
4
$141,530
0
$0
0
$0
FILES CLOSED FOR INCOMPLETENESS
0
$0
0
$0
0
$0
0
$0
0
$0
Aggregated Statistics For Year 2000 (Based on 2 partial tracts)
A) FHA, FSA/RHS & VA Home Purchase Loans
B) Conventional Home Purchase Loans
C) Refinancings
D) Home Improvement Loans
F) Non-occupant Loans on < 5 Family Dwellings (A B C & D)
Number
Average Value
Number
Average Value
Number
Average Value
Number
Average Value
Number
Average Value
LOANS ORIGINATED
2
$93,950
4
$165,765
3
$128,287
2
$15,840
1
$95,560
APPLICATIONS APPROVED, NOT ACCEPTED
0
$0
0
$0
1
$82,560
0
$0
0
$0
APPLICATIONS DENIED
0
$0
1
$111,980
3
$377,217
1
$24,890
0
$0
APPLICATIONS WITHDRAWN
0
$0
0
$0
2
$72,345
0
$0
0
$0
FILES CLOSED FOR INCOMPLETENESS
0
$0
0
$0
0
$0
0
$0
0
$0
Aggregated Statistics For Year 1999 (Based on 1 partial tract)
A) FHA, FSA/RHS & VA Home Purchase Loans
B) Conventional Home Purchase Loans
C) Refinancings
D) Home Improvement Loans
F) Non-occupant Loans on < 5 Family Dwellings (A B C & D)

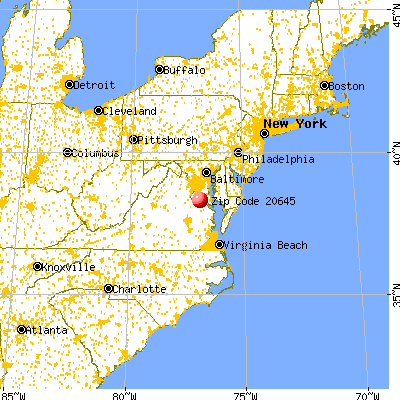


 Nearest zip codes: 20664, 20625, 20621, 22448, 20622, 20618.


 : $99,375 in 2 contracts from 2004 to 2005