Estimated zip code population in 2022: 1,210 Zip code population in 2010: 1,088 Zip code population in 2000: 593
Houses and condos: 359 Renter-occupied apartments: 16
% of renters here:
5%
State:
32%
March 2022 cost of living index in zip code 20693: 130.0 (high, U.S. average is 100)
Land area: 20.2 sq. mi. Water area: 5.3 sq. mi.
Population density: 60 people per square mile
(very low).
OSM Map
General Map
Google Map
MSN Map
OSM Map
General Map
Google Map
MSN Map
OSM Map
General Map
Google Map
MSN Map
OSM Map
General Map
Google Map
MSN Map
Please wait while loading the map...
Real estate property taxes paid for housing units in 2022:
This zip code:
1.2% ($5,261)
Maryland:
0.9% ($3,777)
Median real estate property taxes paid for housing units with mortgages in 2022: $5,136 (1.1%) Median real estate property taxes paid for housing units with no mortgage in 2022: $5,495 (1.2%)
Business Search- 14 Million verified businesses
Males: 428
(35.4%)
Females: 782
(64.6%)
For population 25 years and over in 20693:
High school or higher: 96.5%
Bachelor's degree or higher: 37.4%
Graduate or professional degree: 20.4%
Unemployed: 4.9%
Mean travel time to work (commute): 48.4 minutes
For population 15 years and over in 20693:
Never married: 38.1%
Now married: 54.9%
Separated: 2.2%
Widowed: 1.8%
Divorced: 3.0%
Zip code 20693 compared to state average:
Black race population percentage below state average.
Median age significantly below state average.
Foreign-born population percentage significantly below state average.
Renting percentage significantly below state average.
Length of stay since moving in significantly above state average.
Number of rooms per house above state average.
House age below state average.
Number of college students significantly below state average.
Percentage of population with a bachelor's degree or higher below state average.
Estimated median house/condo value in 2022: $453,761
20693:
$453,761
Maryland:
$398,100
Median resident age:
This zip code:
30.0 years
Maryland median age:
39.7 years
Average household size:
This zip code:
3.7 people
Maryland:
2.5 people
Averages for the 2020 tax year for zip code 20693, filed in 2021:
Average Adjusted Gross Income (AGI) in 2020: $89,220 (Individual Income Tax Returns)
Here:
$89,220
State:
$86,905
Salary/wage: $81,153 (reported on 78.3% of returns)
Here:
$81,153
State:
$73,953
(% of AGI for various income ranges: 1318.9% for AGIs below $25k, 3558.6% for AGIs $25k-50k, 6298.6% for AGIs $50k-75k, 11440.0% for AGIs $75k-100k, 16691.0% for AGIs $100k-200k)
Taxable interest for individuals: $1,064 (reported on 41.7% of returns)
This zip code:
$1,064
Maryland:
$1,528
(% of AGI for various income ranges: 6.7% for AGIs below $25k, 12.9% for AGIs $25k-50k, 75.7% for AGIs $50k-75k, 92.5% for AGIs $75k-100k, 59.0% for AGIs $100k-200k)
Ordinary dividends: $5,664 (reported on 18.3% of returns)
Here:
$5,664
State:
$8,028
(% of AGI for various income ranges: 111.4% for AGIs $50k-75k, 114.0% for AGIs $100k-200k)
Net capital gain/loss in AGI: +$9,022 (reported on 15.0% of returns)
Here:
+$9,022
State:
+$25,238
(% of AGI for various income ranges: 27.1% for AGIs $50k-75k, 267.0% for AGIs $100k-200k)
Profit/loss from business: +$10,633 (reported on 15.0% of returns)
Here:
+$10,633
State:
+$11,398
(% of AGI for various income ranges: 45.6% for AGIs below $25k, 354.3% for AGIs $25k-50k, 668.0% for AGIs $100k-200k)
Taxable individual retirement arrangement distribution: $12,160 (reported on 8.3% of returns)
20693:
$12,160
Maryland:
$20,944
(% of AGI for various income ranges: 360.0% for AGIs $25k-50k, 356.0% for AGIs $100k-200k)
Total itemized deductions: $26,173 (reported on 25.0% of returns)
Here:
$26,173
State:
$30,672
(% of AGI for various income ranges: 921.4% for AGIs $50k-75k, 1580.0% for AGIs $75k-100k, 1935.0% for AGIs $100k-200k)
Charity contributions: $5,758 (reported on 20.0% of returns)
Here:
$5,758
State:
$9,065
(% of AGI for various income ranges: 95.7% for AGIs $25k-50k, 332.5% for AGIs $75k-100k, 491.0% for AGIs $100k-200k)
Taxes paid: $8,853 (reported on 25.0% of returns)
20693:
$8,853
State:
$8,475
(% of AGI for various income ranges: 300.0% for AGIs $50k-75k, 530.0% for AGIs $75k-100k, 691.0% for AGIs $100k-200k)
Earned income credit: $2,150 (reported on 6.7% of returns)
Here:
$2,150
State:
$2,151
(% of AGI for various income ranges: 95.6% for AGIs below $25k)
Percentage of individuals using paid preparers for their 2020 taxes: 90.0%
Here:
90%
State:
90%
(% for various income ranges: 91.7% for AGIs below $25k, 81.8% for AGIs $25k-50k, 90.0% for AGIs $50k-75k, 100.0% for AGIs $75k-100k, 93.3% for AGIs $100k-200k, 80.0% for AGIs over 200k)
Averages for the 2012 tax year for zip code 20693, filed in 2013:
Average Adjusted Gross Income (AGI) in 2012: $79,492 (Individual Income Tax Returns)
Here:
$79,492
State:
$72,703
Salary/wage: $71,327 (reported on 81.4% of returns)
Here:
$71,327
State:
$62,228
(% of AGI for various income ranges: 66.9% for AGIs below $25k, 74.0% for AGIs $25k-50k, 78.5% for AGIs $50k-75k, 73.6% for AGIs $75k-100k, 80.7% for AGIs $100k-200k, 57.4% for AGIs over 200k)
Taxable interest for individuals: $1,436 (reported on 47.5% of returns)
This zip code:
$1,436
Maryland:
$1,413
(% of AGI for various income ranges: 0.7% for AGIs below $25k, 0.4% for AGIs $25k-50k, 0.4% for AGIs $50k-75k, 0.4% for AGIs $75k-100k, 0.3% for AGIs $100k-200k, 2.5% for AGIs over 200k)
Ordinary dividends: $1,670 (reported on 16.9% of returns)
Here:
$1,670
State:
$6,933
(% of AGI for various income ranges: 1.3% for AGIs below $25k, 0.7% for AGIs $50k-75k, 0.6% for AGIs $100k-200k)
Net capital gain/loss in AGI: +$10,638 (reported on 13.6% of returns)
Here:
+$10,638
State:
+$14,830
Profit/loss from business: +$13,257 (reported on 11.9% of returns)
Here:
+$13,257
State:
+$12,606
(% of AGI for various income ranges: 8.6% for AGIs below $25k, 11.2% for AGIs $25k-50k, 1.5% for AGIs $100k-200k)
Taxable individual retirement arrangement distribution: $11,250 (reported on 6.8% of returns)
20693:
$11,250
Maryland:
$17,065
Total itemized deductions: $26,479 (22% of AGI, reported on 55.9% of returns)
Here:
$26,479
State:
$27,886
Here:
22.5% of AGI
State:
22.8% of AGI
(% of AGI for various income ranges: 20.0% for AGIs below $25k, 15.3% for AGIs $25k-50k, 18.4% for AGIs $50k-75k, 20.9% for AGIs $75k-100k, 21.0% for AGIs $100k-200k, 14.2% for AGIs over 200k)
Charity contributions: $2,552 (reported on 49.2% of returns)
Here:
$2,552
State:
$4,452
(% of AGI for various income ranges: 1.3% for AGIs below $25k, 1.8% for AGIs $25k-50k, 1.4% for AGIs $50k-75k, 2.1% for AGIs $75k-100k, 1.7% for AGIs $100k-200k, 1.2% for AGIs over 200k)
Taxes paid: $11,458 (reported on 55.9% of returns)
20693:
$11,458
State:
$11,690
(% of AGI for various income ranges: 5.0% for AGIs below $25k, 4.2% for AGIs $25k-50k, 6.6% for AGIs $50k-75k, 9.0% for AGIs $75k-100k, 9.4% for AGIs $100k-200k, 7.9% for AGIs over 200k)
Earned income credit: $2,217 (reported on 10.2% of returns)
Here:
$2,217
State:
$2,199
(% of AGI for various income ranges: 6.3% for AGIs below $25k)
Percentage of individuals using paid preparers for their 2012 taxes: 55.9%
Here:
56%
State:
52%
(% for various income ranges: 47.1% for AGIs below $25k, 54.5% for AGIs $25k-50k, 57.1% for AGIs $50k-75k, 57.1% for AGIs $75k-100k, 64.3% for AGIs $100k-200k, 66.7% for AGIs over 200k)
Averages for the 2004 tax year for zip code 20693, filed in 2005:
Average Adjusted Gross Income (AGI) in 2004: $68,561 (Individual Income Tax Returns)
Here:
$68,561
State:
$60,339
Salary/wage: $57,974 (reported on 88.7% of returns)
Here:
$57,974
State:
$52,211
(% of AGI for various income ranges: 115.6% for AGIs below $10k, 76.7% for AGIs $10k-25k, 84.1% for AGIs $25k-50k, 82.0% for AGIs $50k-75k, 86.5% for AGIs $75k-100k, 68.3% for AGIs over 100k)
Taxable interest for individuals: $1,158 (reported on 50.1% of returns)
This zip code:
$1,158
Maryland:
$1,701
(% of AGI for various income ranges: 5.0% for AGIs below $10k, 1.1% for AGIs $10k-25k, 0.5% for AGIs $25k-50k, 0.5% for AGIs $50k-75k, 0.3% for AGIs $75k-100k, 1.1% for AGIs over 100k)
Taxable dividends: $1,260 (reported on 17.6% of returns)
Here:
$1,260
State:
$4,235
(% of AGI for various income ranges: 0.3% for AGIs $10k-25k, 0.3% for AGIs $50k-75k, 0.0% for AGIs $75k-100k, 0.5% for AGIs over 100k)
Net capital gain/loss: +$30,014 (reported on 12.7% of returns)
Here:
+$30,014
State:
+$15,888
Profit/loss from business: +$6,027 (reported on 13.1% of returns)
Here:
+$6,027
State:
+$12,221
(% of AGI for various income ranges: 10.3% for AGIs below $10k, -0.2% for AGIs $10k-25k, 6.7% for AGIs $50k-75k, 0.2% for AGIs over 100k)
Total itemized deductions: $25,913 (24% of AGI, reported on 54.7% of returns)
Here:
$25,913
State:
$22,960
Here:
24.4% of AGI
State:
23.3% of AGI
(% of AGI for various income ranges: 10.8% for AGIs $10k-25k, 19.7% for AGIs $25k-50k, 22.4% for AGIs $50k-75k, 25.5% for AGIs $75k-100k, 20.4% for AGIs over 100k)
Charity contributions deductions: $4,750 (4% of AGI, reported on 50.1% of returns)
Here:
$4,750
State:
$4,031
Here:
4.3% of AGI
State:
3.9% of AGI
(% of AGI for various income ranges: 1.3% for AGIs $10k-25k, 2.6% for AGIs $25k-50k, 2.5% for AGIs $50k-75k, 2.9% for AGIs $75k-100k, 4.2% for AGIs over 100k)
Total tax: $10,443 (reported on 81.3% of returns)
20693:
$10,443
State:
$10,167
(% of AGI for various income ranges: 2.7% for AGIs below $10k, 3.4% for AGIs $10k-25k, 6.4% for AGIs $25k-50k, 9.0% for AGIs $50k-75k, 9.1% for AGIs $75k-100k, 16.0% for AGIs over 100k)
Earned income credit: $2,051 (reported on 10.4% of returns)
Here:
$2,051
State:
$1,700
Percentage of individuals using paid preparers for their 2004 taxes: 60.8%
Here:
61%
State:
55%
(% for various income ranges: 44.0% for AGIs below $10k, 59.6% for AGIs $10k-25k, 56.4% for AGIs $25k-50k, 63.2% for AGIs $50k-75k, 63.2% for AGIs $75k-100k, 73.8% for AGIs over 100k)
Household received Food Stamps/SNAP in the past 12 months: 8 Household did not receive Food Stamps/SNAP in the past 12 months: 315
Women who had a birth in the past 12 months: 5 (5 now married, 0 unmarried) Women who did not have a birth in the past 12 months: 339 (104 now married, 234 unmarried)
Housing units in zip code 20693 with a mortgage: 231 (41 second mortgage, 17 both second mortgage and home equity loan) Houses without a mortgage: 7
Median monthly owner costs for units with a mortgage: $2,631 Median monthly owner costs for units without a mortgage: $896
Residents with income below the poverty level in 2022:
This zip code:
4.7%
Whole state:
9.6%
Residents with income below 50% of the poverty level in 2022:
This zip code:
1.8%
Whole state:
4.7%
Median number of rooms in houses and condos:
Here:
7.8
State:
7.3
Notable locations in this zip code not listed on our city pages
Notable locations in zip code 20693: Goose Bay Marina (A), Harry Diamond Laboratories (B), Welcome (C), Blossom Point Proving Grounds (D). Display/hide their locations on the map
Size of family households: 64 2-persons, 88 3-persons, 53 4-persons, 24 6-persons, 26 7-or-more-persons
Size of nonfamily households: 59 1-person, 8 3-persons
284 married couples with children.
0 single-parent households ().
96.2% of residents of 20693 zip code speak English at home.
2.5% of residents speak Spanish at home (100% very well).
Foreign born population: 0 (0.0%)
:
0.0%
Whole state:
16.7%
44%English
6%German
5%European
4%Northern European
4%Irish
2%Greek
1%American
Year of entry for the foreign-born population
02010 or later
02000 to 2009
151990 to 1999
44Before 1990
Facilities with environmental interests located in this zip code:
COLDSPRING SAND AND GRAVEL (8835 GUNSTON ROAD in WELCOME, MD)
National Pollutant Discharge Elimination System NON-MAJOR (Tracking pollutant discharge elimination systems) - permit Business SIC classification: CONSTRUCTION SAND AND GRAVEL Alternative names: BARDON,INC., LA PLATA SAND AND GRAVEL
88.3%Electricity
11.4%Fuel oil, kerosene, etc.
0.9%Wood
Population in 1990: 334. Population change in the 1990s: +259 (+77.5%).
Place of birth for U.S.-born residents:
This state: 842
Northeast: 9
Midwest: 35
South: 190
West: 64
59% of the 20693 zip code residents lived in the same house 5 years ago. Out of people who lived in different houses, 67% lived in this county. Out of people who lived in different counties, 50% lived in Maryland.
90% of the 20693 zip code residents lived in the same house 1 year ago. Out of people who lived in different houses, 13% moved from this county. Out of people who lived in different houses, 82% moved from different state.
Private vs. public school enrollment:
Students in private schools in grades 1 to 8 (elementary and middle school):
Here:
0.0%
Maryland:
15.2%
Students in private schools in grades 9 to 12 (high school): 96
Here:
70.8%
Maryland:
14.4%
Students in private undergraduate colleges:
Here:
0.0%
Maryland:
20.2%
Occupation by median earnings in the past 12 months ($)
93,008Construction and extraction occupations
75,019Business and financial operations occupations
68,094Office and administrative support occupations
33,456Sales and related occupations
30,470Installation, maintenance, and repair occupations
17,493Food preparation and serving related occupations
Top industries in this zip code by the number of employees in 2005:
Professional, Scientific, and Technical Services: Process, Physical Distribution, and Logistics Consulting Services (20-49 employees: 1 establishment)
Construction: Site Preparation Contractors (5-9: 1, 1-4: 2)
Accommodation and Food Services: Recreational and Vacation Camps (except Campgrounds) (5-9: 1)
Construction: Electrical Contractors (1-4: 1)
Professional, Scientific, and Technical Services: Drafting Services (1-4: 1)
Health Care and Social Assistance: Offices of Mental Health Practitioners (except Physicians) (1-4: 1)
Fatal accident statistics in 2014:
Fatal accident count: 1
Vehicles involved in fatal accidents: 1
Fatal accidents caused by drunken drivers: 1
Fatalities: 1
Persons involved in fatal accidents: 1
Pedestrians involved in fatal accidents: 0
Fatal accident statistics in 2011:
Fatal accident count: 1
Vehicles involved in fatal accidents: 1
Fatal accidents caused by drunken drivers: 1
Fatalities: 1
Persons involved in fatal accidents: 1
Pedestrians involved in fatal accidents: 0
Home Mortgage Disclosure Act Aggregated Statistics For Year 2009 (Based on 2 partial tracts)
A) FHA, FSA/RHS & VA Home Purchase Loans
B) Conventional Home Purchase Loans
C) Refinancings
D) Home Improvement Loans
F) Non-occupant Loans on < 5 Family Dwellings (A B C & D)
Number
Average Value
Number
Average Value
Number
Average Value
Number
Average Value
Number
Average Value
LOANS ORIGINATED
10
$276,759
9
$335,742
96
$245,171
4
$45,015
2
$412,670
APPLICATIONS APPROVED, NOT ACCEPTED
0
$0
0
$0
9
$286,387
0
$0
0
$0
APPLICATIONS DENIED
4
$652,368
2
$511,840
27
$342,073
7
$38,389
2
$271,460
APPLICATIONS WITHDRAWN
1
$351,890
1
$274,200
27
$321,863
1
$132,530
1
$132,530
FILES CLOSED FOR INCOMPLETENESS
1
$265,060
0
$0
5
$288,092
1
$129,790
0
$0
Aggregated Statistics For Year 2008 (Based on 2 partial tracts)
A) FHA, FSA/RHS & VA Home Purchase Loans
B) Conventional Home Purchase Loans
C) Refinancings
D) Home Improvement Loans
F) Non-occupant Loans on < 5 Family Dwellings (A B C & D)
G) Loans On Manufactured Home Dwelling (A B C & D)
Number
Average Value
Number
Average Value
Number
Average Value
Number
Average Value
Number
Average Value
Number
Average Value
LOANS ORIGINATED
4
$259,120
7
$328,126
56
$305,048
8
$121,105
0
$0
1
$236,730
APPLICATIONS APPROVED, NOT ACCEPTED
0
$0
0
$0
10
$318,163
4
$109,908
1
$137,100
0
$0
APPLICATIONS DENIED
2
$168,175
1
$425,010
25
$356,935
5
$214,058
1
$425,010
2
$85,460
APPLICATIONS WITHDRAWN
0
$0
2
$217,075
18
$338,586
1
$9,140
1
$73,120
0
$0
FILES CLOSED FOR INCOMPLETENESS
0
$0
1
$191,940
3
$335,133
0
$0
0
$0
0
$0
Aggregated Statistics For Year 2007 (Based on 2 partial tracts)
A) FHA, FSA/RHS & VA Home Purchase Loans
B) Conventional Home Purchase Loans
C) Refinancings
D) Home Improvement Loans
F) Non-occupant Loans on < 5 Family Dwellings (A B C & D)
G) Loans On Manufactured Home Dwelling (A B C & D)
Number
Average Value
Number
Average Value
Number
Average Value
Number
Average Value
Number
Average Value
Number
Average Value
LOANS ORIGINATED
4
$262,548
25
$309,334
83
$229,678
16
$125,104
8
$273,400
0
$0
APPLICATIONS APPROVED, NOT ACCEPTED
0
$0
2
$544,285
10
$284,620
7
$189,459
1
$111,510
0
$0
APPLICATIONS DENIED
0
$0
5
$383,514
51
$354,112
16
$184,628
3
$321,423
1
$15,540
APPLICATIONS WITHDRAWN
2
$308,930
3
$102,977
22
$302,285
2
$283,340
3
$218,750
0
$0
FILES CLOSED FOR INCOMPLETENESS
0
$0
1
$694,640
6
$275,113
1
$36,560
0
$0
0
$0
Aggregated Statistics For Year 2006 (Based on 2 partial tracts)
B) Conventional Home Purchase Loans
C) Refinancings
D) Home Improvement Loans
F) Non-occupant Loans on < 5 Family Dwellings (A B C & D)
G) Loans On Manufactured Home Dwelling (A B C & D)
Number
Average Value
Number
Average Value
Number
Average Value
Number
Average Value
Number
Average Value
LOANS ORIGINATED
41
$283,987
138
$273,154
30
$96,884
5
$306,008
2
$201,080
APPLICATIONS APPROVED, NOT ACCEPTED
9
$214,993
17
$276,781
7
$74,034
1
$45,700
0
$0
APPLICATIONS DENIED
16
$241,868
48
$296,345
8
$52,555
1
$114,250
0
$0
APPLICATIONS WITHDRAWN
10
$341,379
36
$284,635
1
$365,600
2
$617,405
0
$0
FILES CLOSED FOR INCOMPLETENESS
1
$442,380
10
$293,485
0
$0
0
$0
0
$0
Aggregated Statistics For Year 2005 (Based on 2 partial tracts)
A) FHA, FSA/RHS & VA Home Purchase Loans
B) Conventional Home Purchase Loans
C) Refinancings
D) Home Improvement Loans
F) Non-occupant Loans on < 5 Family Dwellings (A B C & D)
G) Loans On Manufactured Home Dwelling (A B C & D)
Number
Average Value
Number
Average Value
Number
Average Value
Number
Average Value
Number
Average Value
Number
Average Value
LOANS ORIGINATED
1
$112,420
53
$245,159
143
$227,778
22
$129,082
8
$253,864
0
$0
APPLICATIONS APPROVED, NOT ACCEPTED
0
$0
8
$247,238
18
$254,600
6
$37,932
1
$228,500
3
$201,993
APPLICATIONS DENIED
0
$0
5
$248,974
36
$311,268
8
$93,685
3
$124,913
0
$0
APPLICATIONS WITHDRAWN
0
$0
12
$225,758
47
$239,196
7
$295,221
2
$217,530
0
$0
FILES CLOSED FOR INCOMPLETENESS
0
$0
0
$0
12
$407,263
1
$288,820
0
$0
0
$0
Aggregated Statistics For Year 2004 (Based on 2 partial tracts)
A) FHA, FSA/RHS & VA Home Purchase Loans
B) Conventional Home Purchase Loans
C) Refinancings
D) Home Improvement Loans
F) Non-occupant Loans on < 5 Family Dwellings (A B C & D)
G) Loans On Manufactured Home Dwelling (A B C & D)
Number
Average Value
Number
Average Value
Number
Average Value
Number
Average Value
Number
Average Value
Number
Average Value
LOANS ORIGINATED
2
$192,395
52
$248,379
151
$223,506
16
$114,421
6
$177,620
0
$0
APPLICATIONS APPROVED, NOT ACCEPTED
0
$0
3
$142,280
18
$180,363
3
$39,910
0
$0
0
$0
APPLICATIONS DENIED
0
$0
5
$270,726
28
$207,739
10
$12,430
0
$0
2
$23,305
APPLICATIONS WITHDRAWN
0
$0
6
$394,087
48
$170,709
5
$95,056
0
$0
0
$0
FILES CLOSED FOR INCOMPLETENESS
0
$0
0
$0
6
$318,225
1
$45,700
0
$0
0
$0
Aggregated Statistics For Year 2003 (Based on 2 partial tracts)
A) FHA, FSA/RHS & VA Home Purchase Loans
B) Conventional Home Purchase Loans
C) Refinancings
D) Home Improvement Loans
F) Non-occupant Loans on < 5 Family Dwellings (A B C & D)
Number
Average Value
Number
Average Value
Number
Average Value
Number
Average Value
Number
Average Value
LOANS ORIGINATED
5
$168,908
56
$220,421
267
$181,284
21
$68,724
1
$464,310
APPLICATIONS APPROVED, NOT ACCEPTED
1
$125,220
5
$165,800
27
$167,127
3
$27,723
2
$168,175
APPLICATIONS DENIED
0
$0
3
$246,170
41
$191,739
3
$28,943
3
$248,000
APPLICATIONS WITHDRAWN
0
$0
5
$191,574
47
$169,946
2
$21,020
0
$0
FILES CLOSED FOR INCOMPLETENESS
0
$0
0
$0
8
$168,176
0
$0
0
$0
Aggregated Statistics For Year 2002 (Based on 2 partial tracts)
A) FHA, FSA/RHS & VA Home Purchase Loans
B) Conventional Home Purchase Loans
C) Refinancings
D) Home Improvement Loans
F) Non-occupant Loans on < 5 Family Dwellings (A B C & D)
Number
Average Value
Number
Average Value
Number
Average Value
Number
Average Value
Number
Average Value
LOANS ORIGINATED
7
$187,240
47
$195,188
147
$184,877
12
$24,449
5
$143,680
APPLICATIONS APPROVED, NOT ACCEPTED
0
$0
5
$98,346
18
$126,995
1
$35,650
1
$204,740
APPLICATIONS DENIED
0
$0
5
$123,024
36
$141,543
5
$18,098
0
$0
APPLICATIONS WITHDRAWN
1
$267,800
6
$200,013
32
$156,237
0
$0
1
$49,360
FILES CLOSED FOR INCOMPLETENESS
0
$0
4
$225,530
5
$141,670
0
$0
1
$106,940
Aggregated Statistics For Year 2001 (Based on 2 partial tracts)
A) FHA, FSA/RHS & VA Home Purchase Loans
B) Conventional Home Purchase Loans
C) Refinancings
D) Home Improvement Loans
F) Non-occupant Loans on < 5 Family Dwellings (A B C & D)
Number
Average Value
Number
Average Value
Number
Average Value
Number
Average Value
Number
Average Value
LOANS ORIGINATED
13
$173,942
43
$176,700
102
$152,745
10
$28,517
1
$42,960
APPLICATIONS APPROVED, NOT ACCEPTED
0
$0
5
$198,338
7
$142,193
2
$35,645
0
$0
APPLICATIONS DENIED
1
$114,250
3
$155,683
30
$137,191
5
$17,000
2
$52,555
APPLICATIONS WITHDRAWN
0
$0
8
$129,902
23
$120,767
1
$27,420
0
$0
FILES CLOSED FOR INCOMPLETENESS
0
$0
1
$18,280
4
$178,230
0
$0
0
$0
Aggregated Statistics For Year 2000 (Based on 2 partial tracts)
A) FHA, FSA/RHS & VA Home Purchase Loans
B) Conventional Home Purchase Loans
C) Refinancings
D) Home Improvement Loans
F) Non-occupant Loans on < 5 Family Dwellings (A B C & D)
Number
Average Value
Number
Average Value
Number
Average Value
Number
Average Value
Number
Average Value
LOANS ORIGINATED
7
$181,624
19
$165,289
34
$109,304
15
$26,933
2
$84,545
APPLICATIONS APPROVED, NOT ACCEPTED
1
$185,540
5
$81,346
12
$97,950
6
$39,607
2
$21,935
APPLICATIONS DENIED
1
$198,340
2
$142,585
32
$132,187
13
$28,123
0
$0
APPLICATIONS WITHDRAWN
1
$116,990
4
$156,980
16
$107,109
0
$0
2
$67,635
FILES CLOSED FOR INCOMPLETENESS
0
$0
1
$196,510
4
$78,832
0
$0
0
$0
Aggregated Statistics For Year 1999 (Based on 1 partial tract)
A) FHA, FSA/RHS & VA Home Purchase Loans
B) Conventional Home Purchase Loans
C) Refinancings
D) Home Improvement Loans
F) Non-occupant Loans on < 5 Family Dwellings (A B C & D)
Detailed PMIC statistics for the following Tracts:8505.00
2002 - 2018 National Fire Incident Reporting System (NFIRS) incidents
According to the data from the years 2002 - 2018 the average number of fire incidents per year is 10. The highest number of fires - 19 took place in 2002, and the least - 2 in 2010. The data has a decreasing trend.
When looking into fire subcategories, the most incidents belonged to: Outside Fires (45.0%), and Structure Fires (40.8%).
Fire incident types reported to NFIRS in Zip Code 20693

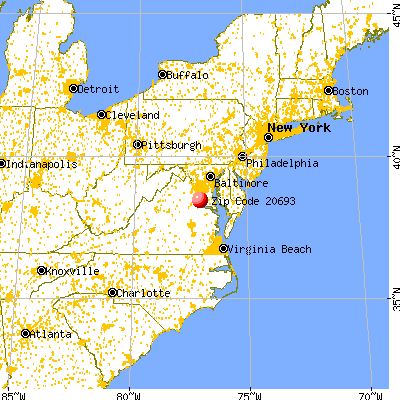


 Nearest zip codes: 20677, 20646, 20611, 20662, 20658, 20632.


 According to the data from the years 2002 - 2018 the average number of fire incidents per year is 10. The highest number of fires - 19 took place in 2002, and the least - 2 in 2010. The data has a decreasing trend.
 When looking into fire subcategories, the most incidents belonged to: Outside Fires (45.0%), and Structure Fires (40.8%).