Estimated zip code population in 2022: 2,670 Zip code population in 2010: 2,672 Zip code population in 2000: 2,810
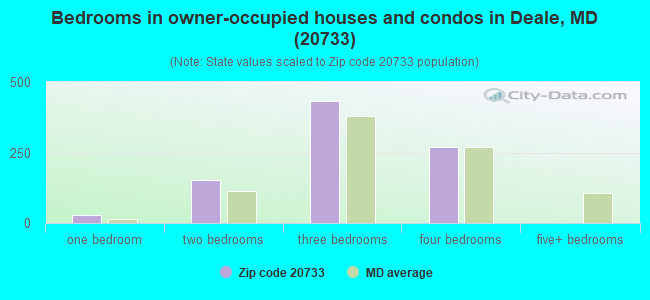
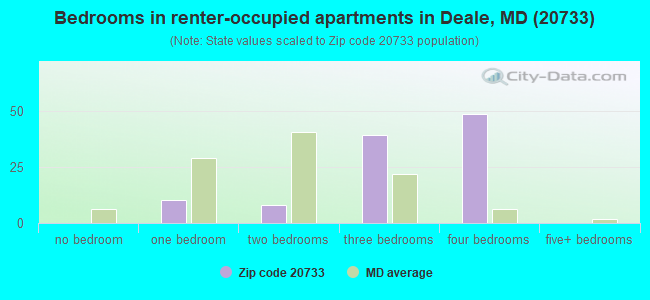
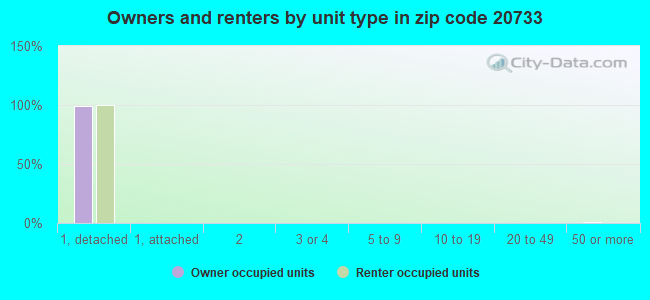
Houses and condos: 1,071 Renter-occupied apartments: 108
% of renters here:
11%
State:
32%
March 2022 cost of living index in zip code 20733: 107.9 (more than average, U.S. average is 100)
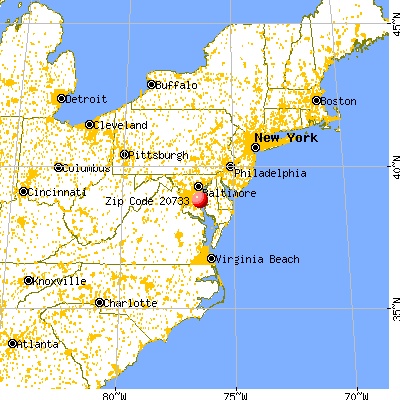
Land area: 3.3 sq. mi. Water area: 0.4 sq. mi.
Population density: 813 people per square mile
(low).
OSM Map
General Map
Google Map
MSN Map
OSM Map
General Map
Google Map
MSN Map
OSM Map
General Map
Google Map
MSN Map
OSM Map
General Map
Google Map
MSN Map
Please wait while loading the map...
Real estate property taxes paid for housing units in 2022:
This zip code:
0.8% ($3,042)
Maryland:
0.9% ($3,777)
Median real estate property taxes paid for housing units with mortgages in 2022: $3,170 (0.8%) Median real estate property taxes paid for housing units with no mortgage in 2022: $2,752 (0.7%)
Business Search- 14 Million verified businesses
Males: 1,085
(40.6%)
Females: 1,584
(59.4%)
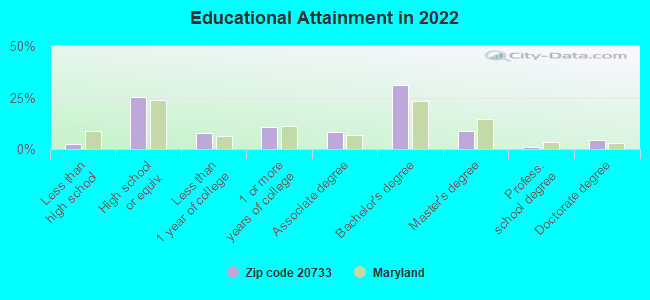
For population 25 years and over in 20733:
High school or higher: 97.8%
Bachelor's degree or higher: 45.6%
Graduate or professional degree: 14.5%
Unemployed: 7.2%
Mean travel time to work (commute): 49.7 minutes
For population 15 years and over in 20733:
Never married: 20.0%
Now married: 63.3%
Separated: 1.3%
Widowed: 3.4%
Divorced: 12.0%
Zip code 20733 compared to state average:
Unemployed percentage above state average.
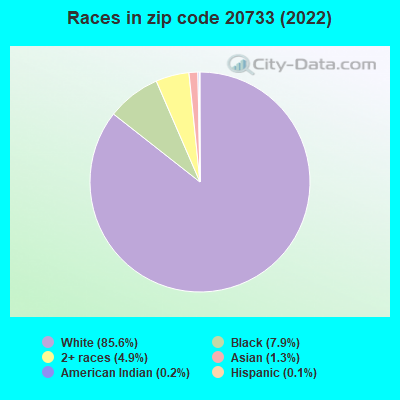
Black race population percentage significantly below state average.
Hispanic race population percentage significantly below state average.
Median age significantly above state average.
Foreign-born population percentage significantly below state average.
Renting percentage significantly below state average.
Length of stay since moving in significantly above state average.
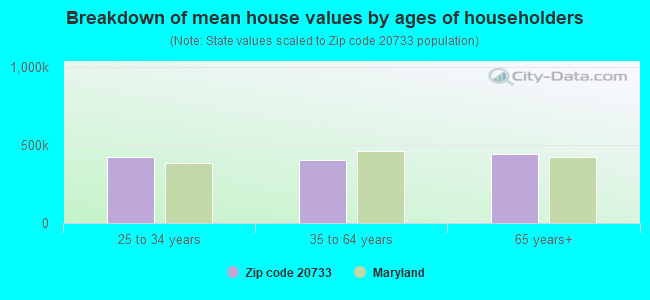
Estimated median house/condo value in 2022: $395,275
20733:
$395,275
Maryland:
$398,100
According to our research of Maryland and other state lists, there was 1 registered sex offender living in 20733 zip code as of June 15, 2024. The ratio of all residents to sex offenders in zip code 20733 is 2,943 to 1. The ratio of registered sex offenders to all residents in this zip code is much lower than the state average.
Median resident age:
This zip code:
48.4 years
Maryland median age:
39.7 years
Average household size:
This zip code:
2.7 people
Maryland:
2.5 people
Averages for the 2020 tax year for zip code 20733, filed in 2021:
Average Adjusted Gross Income (AGI) in 2020: $89,248 (Individual Income Tax Returns)
Here:
$89,248
State:
$86,905
Salary/wage: $78,273 (reported on 81.3% of returns)
Here:
$78,273
State:
$73,953
(% of AGI for various income ranges: 1206.5% for AGIs below $25k, 3339.6% for AGIs $25k-50k, 6486.2% for AGIs $50k-75k, 9671.0% for AGIs $75k-100k, 18502.4% for AGIs $100k-200k, 87203.3% for AGIs over 200k)
Taxable interest for individuals: $502 (reported on 40.7% of returns)
This zip code:
$502
Maryland:
$1,528
(% of AGI for various income ranges: 8.5% for AGIs below $25k, 13.3% for AGIs $25k-50k, 10.0% for AGIs $50k-75k, 66.0% for AGIs $75k-100k, 49.5% for AGIs $100k-200k, 236.7% for AGIs over 200k)
Ordinary dividends: $3,403 (reported on 21.3% of returns)
Here:
$3,403
State:
$8,028
(% of AGI for various income ranges: 18.0% for AGIs below $25k, 44.2% for AGIs $25k-50k, 70.6% for AGIs $50k-75k, 214.0% for AGIs $75k-100k, 154.3% for AGIs $100k-200k, 986.7% for AGIs over 200k)
Net capital gain/loss in AGI: +$15,218 (reported on 18.7% of returns)
Here:
+$15,218
State:
+$25,238
(% of AGI for various income ranges: 16.5% for AGIs below $25k, 27.9% for AGIs $25k-50k, 63.1% for AGIs $50k-75k, 69.0% for AGIs $75k-100k, 323.8% for AGIs $100k-200k, 11036.7% for AGIs over 200k)
Profit/loss from business: +$9,808 (reported on 16.0% of returns)
Here:
+$9,808
State:
+$11,398
(% of AGI for various income ranges: 85.0% for AGIs below $25k, 180.8% for AGIs $25k-50k, 40.6% for AGIs $50k-75k, 227.0% for AGIs $75k-100k, 384.3% for AGIs $100k-200k, 2170.0% for AGIs over 200k)
Taxable individual retirement arrangement distribution: $19,367 (reported on 10.0% of returns)
20733:
$19,367
Maryland:
$20,944
(% of AGI for various income ranges: 185.4% for AGIs $25k-50k, 349.4% for AGIs $50k-75k, 905.2% for AGIs $100k-200k)
Total itemized deductions: $27,511 (reported on 25.3% of returns)
Here:
$27,511
State:
$30,672
(% of AGI for various income ranges: 454.6% for AGIs $25k-50k, 836.3% for AGIs $50k-75k, 1210.0% for AGIs $75k-100k, 1886.2% for AGIs $100k-200k, 9513.3% for AGIs over 200k)
Charity contributions: $6,286 (reported on 18.7% of returns)
Here:
$6,286
State:
$9,065
(% of AGI for various income ranges: 47.9% for AGIs $25k-50k, 119.4% for AGIs $50k-75k, 151.0% for AGIs $75k-100k, 277.6% for AGIs $100k-200k, 2400.0% for AGIs over 200k)
Taxes paid: $8,200 (reported on 25.3% of returns)
20733:
$8,200
State:
$8,475
(% of AGI for various income ranges: 118.8% for AGIs $25k-50k, 286.2% for AGIs $50k-75k, 414.0% for AGIs $75k-100k, 628.6% for AGIs $100k-200k, 2130.0% for AGIs over 200k)
Earned income credit: $2,150 (reported on 6.7% of returns)
Here:
$2,150
State:
$2,151
(% of AGI for various income ranges: 52.0% for AGIs below $25k, 46.2% for AGIs $25k-50k)
Percentage of individuals using paid preparers for their 2020 taxes: 90.7%
Here:
91%
State:
90%
(% for various income ranges: 90.6% for AGIs below $25k, 93.5% for AGIs $25k-50k, 87.0% for AGIs $50k-75k, 93.8% for AGIs $75k-100k, 89.5% for AGIs $100k-200k, 90.0% for AGIs over 200k)
Averages for the 2012 tax year for zip code 20733, filed in 2013:
Average Adjusted Gross Income (AGI) in 2012: $75,990 (Individual Income Tax Returns)
Here:
$75,990
State:
$72,703
Salary/wage: $73,714 (reported on 84.9% of returns)
Here:
$73,714
State:
$62,228
(% of AGI for various income ranges: 70.6% for AGIs below $25k, 76.6% for AGIs $25k-50k, 78.8% for AGIs $50k-75k, 78.5% for AGIs $75k-100k, 86.3% for AGIs $100k-200k, 85.2% for AGIs over 200k)
Taxable interest for individuals: $567 (reported on 44.1% of returns)
This zip code:
$567
Maryland:
$1,413
(% of AGI for various income ranges: 1.1% for AGIs below $25k, 0.5% for AGIs $25k-50k, 0.3% for AGIs $50k-75k, 0.2% for AGIs $75k-100k, 0.4% for AGIs $100k-200k, 0.2% for AGIs over 200k)
Ordinary dividends: $2,500 (reported on 19.7% of returns)
Here:
$2,500
State:
$6,933
(% of AGI for various income ranges: 1.4% for AGIs below $25k, 0.7% for AGIs $25k-50k, 1.2% for AGIs $50k-75k, 0.6% for AGIs $75k-100k, 0.4% for AGIs $100k-200k, 0.5% for AGIs over 200k)
Net capital gain/loss in AGI: +$794 (reported on 11.8% of returns)
Here:
+$794
State:
+$14,830
(% of AGI for various income ranges: 0.5% for AGIs $100k-200k)
Profit/loss from business: +$7,700 (reported on 17.1% of returns)
Here:
+$7,700
State:
+$12,606
(% of AGI for various income ranges: 7.9% for AGIs below $25k, 4.2% for AGIs $25k-50k, 1.2% for AGIs $50k-75k, 1.8% for AGIs $75k-100k, 1.6% for AGIs $100k-200k)
Taxable individual retirement arrangement distribution: $11,250 (reported on 9.2% of returns)
20733:
$11,250
Maryland:
$17,065
(% of AGI for various income ranges: 2.4% for AGIs $25k-50k, 1.7% for AGIs $50k-75k, 2.0% for AGIs $75k-100k, 1.8% for AGIs $100k-200k)
Total itemized deductions: $26,179 (23% of AGI, reported on 55.3% of returns)
Here:
$26,179
State:
$27,886
Here:
23.1% of AGI
State:
22.8% of AGI
(% of AGI for various income ranges: 15.7% for AGIs below $25k, 15.7% for AGIs $25k-50k, 21.2% for AGIs $50k-75k, 22.6% for AGIs $75k-100k, 20.4% for AGIs $100k-200k, 15.8% for AGIs over 200k)
Charity contributions: $2,993 (reported on 46.1% of returns)
Here:
$2,993
State:
$4,452
(% of AGI for various income ranges: 0.5% for AGIs below $25k, 1.7% for AGIs $25k-50k, 1.9% for AGIs $50k-75k, 2.4% for AGIs $75k-100k, 2.0% for AGIs $100k-200k, 1.5% for AGIs over 200k)
Taxes paid: $10,396 (reported on 55.3% of returns)
20733:
$10,396
State:
$11,690
(% of AGI for various income ranges: 4.1% for AGIs below $25k, 4.0% for AGIs $25k-50k, 6.7% for AGIs $50k-75k, 8.0% for AGIs $75k-100k, 8.3% for AGIs $100k-200k, 8.8% for AGIs over 200k)
Earned income credit: $1,640 (reported on 9.9% of returns)
Here:
$1,640
State:
$2,199
(% of AGI for various income ranges: 3.8% for AGIs below $25k, 0.6% for AGIs $25k-50k)
Percentage of individuals using paid preparers for their 2012 taxes: 49.3%
Here:
49%
State:
52%
(% for various income ranges: 43.9% for AGIs below $25k, 46.9% for AGIs $25k-50k, 50.0% for AGIs $50k-75k, 57.9% for AGIs $75k-100k, 50.0% for AGIs $100k-200k, 66.7% for AGIs over 200k)
Averages for the 2004 tax year for zip code 20733, filed in 2005:
Average Adjusted Gross Income (AGI) in 2004: $57,804 (Individual Income Tax Returns)
Here:
$57,804
State:
$60,339
Salary/wage: $55,323 (reported on 86.9% of returns)
Here:
$55,323
State:
$52,211
(% of AGI for various income ranges: 170.1% for AGIs below $10k, 79.2% for AGIs $10k-25k, 81.1% for AGIs $25k-50k, 81.6% for AGIs $50k-75k, 90.5% for AGIs $75k-100k, 80.2% for AGIs over 100k)
Taxable interest for individuals: $668 (reported on 52.8% of returns)
This zip code:
$668
Maryland:
$1,701
(% of AGI for various income ranges: 3.3% for AGIs below $10k, 0.9% for AGIs $10k-25k, 0.8% for AGIs $25k-50k, 0.7% for AGIs $50k-75k, 0.3% for AGIs $75k-100k, 0.6% for AGIs over 100k)
Taxable dividends: $1,210 (reported on 22.0% of returns)
Here:
$1,210
State:
$4,235
(% of AGI for various income ranges: 2.2% for AGIs below $10k, 0.8% for AGIs $10k-25k, 0.8% for AGIs $25k-50k, 0.5% for AGIs $50k-75k, 0.2% for AGIs $75k-100k, 0.3% for AGIs over 100k)
Net capital gain/loss: +$3,456 (reported on 18.4% of returns)
Here:
+$3,456
State:
+$15,888
(% of AGI for various income ranges: -3.8% for AGIs below $10k, 0.1% for AGIs $10k-25k, 0.1% for AGIs $25k-50k, 0.4% for AGIs $50k-75k, 0.2% for AGIs $75k-100k, 2.4% for AGIs over 100k)
Profit/loss from business: +$10,543 (reported on 15.2% of returns)
Here:
+$10,543
State:
+$12,221
(% of AGI for various income ranges: 13.5% for AGIs below $10k, 4.6% for AGIs $10k-25k, 2.2% for AGIs $25k-50k, 2.3% for AGIs $50k-75k, 2.3% for AGIs $75k-100k, 3.0% for AGIs over 100k)
IRA payment deduction: $2,780 (reported on 2.8% of returns)
20733:
$2,780
Maryland:
$2,968
Self-employed pension: $10,750 (reported on 0.8% of returns)
Here:
$10,750
Maryland:
$17,155
Total itemized deductions: $21,496 (26% of AGI, reported on 59.1% of returns)
Here:
$21,496
State:
$22,960
Here:
26.3% of AGI
State:
23.3% of AGI
(% of AGI for various income ranges: 32.7% for AGIs below $10k, 19.5% for AGIs $10k-25k, 23.3% for AGIs $25k-50k, 23.5% for AGIs $50k-75k, 22.1% for AGIs $75k-100k, 20.8% for AGIs over 100k)
Charity contributions deductions: $2,594 (3% of AGI, reported on 53.2% of returns)
Here:
$2,594
State:
$4,031
Here:
3.1% of AGI
State:
3.9% of AGI
(% of AGI for various income ranges: 2.0% for AGIs below $10k, 1.9% for AGIs $10k-25k, 2.6% for AGIs $25k-50k, 2.5% for AGIs $50k-75k, 2.4% for AGIs $75k-100k, 2.4% for AGIs over 100k)
Total tax: $7,832 (reported on 82.5% of returns)
20733:
$7,832
State:
$10,167
(% of AGI for various income ranges: 5.6% for AGIs below $10k, 4.6% for AGIs $10k-25k, 7.0% for AGIs $25k-50k, 8.7% for AGIs $50k-75k, 9.9% for AGIs $75k-100k, 15.3% for AGIs over 100k)
Earned income credit: $1,543 (reported on 7.1% of returns)
Here:
$1,543
State:
$1,700
Percentage of individuals using paid preparers for their 2004 taxes: 50.0%
Here:
50%
State:
55%
(% for various income ranges: 40.3% for AGIs below $10k, 49.4% for AGIs $10k-25k, 48.1% for AGIs $25k-50k, 53.5% for AGIs $50k-75k, 54.5% for AGIs $75k-100k, 54.6% for AGIs over 100k)
Likely homosexual households (counted as self-reported same-sex unmarried-partner households)
Lesbian couples: 0.0% of all households
Gay men: 0.7% of all households
Household received Food Stamps/SNAP in the past 12 months: 18 Household did not receive Food Stamps/SNAP in the past 12 months: 964
Women who had a birth in the past 12 months: 28 (8 now married, 19 unmarried) Women who did not have a birth in the past 12 months: 505 (180 now married, 325 unmarried)
Housing units in zip code 20733 with a mortgage: 648 (153 second mortgage, 158 both second mortgage and home equity loan) Median monthly owner costs for units with a mortgage: $2,226 Median monthly owner costs for units without a mortgage: $574
Residents with income below the poverty level in 2022:
This zip code:
5.2%
Whole state:
9.6%
Residents with income below 50% of the poverty level in 2022:
This zip code:
0.7%
Whole state:
4.7%
Median number of rooms in houses and condos:
Here:
6.8
State:
7.3
Median number of rooms in apartments:
Here:
7.6
State:
4.2
Notable locations in this zip code not listed on our city pages
Size of family households: 311 2-persons, 222 3-persons, 112 4-persons, 109 5-persons, 15 6-persons
Size of nonfamily households: 168 1-person, 46 2-persons, 2 3-persons
310 married couples with children.
43 single-parent households (43 women).
98.2% of residents of 20733 zip code speak English at home.
0.5% of residents speak Spanish at home (100% very well).
0.4% of residents speak other Indo-European language at home (100% very well).
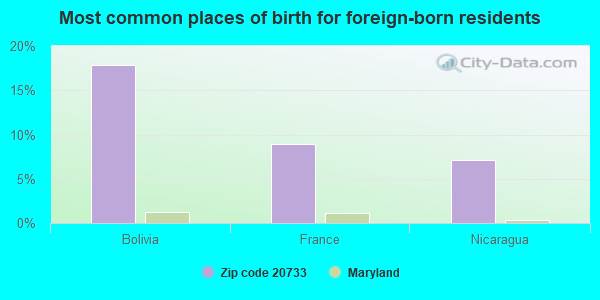
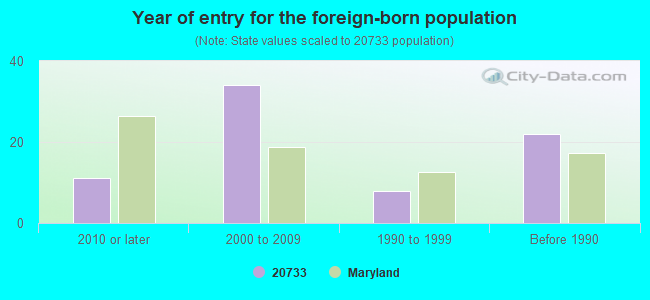
Foreign born population: 56 (2.1%) (92.5% of them are naturalized citizens)
This zip code:
2.1%
Whole state:
16.7%
18%Bolivia
9%France
7%Nicaragua
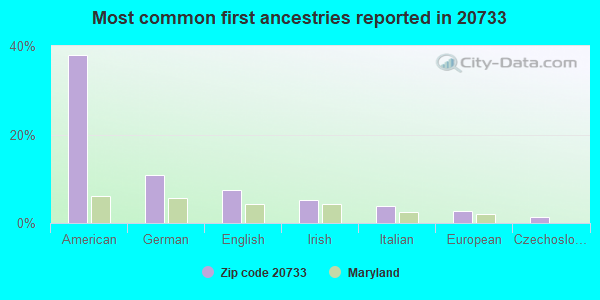
38%American
11%German
8%English
5%Irish
4%Italian
3%European
1%Czechoslovakian
Year of entry for the foreign-born population
112010 or later
342000 to 2009
81990 to 1999
22Before 1990
Facilities with environmental interests located in this zip code:
BROADWATER WATER RECLAMATION FACILITY (1161 DEEP COVE ROAD in GLEN BURNIE, MD)
AIR MINOR (AIRS/AFS) STATE MASTER (Maryland Permits tracking) - NPDES STORMWATER PERMIT, SEWAGE SLUDGE UTILIZATION National Pollutant Discharge Elimination System MAJOR (Tracking pollutant discharge elimination systems) - permit National Pollutant Discharge Elimination System NON-MAJOR (Tracking pollutant discharge elimination systems) - permit TRANSPORTER (Resource Conservation and Recovery Act (tracking hazardous waste)) - notification Business SIC classification: SEWERAGE SYSTEMS Organizations: OPERNAME (CONTACT/OPERATOR)
, ANNE ARUNDEL (CONTACT/OWNER)
, ANNE ARUNDEL COUNTY (CONTACT/OWNER)
Alternative names: ANNE ARUDEL CO., - DPW, ANNE ARUNDEL DEPT PUBLIC WORKS, BROADWATER TREATMENT PLANT, BROADWATER WASTEWATER TREATMENT PLANT, BROADWATER WWTP
MILLER'S, GARAGE (5570 SHADY SIDE ROAD in CHURCHTON, MD)
AIR MINOR (AIRS/AFS) Business SIC classification: GENERAL AUTOMOTIVE REPAIR SHOPS Alternative names: MILLER'S, FRANK GARAGE
BROADWATER ( in , MD)
CRITERIA AND HAZARDOUS AIR POLLUTANT INVENTORY (Inventory of air pollution sources)
71.3%Electricity
12.0%Fuel oil, kerosene, etc.
10.5%Utility gas
4.1%Wood
2.4%Bottled, tank, or LP gas
Population in 1990: 2,539. Population change in the 1990s: +271 (+10.7%).
Place of birth for U.S.-born residents:
This state: 1,582
Northeast: 228
Midwest: 210
South: 490
West: 57
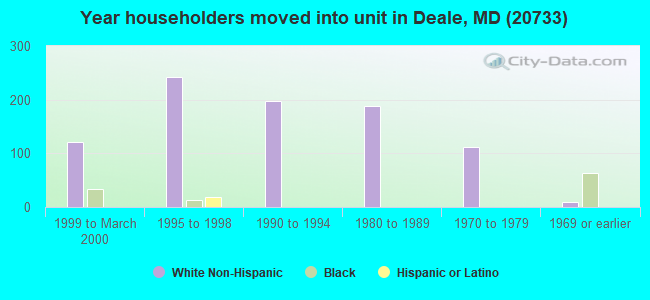
63% of the 20733 zip code residents lived in the same house 5 years ago. Out of people who lived in different houses, 49% lived in this county. Out of people who lived in different counties, 50% lived in Maryland.
94% of the 20733 zip code residents lived in the same house 1 year ago. Out of people who lived in different houses, 52% moved from this county. Out of people who lived in different houses, 24% moved from different county within same state. Out of people who lived in different houses, 8% moved from different state. Out of people who lived in different houses, 24% moved from abroad.
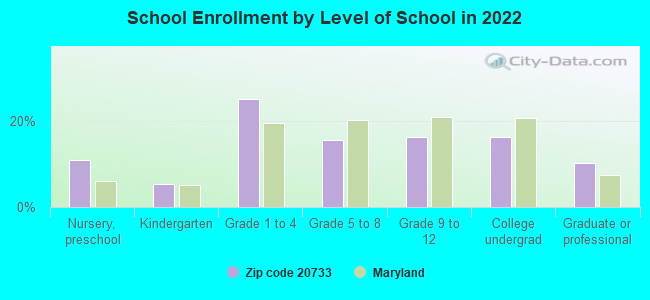
Private vs. public school enrollment:
Students in private schools in grades 1 to 8 (elementary and middle school):
Here:
0.0%
Maryland:
15.2%
Students in private schools in grades 9 to 12 (high school): 53
Here:
46.1%
Maryland:
14.4%
Students in private undergraduate colleges: 13
Here:
12.4%
Maryland:
20.2%
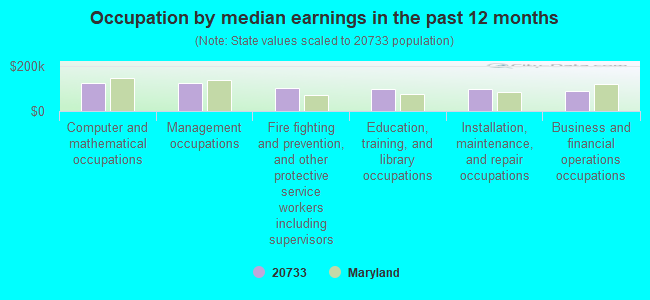
Occupation by median earnings in the past 12 months ($)
122,879Computer and mathematical occupations
122,054Management occupations
100,185Fire fighting and prevention, and other protective service workers including supervisors
98,935Education, training, and library occupations
96,159Installation, maintenance, and repair occupations
88,451Business and financial operations occupations
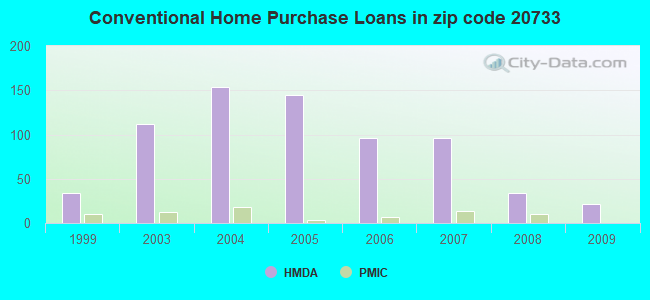
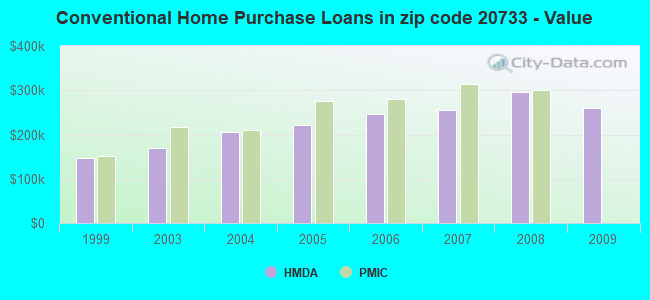
Top industries in this zip code by the number of employees in 2005:
Detailed PMIC statistics for the following Tracts:7070.02
2002 - 2018 National Fire Incident Reporting System (NFIRS) incidents
According to the data from the years 2002 - 2018 the average number of fire incidents per year is 6. The highest number of reported fires - 13 took place in 2003, and the least - 0 in 2016. The data has a constant trend.
When looking into fire subcategories, the most reports belonged to: Structure Fires (33.7%), and Outside Fires (25.7%).
Fire incident types reported to NFIRS in Zip Code 20733


 Nearest zip codes: 20751, 20765, 20764, 20778, 20779, 20776.


 According to the data from the years 2002 - 2018 the average number of fire incidents per year is 6. The highest number of reported fires - 13 took place in 2003, and the least - 0 in 2016. The data has a constant trend.
 When looking into fire subcategories, the most reports belonged to: Structure Fires (33.7%), and Outside Fires (25.7%).