Estimated zip code population in 2022: 3,629 Zip code population in 2010: 2,790 Zip code population in 2000: 2,632
Houses and condos: 1,603 Renter-occupied apartments: 214
% of renters here:
14%
State:
32%
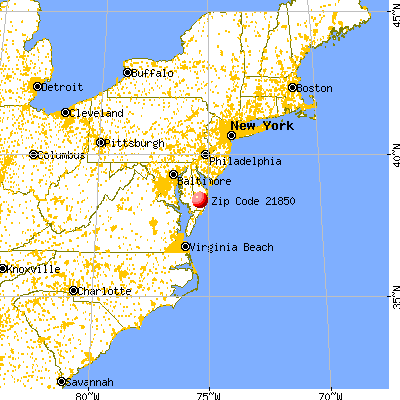
March 2022 cost of living index in zip code 21850: 91.6 (less than average, U.S. average is 100)
Land area: 31.1 sq. mi. Water area: 0.1 sq. mi.
Population density: 117 people per square mile
(very low).
OSM Map
General Map
Google Map
MSN Map
OSM Map
General Map
Google Map
MSN Map
OSM Map
General Map
Google Map
MSN Map
OSM Map
General Map
Google Map
MSN Map
Please wait while loading the map...
Real estate property taxes paid for housing units in 2022:
This zip code:
0.7% ($1,665)
Maryland:
0.9% ($3,777)
Median real estate property taxes paid for housing units with mortgages in 2022: $1,867 (0.8%) Median real estate property taxes paid for housing units with no mortgage in 2022: $1,246 (0.8%)
Business Search- 14 Million verified businesses
Males: 1,780
(49.1%)
Females: 1,849
(50.9%)
For population 25 years and over in 21850:
High school or higher: 86.5%
Bachelor's degree or higher: 11.5%
Graduate or professional degree: 2.7%
Unemployed: 2.8%
Mean travel time to work (commute): 24.4 minutes
For population 15 years and over in 21850:
Never married: 28.6%
Now married: 47.0%
Separated: 5.1%
Widowed: 5.9%
Divorced: 13.4%
Zip code 21850 compared to state average:
Median house value below state average.
Black race population percentage significantly below state average.
Hispanic race population percentage below state average.
Median age above state average.
Foreign-born population percentage significantly below state average.
Renting percentage significantly below state average.
Length of stay since moving in significantly above state average.
Number of college students significantly below state average.
Percentage of population with a bachelor's degree or higher significantly below state average.
Estimated median house/condo value in 2022: $225,259
21850:
$225,259
Maryland:
$398,100
According to our research of Maryland and other state lists, there were 3 registered sex offenders living in 21850 zip code as of June 16, 2024. The ratio of all residents to sex offenders in zip code 21850 is 902 to 1. The ratio of registered sex offenders to all residents in this zip code is near the state average.
Median resident age:
This zip code:
46.1 years
Maryland median age:
39.7 years
Average household size:
This zip code:
2.4 people
Maryland:
2.5 people
Averages for the 2020 tax year for zip code 21850, filed in 2021:
Average Adjusted Gross Income (AGI) in 2020: $51,098 (Individual Income Tax Returns)
Here:
$51,098
State:
$86,905
Salary/wage: $47,480 (reported on 84.7% of returns)
Here:
$47,480
State:
$73,953
(% of AGI for various income ranges: 1237.2% for AGIs below $25k, 3348.9% for AGIs $25k-50k, 6817.4% for AGIs $50k-75k, 9901.1% for AGIs $75k-100k, 17593.6% for AGIs $100k-200k)
Taxable interest for individuals: $393 (reported on 28.0% of returns)
This zip code:
$393
Maryland:
$1,528
(% of AGI for various income ranges: 7.2% for AGIs below $25k, 8.4% for AGIs $25k-50k, 16.8% for AGIs $50k-75k, 32.2% for AGIs $75k-100k, 46.4% for AGIs $100k-200k)
Ordinary dividends: $1,665 (reported on 10.8% of returns)
Here:
$1,665
State:
$8,028
(% of AGI for various income ranges: 7.2% for AGIs below $25k, 11.6% for AGIs $25k-50k, 5.3% for AGIs $50k-75k, 38.9% for AGIs $75k-100k, 150.0% for AGIs $100k-200k)
Net capital gain/loss in AGI: +$2,645 (reported on 7.0% of returns)
Here:
+$2,645
State:
+$25,238
(% of AGI for various income ranges: 6.6% for AGIs $25k-50k, 246.4% for AGIs $100k-200k)
Profit/loss from business: +$7,564 (reported on 14.0% of returns)
Here:
+$7,564
State:
+$11,398
(% of AGI for various income ranges: 154.2% for AGIs below $25k, 172.4% for AGIs $25k-50k, 171.1% for AGIs $50k-75k, 60.9% for AGIs $100k-200k)
Taxable individual retirement arrangement distribution: $11,730 (reported on 6.4% of returns)
21850:
$11,730
Maryland:
$20,944
(% of AGI for various income ranges: 32.8% for AGIs below $25k, 86.6% for AGIs $25k-50k, 186.7% for AGIs $75k-100k, 495.5% for AGIs $100k-200k)
Total itemized deductions: $25,418 (reported on 7.0% of returns)
Here:
$25,418
State:
$30,672
(% of AGI for various income ranges: 492.6% for AGIs $50k-75k, 603.3% for AGIs $75k-100k, 1197.3% for AGIs $100k-200k)
Charity contributions: $5,144 (reported on 5.7% of returns)
Here:
$5,144
State:
$9,065
(% of AGI for various income ranges: 120.5% for AGIs $50k-75k, 212.7% for AGIs $100k-200k)
Taxes paid: $7,718 (reported on 7.0% of returns)
21850:
$7,718
State:
$8,475
(% of AGI for various income ranges: 136.8% for AGIs $50k-75k, 180.0% for AGIs $75k-100k, 388.2% for AGIs $100k-200k)
Earned income credit: $2,027 (reported on 16.6% of returns)
Here:
$2,027
State:
$2,151
(% of AGI for various income ranges: 73.8% for AGIs below $25k, 61.1% for AGIs $25k-50k)
Percentage of individuals using paid preparers for their 2020 taxes: 93.0%
Here:
93%
State:
90%
(% for various income ranges: 90.6% for AGIs below $25k, 93.5% for AGIs $25k-50k, 96.0% for AGIs $50k-75k, 92.3% for AGIs $75k-100k, 94.4% for AGIs $100k-200k, 100.0% for AGIs over 200k)
Averages for the 2012 tax year for zip code 21850, filed in 2013:
Average Adjusted Gross Income (AGI) in 2012: $39,786 (Individual Income Tax Returns)
Here:
$39,786
State:
$72,703
Salary/wage: $36,449 (reported on 87.1% of returns)
Here:
$36,449
State:
$62,228
(% of AGI for various income ranges: 74.6% for AGIs below $25k, 82.0% for AGIs $25k-50k, 82.8% for AGIs $50k-75k, 81.2% for AGIs $75k-100k, 75.0% for AGIs $100k-200k)
Taxable interest for individuals: $520 (reported on 32.4% of returns)
This zip code:
$520
Maryland:
$1,413
(% of AGI for various income ranges: 0.7% for AGIs below $25k, 0.5% for AGIs $25k-50k, 0.1% for AGIs $50k-75k, 0.2% for AGIs $75k-100k, 0.6% for AGIs $100k-200k)
Ordinary dividends: $885 (reported on 9.4% of returns)
Here:
$885
State:
$6,933
(% of AGI for various income ranges: 0.3% for AGIs below $25k, 0.2% for AGIs $25k-50k, 0.2% for AGIs $75k-100k, 0.4% for AGIs $100k-200k)
Net capital gain/loss in AGI: +$571 (reported on 5.0% of returns)
Here:
+$571
State:
+$14,830
Profit/loss from business: +$7,875 (reported on 14.4% of returns)
Here:
+$7,875
State:
+$12,606
(% of AGI for various income ranges: 8.1% for AGIs below $25k, 3.5% for AGIs $25k-50k, 0.7% for AGIs $50k-75k, 3.4% for AGIs $75k-100k)
Taxable individual retirement arrangement distribution: $7,831 (reported on 9.4% of returns)
21850:
$7,831
Maryland:
$17,065
(% of AGI for various income ranges: 2.2% for AGIs below $25k, 1.0% for AGIs $25k-50k, 1.8% for AGIs $50k-75k, 4.3% for AGIs $75k-100k)
Total itemized deductions: $17,023 (25% of AGI, reported on 31.7% of returns)
Here:
$17,023
State:
$27,886
Here:
25.3% of AGI
State:
22.8% of AGI
(% of AGI for various income ranges: 7.9% for AGIs below $25k, 11.2% for AGIs $25k-50k, 14.4% for AGIs $50k-75k, 15.7% for AGIs $75k-100k, 17.6% for AGIs $100k-200k)
Charity contributions: $2,397 (reported on 24.5% of returns)
Here:
$2,397
State:
$4,452
(% of AGI for various income ranges: 0.8% for AGIs below $25k, 0.9% for AGIs $25k-50k, 1.3% for AGIs $50k-75k, 2.0% for AGIs $75k-100k, 2.5% for AGIs $100k-200k)
Taxes paid: $5,873 (reported on 31.7% of returns)
21850:
$5,873
State:
$11,690
(% of AGI for various income ranges: 1.4% for AGIs below $25k, 3.1% for AGIs $25k-50k, 4.8% for AGIs $50k-75k, 5.9% for AGIs $75k-100k, 7.9% for AGIs $100k-200k)
Earned income credit: $2,170 (reported on 21.6% of returns)
Here:
$2,170
State:
$2,199
(% of AGI for various income ranges: 6.6% for AGIs below $25k, 1.1% for AGIs $25k-50k)
Percentage of individuals using paid preparers for their 2012 taxes: 50.4%
Here:
50%
State:
52%
(% for various income ranges: 45.0% for AGIs below $25k, 47.4% for AGIs $25k-50k, 57.1% for AGIs $50k-75k, 69.2% for AGIs $75k-100k, 57.1% for AGIs $100k-200k)
Averages for the 2004 tax year for zip code 21850, filed in 2005:
Average Adjusted Gross Income (AGI) in 2004: $34,950 (Individual Income Tax Returns)
Here:
$34,950
State:
$60,339
Salary/wage: $32,537 (reported on 88.2% of returns)
Here:
$32,537
State:
$52,211
(% of AGI for various income ranges: 124.6% for AGIs below $10k, 80.5% for AGIs $10k-25k, 84.8% for AGIs $25k-50k, 84.4% for AGIs $50k-75k, 83.8% for AGIs $75k-100k, 67.6% for AGIs over 100k)
Taxable interest for individuals: $667 (reported on 41.0% of returns)
This zip code:
$667
Maryland:
$1,701
(% of AGI for various income ranges: 4.9% for AGIs below $10k, 1.4% for AGIs $10k-25k, 0.7% for AGIs $25k-50k, 0.3% for AGIs $50k-75k, 0.3% for AGIs $75k-100k, 1.2% for AGIs over 100k)
Taxable dividends: $740 (reported on 14.0% of returns)
Here:
$740
State:
$4,235
(% of AGI for various income ranges: 3.5% for AGIs below $10k, 0.3% for AGIs $10k-25k, 0.2% for AGIs $25k-50k, 0.1% for AGIs $50k-75k, 0.3% for AGIs $75k-100k, 0.3% for AGIs over 100k)
Net capital gain/loss: +$13,000 (reported on 9.5% of returns)
Here:
+$13,000
State:
+$15,888
(% of AGI for various income ranges: 0.5% for AGIs $10k-25k, 1.0% for AGIs $25k-50k, 0.5% for AGIs $50k-75k, 3.1% for AGIs $75k-100k, 17.7% for AGIs over 100k)
Profit/loss from business: +$4,710 (reported on 17.0% of returns)
Here:
+$4,710
State:
+$12,221
(% of AGI for various income ranges: 9.5% for AGIs below $10k, 7.6% for AGIs $10k-25k, 3.6% for AGIs $25k-50k, -0.3% for AGIs $50k-75k, -0.1% for AGIs $75k-100k)
Profit/loss from farming: +$4,545 (reported on 3.6% of returns)
Here:
+$4,545
State:
-$4,771
IRA payment deduction: $2,759 (reported on 2.4% of returns)
21850:
$2,759
Maryland:
$2,968
Total itemized deductions: $14,005 (24% of AGI, reported on 32.0% of returns)
Here:
$14,005
State:
$22,960
Here:
23.9% of AGI
State:
23.3% of AGI
(% of AGI for various income ranges: 7.7% for AGIs $10k-25k, 13.5% for AGIs $25k-50k, 14.5% for AGIs $50k-75k, 14.1% for AGIs $75k-100k, 13.7% for AGIs over 100k)
Charity contributions deductions: $1,787 (3% of AGI, reported on 26.6% of returns)
Here:
$1,787
State:
$4,031
Here:
2.9% of AGI
State:
3.9% of AGI
(% of AGI for various income ranges: 0.7% for AGIs $10k-25k, 1.2% for AGIs $25k-50k, 1.4% for AGIs $50k-75k, 1.6% for AGIs $75k-100k, 2.2% for AGIs over 100k)
Total tax: $3,915 (reported on 76.8% of returns)
21850:
$3,915
State:
$10,167
(% of AGI for various income ranges: 4.7% for AGIs below $10k, 4.8% for AGIs $10k-25k, 6.7% for AGIs $25k-50k, 8.3% for AGIs $50k-75k, 10.7% for AGIs $75k-100k, 15.4% for AGIs over 100k)
Earned income credit: $1,822 (reported on 16.9% of returns)
Here:
$1,822
State:
$1,700
Percentage of individuals using paid preparers for their 2004 taxes: 60.6%
Here:
61%
State:
55%
(% for various income ranges: 47.7% for AGIs below $10k, 58.4% for AGIs $10k-25k, 65.1% for AGIs $25k-50k, 64.8% for AGIs $50k-75k, 62.3% for AGIs $75k-100k, 84.1% for AGIs over 100k)
Household received Food Stamps/SNAP in the past 12 months: 230 Household did not receive Food Stamps/SNAP in the past 12 months: 1,315
Women who had a birth in the past 12 months: 78 (10 now married, 66 unmarried) Women who did not have a birth in the past 12 months: 696 (322 now married, 373 unmarried)
Housing units in zip code 21850 with a mortgage: 963 (58 second mortgage, 46 both second mortgage and home equity loan) Houses without a mortgage: 31
Median monthly owner costs for units with a mortgage: $1,373 Median monthly owner costs for units without a mortgage: $645
Residents with income below the poverty level in 2022:
This zip code:
10.8%
Whole state:
9.6%
Residents with income below 50% of the poverty level in 2022:
This zip code:
7.5%
Whole state:
4.7%
Median number of rooms in houses and condos:
Here:
5.9
State:
7.3
Median number of rooms in apartments:
Here:
4.6
State:
4.2
Notable locations in this zip code not listed on our city pages
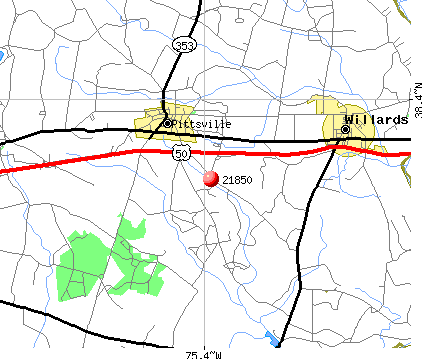
Notable locations in zip code 21850: Powellville Fire Department (A), Pittsville Volunteer Fire Department (B), Pittsville Town Hall (C). Display/hide their locations on the map
Churches in zip code 21850 include: Church of God of Prophecy (A), Gathering Tree Church (B), Ayres United Methodist Church (C), Eden United Methodist Church (D), Powellville United Methodist Church (E), World Outreach Tabernacle (F). Display/hide their locations on the map
Size of family households: 451 2-persons, 251 3-persons, 161 4-persons, 104 5-persons, 30 7-or-more-persons
Size of nonfamily households: 468 1-person, 73 2-persons, 3 3-persons
330 married couples with children.
243 single-parent households (53 men, 190 women).
93.3% of residents of 21850 zip code speak English at home.
5.9% of residents speak Spanish at home (98% very well, 2% well).
0.7% of residents speak Asian or Pacific Island language at home (32% very well, 68% well).
Foreign born population: 165 (4.6%) (65.9% of them are naturalized citizens)
This zip code:
4.6%
Whole state:
16.7%
15%Japan
4%France
2%Chile
1%Denmark
1%Costa Rica
1%Belize
30%English
9%American
7%Irish
6%South African
5%European
4%German
2%Polish
Year of entry for the foreign-born population
52010 or later
942000 to 2009
611990 to 1999
17Before 1990
Facilities with environmental interests located in this zip code:
MORRIS ROAD PIT (5900 MORRIS ROAD in PITTSVILLE, MD)
STATE MASTER (Maryland Permits tracking) - National Pollutant Discharge Elimination System Permit National Pollutant Discharge Elimination System NON-MAJOR (Tracking pollutant discharge elimination systems) - permit Business SIC classification: CONSTRUCTION SAND AND GRAVEL; READY-MIXED CONCRETE Alternative names: BUNTING AND MURRAY CONSTRUCTION, BUNTING $ MURRAY CONSTRUCTION
PITTSVILLE WWTP (34751 POPLAR NECK ROAD in PITTSVILLE, MD)
STATE MASTER (Maryland Permits tracking) - NPDES NON-MAJOR National Pollutant Discharge Elimination System NON-MAJOR (Tracking pollutant discharge elimination systems) - permit Business SIC classification: SEWERAGE SYSTEMS Alternative names: PITTSVILLE TOWN OF
EXXON 7126 FRIENDSHIP ROAD (7126 FRIENDSHIP ROAD in PITTSVILLE, MD)
AIR MINOR (AIRS/AFS) STATE MASTER (Maryland Air Emissions Database) - AIR MINOR Business SIC classification: GASOLINE SERVICE STATIONS
PITTSVILLE SCHOOL (34400 OLD OCEAN CITY ROAD in PITTSVILLE, MD)
AIR MINOR (AIRS/AFS) Business SIC classification: ELEMENTARY AND SECONDARY SCHOOLS
PITTSVILLE MOTORS INC (34690 OLD OCEAN CITY RD in PITTSVILLE, MD)
Small Quantity Generators, between 100 kg and 1000 kg of hazardous waste/month (Resource Conservation and Recovery Act (tracking hazardous waste)) - notification Organizations: BOUNDS DONALD (CONTACT/OWNER)
Housing units lacking complete plumbing facilities: 0.8% Housing units lacking complete kitchen facilities: 0.4%
60.7%Electricity
18.5%Bottled, tank, or LP gas
15.6%Fuel oil, kerosene, etc.
1.7%Solar energy
1.1%Utility gas
1.1%Other fuel
1.0%Wood
0.5%No fuel used
Population in 1990: 1,997. Population change in the 1990s: +635 (+31.8%).
Place of birth for U.S.-born residents:
This state: 2,557
Northeast: 456
Midwest: 20
South: 343
West: 37
60% of the 21850 zip code residents lived in the same house 5 years ago. Out of people who lived in different houses, 53% lived in this county. Out of people who lived in different counties, 50% lived in Maryland.
93% of the 21850 zip code residents lived in the same house 1 year ago. Out of people who lived in different houses, 63% moved from this county. Out of people who lived in different houses, 24% moved from different county within same state. Out of people who lived in different houses, 8% moved from different state. Out of people who lived in different houses, 7% moved from abroad.
Private vs. public school enrollment:
Students in private schools in grades 1 to 8 (elementary and middle school): 26
Here:
12.8%
Maryland:
15.2%
Students in private schools in grades 9 to 12 (high school): 10
Here:
5.8%
Maryland:
14.4%
Students in private undergraduate colleges: 7
Here:
17.7%
Maryland:
20.2%
Occupation by median earnings in the past 12 months ($)
68,144Building and grounds cleaning and maintenance occupations
54,743Health diagnosing and treating practitioners and other technical occupations
53,763Management occupations
51,225Office and administrative support occupations
46,225Installation, maintenance, and repair occupations
46,049Education, training, and library occupations
Top industries in this zip code by the number of employees in 2005:
Detailed PMIC statistics for the following Tracts:0106.02
, 0106.04
2002 - 2018 National Fire Incident Reporting System (NFIRS) incidents
According to the data from the years 2002 - 2018 the average number of fire incidents per year is 29. The highest number of fire incidents - 45 took place in 2010, and the least - 5 in 2009. The data has a dropping trend.
When looking into fire subcategories, the most incidents belonged to: Outside Fires (42.4%), and Structure Fires (41.6%).
Fire incident types reported to NFIRS in Zip Code 21850


+$4,545
-$4,771
 Nearest zip codes: 21874, 21849, 21872, 21804, 21841, 21875.


 According to the data from the years 2002 - 2018 the average number of fire incidents per year is 29. The highest number of fire incidents - 45 took place in 2010, and the least - 5 in 2009. The data has a dropping trend.
 When looking into fire subcategories, the most incidents belonged to: Outside Fires (42.4%), and Structure Fires (41.6%).