Estimated zip code population in 2022: 15,805 Zip code population in 2010: 14,879 Zip code population in 2000: 14,527
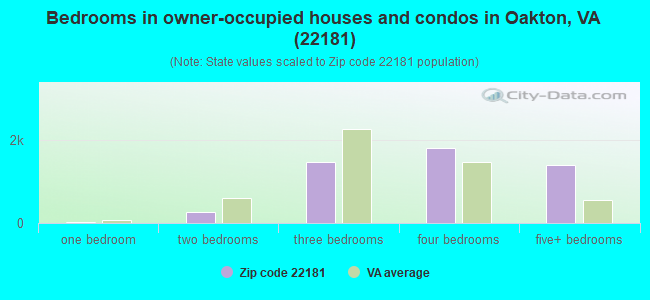
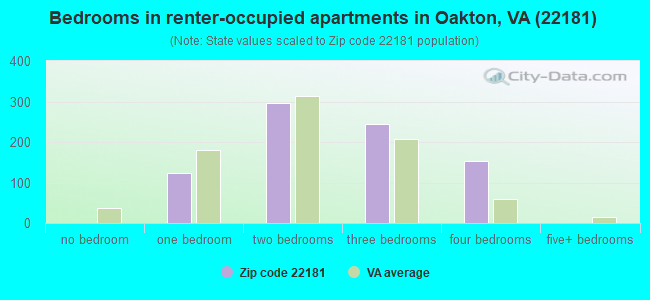
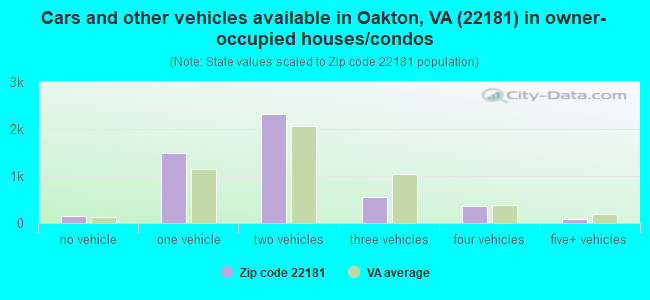
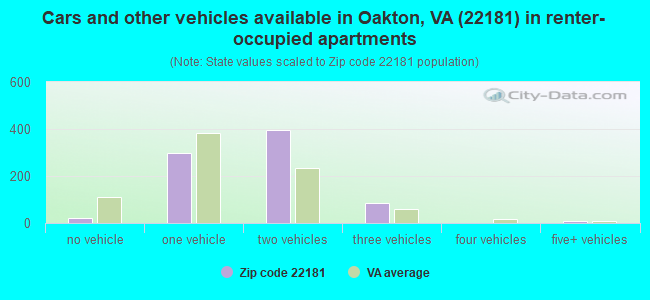
Houses and condos: 5,799 Renter-occupied apartments: 823
% of renters here:
14%
State:
33%
March 2022 cost of living index in zip code 22181: 167.2 (very high, U.S. average is 100)
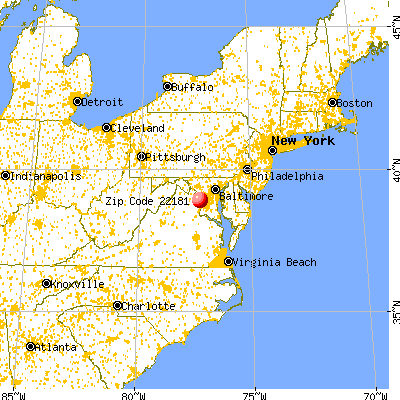
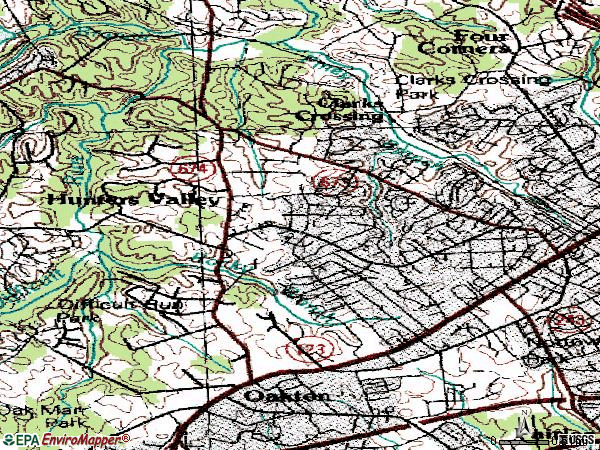
Land area: 5.7 sq. mi. Water area: 0.0 sq. mi.
Population density: 2,776 people per square mile
(average).
OSM Map
General Map
Google Map
MSN Map
OSM Map
General Map
Google Map
MSN Map
OSM Map
General Map
Google Map
MSN Map
OSM Map
General Map
Google Map
MSN Map
Please wait while loading the map...
Real estate property taxes paid for housing units in 2022:
This zip code:
1.0% ($9,199)
Virginia:
0.7% ($2,617)
Median real estate property taxes paid for housing units with mortgages in 2022: $9,391 (1.0%) Median real estate property taxes paid for housing units with no mortgage in 2022: $8,832 (1.0%)
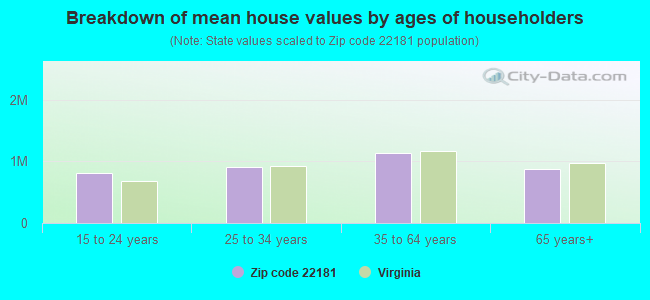
Estimated median house/condo value in 2022: $948,043
22181:
$948,043
Virginia:
$365,700
According to our research of Virginia and other state lists, there were 5 registered sex offenders living in 22181 zip code as of June 16, 2024. The ratio of all residents to sex offenders in zip code 22181 is 3,162 to 1. The ratio of registered sex offenders to all residents in this zip code is much lower than the state average.
Median resident age:
This zip code:
42.6 years
Virginia median age:
39.0 years
Average household size:
This zip code:
2.8 people
Virginia:
2.5 people
Averages for the 2020 tax year for zip code 22181, filed in 2021:
Average Adjusted Gross Income (AGI) in 2020: $209,647 (Individual Income Tax Returns)
Here:
$209,647
State:
$86,446
Salary/wage: $151,859 (reported on 81.0% of returns)
Here:
$151,859
State:
$71,185
(% of AGI for various income ranges: 1215.8% for AGIs below $25k, 4002.0% for AGIs $25k-50k, 6775.4% for AGIs $50k-75k, 9405.1% for AGIs $75k-100k, 17841.5% for AGIs $100k-200k, 87821.4% for AGIs over 200k)
Taxable interest for individuals: $3,113 (reported on 58.1% of returns)
This zip code:
$3,113
Virginia:
$1,805
(% of AGI for various income ranges: 25.8% for AGIs below $25k, 42.9% for AGIs $25k-50k, 62.7% for AGIs $50k-75k, 145.1% for AGIs $75k-100k, 260.1% for AGIs $100k-200k, 1314.8% for AGIs over 200k)
Ordinary dividends: $13,386 (reported on 50.1% of returns)
Here:
$13,386
State:
$8,327
(% of AGI for various income ranges: 78.4% for AGIs below $25k, 103.1% for AGIs $25k-50k, 176.8% for AGIs $50k-75k, 382.3% for AGIs $75k-100k, 898.0% for AGIs $100k-200k, 5136.2% for AGIs over 200k)
Net capital gain/loss in AGI: +$40,094 (reported on 45.5% of returns)
Here:
+$40,094
State:
+$24,644
(% of AGI for various income ranges: 62.3% for AGIs below $25k, 92.2% for AGIs $25k-50k, 197.3% for AGIs $50k-75k, 329.1% for AGIs $75k-100k, 844.8% for AGIs $100k-200k, 16936.7% for AGIs over 200k)
Profit/loss from business: +$33,085 (reported on 20.0% of returns)
Here:
+$33,085
State:
+$12,836
(% of AGI for various income ranges: 175.1% for AGIs below $25k, 208.2% for AGIs $25k-50k, 223.9% for AGIs $50k-75k, 606.0% for AGIs $75k-100k, 912.9% for AGIs $100k-200k, 4704.1% for AGIs over 200k)
Taxable individual retirement arrangement distribution: $36,362 (reported on 11.4% of returns)
22181:
$36,362
Virginia:
$21,535
(% of AGI for various income ranges: 34.2% for AGIs below $25k, 112.4% for AGIs $25k-50k, 220.2% for AGIs $50k-75k, 546.3% for AGIs $75k-100k, 937.9% for AGIs $100k-200k, 2446.8% for AGIs over 200k)
Self-employed (Keogh) retirement plans: $38,720 (reported on 3.6% of returns)
22181:
$38,720
Virginia:
$31,172
(% of AGI for various income ranges: 92.5% for AGIs $100k-200k, 1280.9% for AGIs over 200k)
Total itemized deductions: $38,743 (reported on 34.0% of returns)
Here:
$38,743
State:
$33,287
(% of AGI for various income ranges: 125.3% for AGIs below $25k, 316.7% for AGIs $25k-50k, 704.9% for AGIs $50k-75k, 1439.4% for AGIs $75k-100k, 2325.5% for AGIs $100k-200k, 8762.9% for AGIs over 200k)
Charity contributions: $11,276 (reported on 29.0% of returns)
Here:
$11,276
State:
$10,381
(% of AGI for various income ranges: 9.9% for AGIs below $25k, 48.2% for AGIs $25k-50k, 68.3% for AGIs $50k-75k, 208.0% for AGIs $75k-100k, 381.0% for AGIs $100k-200k, 2621.4% for AGIs over 200k)
Taxes paid: $9,655 (reported on 34.0% of returns)
22181:
$9,655
State:
$8,284
(% of AGI for various income ranges: 29.3% for AGIs below $25k, 83.1% for AGIs $25k-50k, 216.3% for AGIs $50k-75k, 414.3% for AGIs $75k-100k, 732.3% for AGIs $100k-200k, 1929.3% for AGIs over 200k)
Earned income credit: $1,617 (reported on 4.1% of returns)
Here:
$1,617
State:
$2,214
(% of AGI for various income ranges: 36.4% for AGIs below $25k, 32.7% for AGIs $25k-50k)
Percentage of individuals using paid preparers for their 2020 taxes: 90.0%
Here:
90%
State:
92%
(% for various income ranges: 87.5% for AGIs below $25k, 89.0% for AGIs $25k-50k, 88.1% for AGIs $50k-75k, 92.7% for AGIs $75k-100k, 89.0% for AGIs $100k-200k, 92.5% for AGIs over 200k)
Averages for the 2012 tax year for zip code 22181, filed in 2013:
Average Adjusted Gross Income (AGI) in 2012: $160,180 (Individual Income Tax Returns)
Here:
$160,180
State:
$71,192
Salary/wage: $118,628 (reported on 83.9% of returns)
Here:
$118,628
State:
$59,229
(% of AGI for various income ranges: 77.4% for AGIs below $25k, 82.2% for AGIs $25k-50k, 73.7% for AGIs $50k-75k, 73.0% for AGIs $75k-100k, 73.3% for AGIs $100k-200k, 55.4% for AGIs over 200k)
Taxable interest for individuals: $2,730 (reported on 61.6% of returns)
This zip code:
$2,730
Virginia:
$1,600
(% of AGI for various income ranges: 1.3% for AGIs below $25k, 0.8% for AGIs $25k-50k, 1.0% for AGIs $50k-75k, 1.0% for AGIs $75k-100k, 0.9% for AGIs $100k-200k, 1.1% for AGIs over 200k)
Ordinary dividends: $10,849 (reported on 48.0% of returns)
Here:
$10,849
State:
$6,959
(% of AGI for various income ranges: 3.0% for AGIs below $25k, 2.3% for AGIs $25k-50k, 2.4% for AGIs $50k-75k, 2.4% for AGIs $75k-100k, 2.6% for AGIs $100k-200k, 3.6% for AGIs over 200k)
Net capital gain/loss in AGI: +$23,439 (reported on 40.8% of returns)
Here:
+$23,439
State:
+$16,672
(% of AGI for various income ranges: 1.5% for AGIs below $25k, 0.7% for AGIs $25k-50k, 0.2% for AGIs $50k-75k, 0.3% for AGIs $75k-100k, 1.4% for AGIs $100k-200k, 8.7% for AGIs over 200k)
Profit/loss from business: +$32,439 (reported on 18.5% of returns)
Here:
+$32,439
State:
+$14,116
(% of AGI for various income ranges: 15.5% for AGIs below $25k, 5.9% for AGIs $25k-50k, 3.8% for AGIs $50k-75k, 1.8% for AGIs $75k-100k, 3.7% for AGIs $100k-200k, 3.6% for AGIs over 200k)
Taxable individual retirement arrangement distribution: $27,478 (reported on 13.5% of returns)
22181:
$27,478
Virginia:
$16,667
(% of AGI for various income ranges: 1.9% for AGIs below $25k, 2.1% for AGIs $25k-50k, 3.1% for AGIs $50k-75k, 3.8% for AGIs $75k-100k, 2.9% for AGIs $100k-200k, 2.0% for AGIs over 200k)
Self-employment retirement plans: $28,950 (reported on 4.0% of returns)
22181:
$28,950
Virginia:
$25,373
(% of AGI for various income ranges: 0.9% for AGIs $25k-50k, 0.4% for AGIs $100k-200k, 1.0% for AGIs over 200k)
Total itemized deductions: $39,750 (17% of AGI, reported on 61.8% of returns)
Here:
$39,750
State:
$26,596
Here:
16.8% of AGI
State:
20.1% of AGI
(% of AGI for various income ranges: 17.0% for AGIs below $25k, 15.5% for AGIs $25k-50k, 18.3% for AGIs $50k-75k, 18.8% for AGIs $75k-100k, 19.0% for AGIs $100k-200k, 13.5% for AGIs over 200k)
Charity contributions: $5,908 (reported on 54.2% of returns)
Here:
$5,908
State:
$4,443
(% of AGI for various income ranges: 0.8% for AGIs below $25k, 0.9% for AGIs $25k-50k, 1.5% for AGIs $50k-75k, 2.0% for AGIs $75k-100k, 2.2% for AGIs $100k-200k, 2.0% for AGIs over 200k)
Taxes paid: $19,054 (reported on 61.6% of returns)
22181:
$19,054
State:
$9,951
(% of AGI for various income ranges: 3.6% for AGIs below $25k, 3.7% for AGIs $25k-50k, 5.9% for AGIs $50k-75k, 7.2% for AGIs $75k-100k, 8.4% for AGIs $100k-200k, 7.3% for AGIs over 200k)
Earned income credit: $1,697 (reported on 4.7% of returns)
Here:
$1,697
State:
$2,211
(% of AGI for various income ranges: 2.9% for AGIs below $25k, 0.4% for AGIs $25k-50k)
Percentage of individuals using paid preparers for their 2012 taxes: 45.3%
Here:
45%
State:
46%
(% for various income ranges: 41.9% for AGIs below $25k, 44.7% for AGIs $25k-50k, 44.1% for AGIs $50k-75k, 43.3% for AGIs $75k-100k, 40.9% for AGIs $100k-200k, 55.2% for AGIs over 200k)
Averages for the 2004 tax year for zip code 22181, filed in 2005:
Average Adjusted Gross Income (AGI) in 2004: $126,783 (Individual Income Tax Returns)
Here:
$126,783
State:
$56,704
Salary/wage: $100,811 (reported on 84.2% of returns)
Here:
$100,811
State:
$48,441
(% of AGI for various income ranges: 212.0% for AGIs below $10k, 78.0% for AGIs $10k-25k, 82.4% for AGIs $25k-50k, 71.9% for AGIs $50k-75k, 75.7% for AGIs $75k-100k, 64.6% for AGIs over 100k)
Taxable interest for individuals: $2,957 (reported on 69.7% of returns)
This zip code:
$2,957
Virginia:
$1,688
(% of AGI for various income ranges: 16.7% for AGIs below $10k, 2.1% for AGIs $10k-25k, 2.1% for AGIs $25k-50k, 2.1% for AGIs $50k-75k, 1.6% for AGIs $75k-100k, 1.5% for AGIs over 100k)
Taxable dividends: $5,696 (reported on 52.7% of returns)
Here:
$5,696
State:
$4,028
(% of AGI for various income ranges: 20.5% for AGIs below $10k, 2.6% for AGIs $10k-25k, 2.1% for AGIs $25k-50k, 2.3% for AGIs $50k-75k, 2.1% for AGIs $75k-100k, 2.4% for AGIs over 100k)
Net capital gain/loss: +$24,902 (reported on 45.7% of returns)
Here:
+$24,902
State:
+$14,375
(% of AGI for various income ranges: -6.2% for AGIs below $10k, 0.8% for AGIs $10k-25k, 0.4% for AGIs $25k-50k, 0.9% for AGIs $50k-75k, 1.1% for AGIs $75k-100k, 10.8% for AGIs over 100k)
Profit/loss from business: +$26,750 (reported on 17.6% of returns)
Here:
+$26,750
State:
+$13,342
(% of AGI for various income ranges: 3.1% for AGIs below $10k, 8.9% for AGIs $10k-25k, 3.8% for AGIs $25k-50k, 3.2% for AGIs $50k-75k, 2.7% for AGIs $75k-100k, 3.7% for AGIs over 100k)
IRA payment deduction: $3,448 (reported on 3.9% of returns)
22181:
$3,448
Virginia:
$2,943
(% of AGI for various income ranges: 0.6% for AGIs $10k-25k, 0.4% for AGIs $25k-50k, 0.1% for AGIs $50k-75k, 0.3% for AGIs $75k-100k, 0.1% for AGIs over 100k)
Self-employed pension: $20,634 (reported on 4.0% of returns)
Here:
$20,634
Virginia:
$17,430
(% of AGI for various income ranges: 0.3% for AGIs $50k-75k, 0.2% for AGIs $75k-100k, 0.7% for AGIs over 100k)
Total itemized deductions: $32,054 (17% of AGI, reported on 62.6% of returns)
Here:
$32,054
State:
$21,492
Here:
17.1% of AGI
State:
21.0% of AGI
(% of AGI for various income ranges: 33.5% for AGIs below $10k, 21.3% for AGIs $10k-25k, 19.6% for AGIs $25k-50k, 21.9% for AGIs $50k-75k, 22.3% for AGIs $75k-100k, 14.5% for AGIs over 100k)
Charity contributions deductions: $5,352 (3% of AGI, reported on 56.8% of returns)
Here:
$5,352
State:
$3,794
Here:
2.7% of AGI
State:
3.5% of AGI
(% of AGI for various income ranges: 1.4% for AGIs below $10k, 1.5% for AGIs $10k-25k, 1.7% for AGIs $25k-50k, 2.4% for AGIs $50k-75k, 2.5% for AGIs $75k-100k, 2.4% for AGIs over 100k)
Total tax: $27,422 (reported on 86.5% of returns)
22181:
$27,422
State:
$9,537
(% of AGI for various income ranges: 8.4% for AGIs below $10k, 5.3% for AGIs $10k-25k, 8.2% for AGIs $25k-50k, 10.1% for AGIs $50k-75k, 11.0% for AGIs $75k-100k, 20.7% for AGIs over 100k)
Earned income credit: $1,368 (reported on 3.5% of returns)
Here:
$1,368
State:
$1,734
Percentage of individuals using paid preparers for their 2004 taxes: 45.5%
Here:
46%
State:
52%
(% for various income ranges: 39.2% for AGIs below $10k, 52.2% for AGIs $10k-25k, 45.3% for AGIs $25k-50k, 43.4% for AGIs $50k-75k, 44.0% for AGIs $75k-100k, 47.6% for AGIs over 100k)
Household received Food Stamps/SNAP in the past 12 months: 0 Household did not receive Food Stamps/SNAP in the past 12 months: 5,648
Women who had a birth in the past 12 months: 147 (123 now married, 26 unmarried) Women who did not have a birth in the past 12 months: 3,085 (1,733 now married, 1,336 unmarried)
Housing units in zip code 22181 with a mortgage: 3,527 (388 second mortgage, 340 both second mortgage and home equity loan) Houses without a mortgage: 64
Median monthly owner costs for units with a mortgage: $3,457 Median monthly owner costs for units without a mortgage: $1,032
Residents with income below the poverty level in 2022:
This zip code:
3.5%
Whole state:
10.6%
Residents with income below 50% of the poverty level in 2022:
This zip code:
1.6%
Whole state:
5.2%
Median number of rooms in houses and condos:
Here:
10.0
State:
7.0
Median number of rooms in apartments:
Here:
4.7
State:
4.3
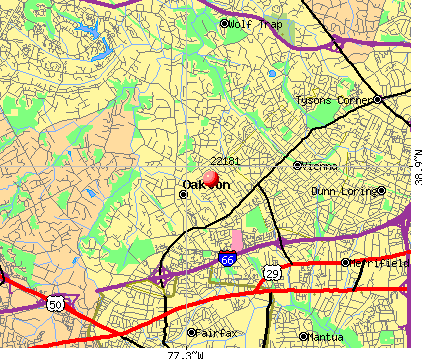
Notable locations in this zip code not listed on our city pages
Churches in zip code 22181 include: Emanuel Church (A), Church of the Good Shepherd (B), Emmanuel Lutheran Church (C), Oakton Church of Brethren (D), Saints Marks Catholic Church (E). Display/hide their locations on the map
3,172 married couples with children.
369 single-parent households (201 men, 168 women).
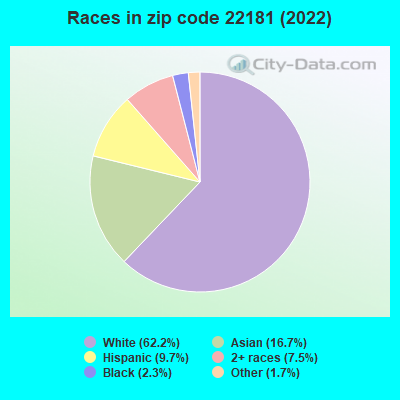
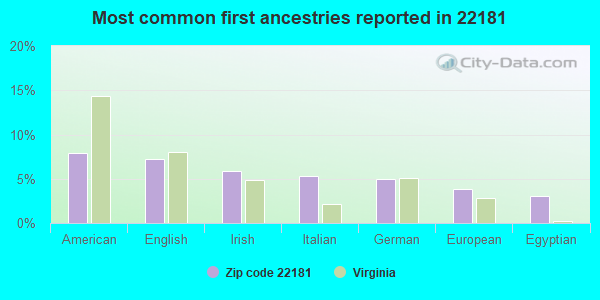
70.6% of residents of 22181 zip code speak English at home.
5.8% of residents speak Spanish at home (75% very well, 21% well, 3% not well).
6.5% of residents speak other Indo-European language at home (89% very well, 11% well).
12.4% of residents speak Asian or Pacific Island language at home (73% very well, 21% well, 7% not well).
5.3% of residents speak other language at home (91% very well, 6% well, 3% not at all).
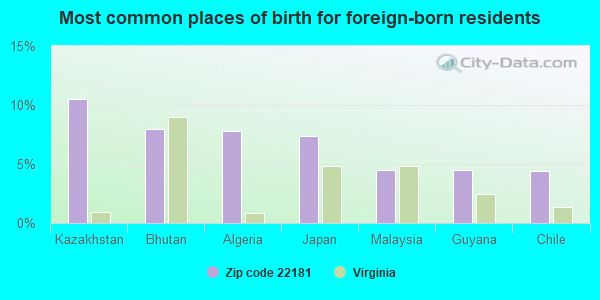
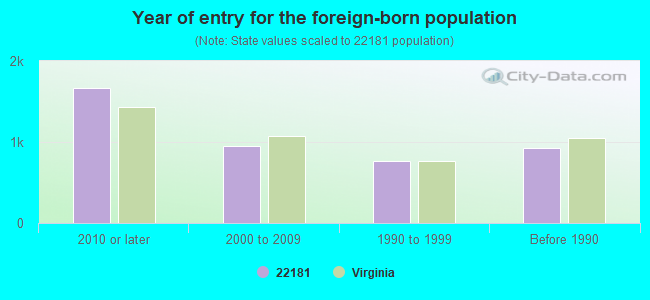
Foreign born population: 3,664 (23.2%) (59.3% of them are naturalized citizens)
Facilities with environmental interests located in this zip code:
AREA 7 MANAGEMENT (9601 COURTHOUSE RD in VIENNA, VA)
Conditionally Exempt Small Quantity Generators, less than 100 kg/month of hazardous waste (Resource Conservation and Recovery Act (tracking hazardous waste)) - notification Organizations: FAIRFAX COUNTY PARK AUTHORITY (CONTACT/OWNER)
Alternative names: NOTTOWAY PARK
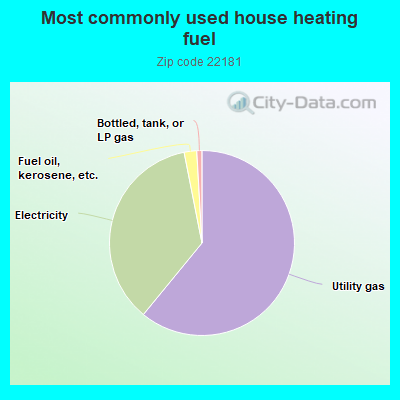
61.0%Utility gas
36.0%Electricity
2.2%Fuel oil, kerosene, etc.
0.9%Bottled, tank, or LP gas
Population in 1990: 12,462. Population change in the 1990s: +2,065 (+16.6%).
Place of birth for U.S.-born residents:
This state: 3,876
Northeast: 2,233
Midwest: 1,268
South: 3,225
West: 1,007
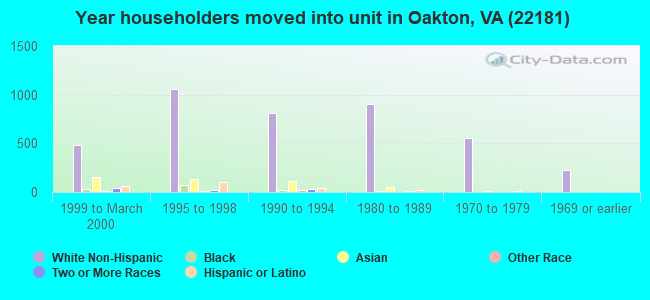
61% of the 22181 zip code residents lived in the same house 5 years ago. Out of people who lived in different houses, 41% lived in this county. Out of people who lived in different counties, 50% lived in Virginia.
90% of the 22181 zip code residents lived in the same house 1 year ago. Out of people who lived in different houses, 18% moved from this county. Out of people who lived in different houses, 22% moved from different county within same state. Out of people who lived in different houses, 38% moved from different state. Out of people who lived in different houses, 27% moved from abroad.
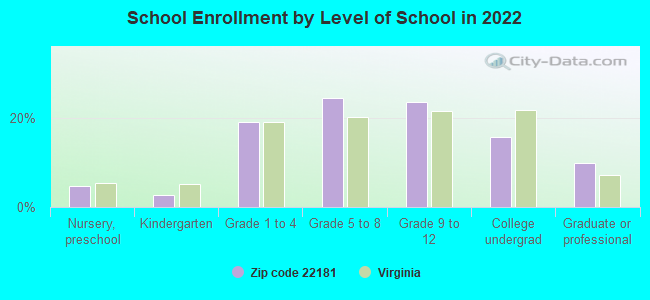
Private vs. public school enrollment:
Students in private schools in grades 1 to 8 (elementary and middle school): 158
Here:
7.7%
Virginia:
13.2%
Students in private schools in grades 9 to 12 (high school): 171
Here:
15.3%
Virginia:
10.2%
Students in private undergraduate colleges: 113
Here:
15.1%
Virginia:
18.7%
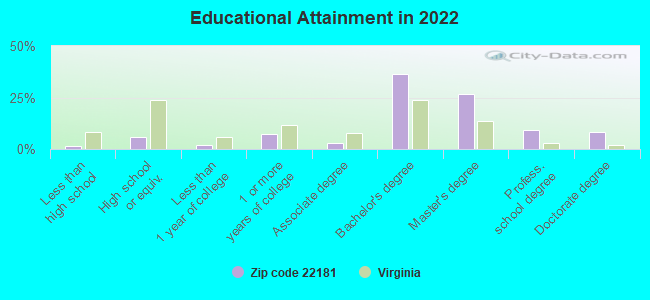
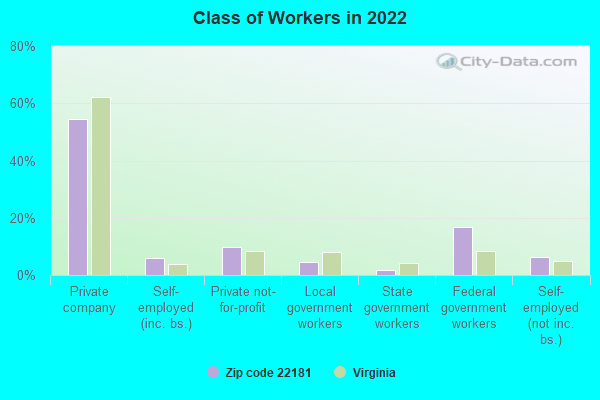
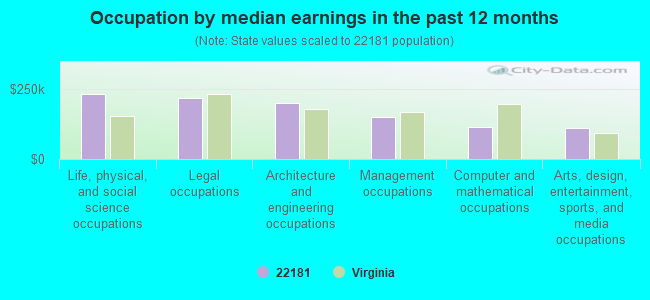
Occupation by median earnings in the past 12 months ($)
232,510Life, physical, and social science occupations
218,937Legal occupations
200,108Architecture and engineering occupations
148,813Management occupations
114,422Computer and mathematical occupations
110,170Arts, design, entertainment, sports, and media occupations
Companies with federal contracts located in this zip code (VIENNA, VA):
CMC VIRGINIA CLUB PROPERTIES I (1953 GALLOWS ROAD, SUITE 5) : $5,802,486 in 138 contractsfrom 1999 to 2006
Contracts for Other Social Services, Maintenance, Repair and Rebuilding of Equipment -- Recreational and Athletic Equipment, Facilities Operations Support Services, Personal Care Services (includes such services as barber and beauty shop, shoe repairs, tailoring, etc.), and moreby Air Force, Army, Virginia Contracting Activity, Department of Defense, and others Signed by year:2000: $214,044; 2001: $281,494; 2002: $577,542; 2003: $1,562,921; 2004: $1,929,218; 2005: $1,068,131; 2006: $46,261.
Biggest contracts:
$448,000 with Air Force for Other Social Services. Signed on 2005-10-01. Completion date: 2006-09-30.
$426,300, same as above.Signed on 2004-10-01. Completion date: 2005-09-30.
$406,000, same as above.Signed on 2003-10-02. Completion date: 2004-09-30.
$386,750 with Air Force for Maintenance, Repair and Rebuilding of Equipment -- Recreational and Athletic Equipment. Signed on 2002-11-18. Completion date: 2003-09-30.
HARRIS TECHNOLOGY, INC (2431 BEEKAY CT; small business) : $5,331,064 in 4 contractsfrom 2000 to 2005
$4,784,905 with Navy for Weapons -- Applied Research and Exploratory Development (R&D). Signed on 2005-10-26. Completion date: 2006-09-30.
$446,901 with Navy for Miscellaneous Aircraft Accessories and Components. Taking place in TX. Signed on 2000-08-14. Completion date: 2001-01-31.
$59,058 with Department of Defense for Other Defense -- Applied Research and Exploratory Development (R&D). Signed on 2000-04-26. Completion date: 2000-10-01.
$40,200, same as above.Signed on 2000-07-18. Completion date: 2000-12-01.
DECISION SCIENCE ASSOCIATES, I (10396 LAWYERS ROAD; small business) : $1,047,255 in 6 contractsfrom 2000 to 2004
Contracts for Other Defense -- Basic Research (R&D) by Air Force Signed by year:2000: $341,664; 2001: $255,822; 2002: $150,000; 2003: $149,769; 2004: $150,000; 2005: $0; 2006: $0.
Biggest contracts:
$341,664 with Air Force for Other Defense -- Basic Research (R&D). Signed on 2000-04-11. Completion date: 2002-05-02.
$255,822, same as above.Signed on 2001-01-31. Completion date: 2002-05-02.
$150,000, same as above.Signed on 2004-02-26. Completion date: 2005-03-31.
$150,000, same as above.Signed on 2002-02-20. Completion date: 2002-05-02.
M C I WORLD (14200 PARK MEADOW DR)
$234,000 with Food and Nutrition Service (disused code, now 12F2) for ADP Telecommunications and Transmission Services. Signed on 2000-07-15. Completion date: 2000-08-15.
DLM ENTERPRISES (2608 LAKEVALE DRIVE; small business) : $83,174 in 6 contractsfrom 2001 to 2002
Contracts for Education Services, Other Education and Training Services by Army Signed by year:2000: $0; 2001: $30,330; 2002: $52,844; 2003: $0; 2004: $0; 2005: $0; 2006: $0.
Biggest contracts:
$52,036 with Army for Education Services. Signed on 2002-10-28. Completion date: 2003-09-30.
$30,330 with Army for Other Education and Training Services. Signed on 2001-10-17. Completion date: 2002-09-30.
$11,582, same as above.Signed on 2002-08-07. Completion date: 2002-09-30.
$9,500, same as above.Signed on 2002-02-27. Completion date: 2002-09-30.
WHITIS, DANA (9480 VIRGINIA CENTER BLVD; small business) : $49,368 in 5 contractsfrom 2003 to 2005
Contracts for Other Administrative Support Services, Program Management/Support Services by Army Signed by year:2000: $0; 2001: $0; 2002: $0; 2003: $23,408; 2004: $18,260; 2005: $7,700; 2006: $0.
Biggest contracts:
$23,408 with Army for Other Administrative Support Services. Signed on 2003-09-17. Completion date: 2004-09-21.
$18,260, same as above.Signed on 2004-04-12. Completion date: 2004-09-21.
$7,700 with Army for Program Management/Support Services. Signed on 2005-02-07. Completion date: 2005-10-18.
$7,172 with Army for Other Administrative Support Services. Signed on 2004-09-09. Completion date: 2004-09-21.
PROVITINA, CLAUDIA (2554 GLEGYLE DR; small business)
$46,500 with Army for Other Professional Services. Signed on 2006-02-02. Completion date: 2007-01-29.
BATES, JEFFREY W (9904 LONGFORD CT; small business) : $41,900 in 5 contractsfrom 2004 to 2006
Contracts for Other ADP and Telecommunications Services (includes data storage on tapes, compact disks, etc.) by Army Signed by year:2000: $0; 2001: $0; 2002: $0; 2003: $0; 2004: $5,000; 2005: $24,000; 2006: $12,900.
Biggest contracts:
$17,400 with Army for Other ADP and Telecommunications Services (includes data storage on tapes, compact disks, etc.). Signed on 2005-01-04. Completion date: 2005-09-30.
$12,900, same as above.Signed on 2006-03-07. Completion date: 2006-09-30.
$6,600, same as above.Signed on 2005-12-23. Completion date: 2005-09-30.
$5,000, same as above.Signed on 2004-09-10. Completion date: 2005-09-30.
Top industries in this zip code by the number of employees in 2005:
Other Services (except Public Administration): Religious Organizations (50-99 employees: 1 establishment, 10-19 employees: 2 establishments, 1-4 employees: 1 establishment)
Health Care and Social Assistance: Child Day Care Services (20-49: 2, 1-4: 4)
Accommodation and Food Services: Limited-Service Restaurants (20-49: 2)
Construction: All Other Specialty Trade Contractors (20-49: 1)
Other Services (except Public Administration): Car Washes (20-49: 1)
Wholesale Trade: Other Electronic Parts and Equipment Merchant Wholesalers (20-49: 1)
Professional, Scientific, and Technical Services: Administrative Management and General Management Consulting Services (10-19: 1, 5-9: 1, 1-4: 5)
Health Care and Social Assistance: Offices of Dentists (10-19: 1, 5-9: 1, 1-4: 3)
Professional, Scientific, and Technical Services: Computer Systems Design Services (5-9: 1, 1-4: 10)
People in group quarters in 2010:
6 people in group homes intended for adults
People in group quarters in 2000:
82 people in nursing homes
Fatal accident statistics in 2013:
Fatal accident count: 1
Vehicles involved in fatal accidents: 1
Fatal accidents caused by drunken drivers: 0
Fatalities: 1
Persons involved in fatal accidents: 1
Pedestrians involved in fatal accidents: 0
Home Mortgage Disclosure Act Aggregated Statistics For Year 2009 (Based on 2 full and 8 partial tracts)
A) FHA, FSA/RHS & VA Home Purchase Loans
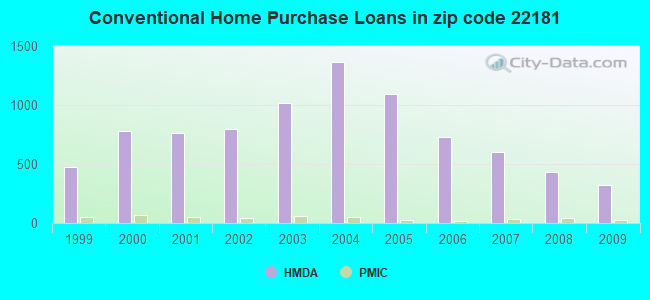
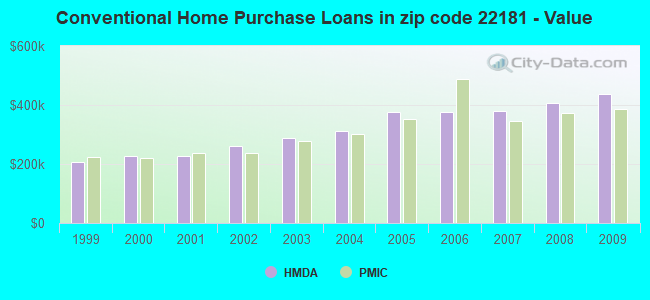
B) Conventional Home Purchase Loans
C) Refinancings
D) Home Improvement Loans
F) Non-occupant Loans on < 5 Family Dwellings (A B C & D)
G) Loans On Manufactured Home Dwelling (A B C & D)
Number
Average Value
Number
Average Value
Number
Average Value
Number
Average Value
Number
Average Value
Number
Average Value
LOANS ORIGINATED
123
$446,484
319
$435,858
1,633
$371,868
50
$224,100
56
$303,511
0
$0
APPLICATIONS APPROVED, NOT ACCEPTED
2
$455,425
28
$431,030
80
$389,031
4
$48,468
2
$220,430
0
$0
APPLICATIONS DENIED
15
$410,989
23
$447,116
234
$420,930
8
$153,378
18
$325,964
2
$60,510
APPLICATIONS WITHDRAWN
10
$378,397
45
$397,818
331
$400,138
12
$100,707
26
$224,321
0
$0
FILES CLOSED FOR INCOMPLETENESS
1
$120,900
7
$524,024
66
$365,910
0
$0
2
$384,315
0
$0
Aggregated Statistics For Year 2008 (Based on 2 full and 8 partial tracts)
A) FHA, FSA/RHS & VA Home Purchase Loans
B) Conventional Home Purchase Loans
C) Refinancings
D) Home Improvement Loans
F) Non-occupant Loans on < 5 Family Dwellings (A B C & D)
G) Loans On Manufactured Home Dwelling (A B C & D)
Number
Average Value
Number
Average Value
Number
Average Value
Number
Average Value
Number
Average Value
Number
Average Value
LOANS ORIGINATED
67
$403,418
432
$407,379
498
$359,289
64
$105,014
67
$269,018
0
$0
APPLICATIONS APPROVED, NOT ACCEPTED
4
$364,078
43
$436,479
82
$366,030
7
$215,657
8
$310,660
0
$0
APPLICATIONS DENIED
9
$283,972
38
$349,697
174
$415,813
27
$205,240
30
$266,911
1
$36,470
APPLICATIONS WITHDRAWN
7
$408,560
64
$423,759
126
$374,165
16
$84,146
12
$295,672
0
$0
FILES CLOSED FOR INCOMPLETENESS
4
$492,515
10
$398,849
25
$369,248
2
$134,465
1
$172,030
0
$0
Aggregated Statistics For Year 2007 (Based on 2 full and 8 partial tracts)
A) FHA, FSA/RHS & VA Home Purchase Loans
B) Conventional Home Purchase Loans
C) Refinancings
D) Home Improvement Loans
E) Loans on Dwellings For 5+ Families
F) Non-occupant Loans on < 5 Family Dwellings (A B C & D)
Number
Average Value
Number
Average Value
Number
Average Value
Number
Average Value
Number
Average Value
Number
Average Value
LOANS ORIGINATED
4
$322,780
605
$378,234
535
$346,856
70
$162,715
2
$632,895
83
$323,671
APPLICATIONS APPROVED, NOT ACCEPTED
0
$0
40
$324,164
104
$325,255
23
$108,199
0
$0
21
$401,250
APPLICATIONS DENIED
0
$0
53
$352,222
162
$390,875
30
$282,102
0
$0
45
$340,920
APPLICATIONS WITHDRAWN
0
$0
103
$313,160
144
$378,837
11
$216,726
7
$284,566
30
$269,748
FILES CLOSED FOR INCOMPLETENESS
0
$0
2
$612,905
44
$436,221
2
$49,600
0
$0
11
$354,248
Aggregated Statistics For Year 2006 (Based on 2 full and 8 partial tracts)
A) FHA, FSA/RHS & VA Home Purchase Loans
B) Conventional Home Purchase Loans
C) Refinancings
D) Home Improvement Loans
F) Non-occupant Loans on < 5 Family Dwellings (A B C & D)
G) Loans On Manufactured Home Dwelling (A B C & D)
Number
Average Value
Number
Average Value
Number
Average Value
Number
Average Value
Number
Average Value
Number
Average Value
LOANS ORIGINATED
3
$274,070
726
$376,450
651
$345,035
122
$134,643
106
$318,437
0
$0
APPLICATIONS APPROVED, NOT ACCEPTED
0
$0
60
$404,408
104
$315,632
32
$122,951
23
$462,849
0
$0
APPLICATIONS DENIED
0
$0
67
$337,745
187
$408,131
29
$114,701
32
$372,456
1
$78,170
APPLICATIONS WITHDRAWN
0
$0
47
$332,828
167
$348,680
11
$154,113
13
$326,452
0
$0
FILES CLOSED FOR INCOMPLETENESS
0
$0
3
$384,767
41
$476,905
6
$179,632
4
$303,822
0
$0
Aggregated Statistics For Year 2005 (Based on 2 full and 8 partial tracts)
A) FHA, FSA/RHS & VA Home Purchase Loans
B) Conventional Home Purchase Loans
C) Refinancings
D) Home Improvement Loans
F) Non-occupant Loans on < 5 Family Dwellings (A B C & D)
Number
Average Value
Number
Average Value
Number
Average Value
Number
Average Value
Number
Average Value
LOANS ORIGINATED
2
$183,690
1,093
$377,205
983
$354,228
113
$168,531
191
$302,737
APPLICATIONS APPROVED, NOT ACCEPTED
0
$0
89
$394,051
132
$323,519
21
$193,103
20
$306,812
APPLICATIONS DENIED
0
$0
121
$336,789
173
$398,717
21
$158,407
34
$312,343
APPLICATIONS WITHDRAWN
0
$0
93
$359,097
162
$350,965
27
$179,500
18
$287,334
FILES CLOSED FOR INCOMPLETENESS
0
$0
14
$421,976
57
$371,585
8
$335,604
2
$312,480
Aggregated Statistics For Year 2004 (Based on 2 full and 8 partial tracts)
A) FHA, FSA/RHS & VA Home Purchase Loans
B) Conventional Home Purchase Loans
C) Refinancings
D) Home Improvement Loans
F) Non-occupant Loans on < 5 Family Dwellings (A B C & D)
Number
Average Value
Number
Average Value
Number
Average Value
Number
Average Value
Number
Average Value
LOANS ORIGINATED
9
$246,953
1,363
$311,847
1,290
$291,998
79
$173,466
250
$260,196
APPLICATIONS APPROVED, NOT ACCEPTED
0
$0
112
$339,513
130
$240,297
9
$160,640
43
$218,162
APPLICATIONS DENIED
0
$0
116
$319,313
176
$294,261
27
$127,939
62
$271,729
APPLICATIONS WITHDRAWN
2
$291,085
115
$325,013
176
$282,275
21
$88,125
26
$348,812
FILES CLOSED FOR INCOMPLETENESS
0
$0
12
$270,381
48
$318,633
6
$144,013
7
$180,103
Aggregated Statistics For Year 2003 (Based on 2 full and 8 partial tracts)
A) FHA, FSA/RHS & VA Home Purchase Loans
B) Conventional Home Purchase Loans
C) Refinancings
D) Home Improvement Loans
F) Non-occupant Loans on < 5 Family Dwellings (A B C & D)
Number
Average Value
Number
Average Value
Number
Average Value
Number
Average Value
Number
Average Value
LOANS ORIGINATED
22
$195,025
1,019
$287,531
3,773
$259,078
37
$82,802
153
$199,868
APPLICATIONS APPROVED, NOT ACCEPTED
0
$0
101
$231,421
292
$272,436
19
$70,986
26
$211,547
APPLICATIONS DENIED
1
$145,670
59
$232,129
217
$297,292
16
$66,748
14
$170,394
APPLICATIONS WITHDRAWN
7
$159,544
80
$290,532
267
$252,778
6
$56,688
14
$157,832
FILES CLOSED FOR INCOMPLETENESS
0
$0
22
$311,667
97
$311,670
0
$0
10
$279,405
Aggregated Statistics For Year 2002 (Based on 2 full and 6 partial tracts)
A) FHA, FSA/RHS & VA Home Purchase Loans
B) Conventional Home Purchase Loans
C) Refinancings
D) Home Improvement Loans
E) Loans on Dwellings For 5+ Families
F) Non-occupant Loans on < 5 Family Dwellings (A B C & D)
Number
Average Value
Number
Average Value
Number
Average Value
Number
Average Value
Number
Average Value
Number
Average Value
LOANS ORIGINATED
27
$156,296
796
$261,650
2,612
$259,514
73
$54,809
0
$0
67
$182,950
APPLICATIONS APPROVED, NOT ACCEPTED
0
$0
42
$264,528
170
$240,878
24
$43,257
0
$0
2
$346,040
APPLICATIONS DENIED
3
$198,760
32
$245,548
194
$255,330
20
$34,548
0
$0
8
$181,729
APPLICATIONS WITHDRAWN
2
$148,395
55
$292,479
217
$232,756
6
$59,765
1
$340,370
8
$226,922
FILES CLOSED FOR INCOMPLETENESS
2
$104,160
6
$422,125
52
$247,698
0
$0
0
$0
4
$132,382
Aggregated Statistics For Year 2001 (Based on 2 full and 6 partial tracts)
A) FHA, FSA/RHS & VA Home Purchase Loans
B) Conventional Home Purchase Loans
C) Refinancings
D) Home Improvement Loans
F) Non-occupant Loans on < 5 Family Dwellings (A B C & D)
Number
Average Value
Number
Average Value
Number
Average Value
Number
Average Value
Number
Average Value
LOANS ORIGINATED
61
$144,233
764
$228,538
1,661
$239,396
77
$48,635
56
$160,515
APPLICATIONS APPROVED, NOT ACCEPTED
2
$105,150
48
$159,547
107
$223,965
18
$58,324
8
$121,172
APPLICATIONS DENIED
2
$135,520
29
$211,680
145
$193,699
38
$53,029
14
$184,391
APPLICATIONS WITHDRAWN
2
$144,855
50
$221,538
139
$251,443
22
$34,870
8
$188,270
FILES CLOSED FOR INCOMPLETENESS
0
$0
8
$347,375
45
$219,044
0
$0
0
$0
Aggregated Statistics For Year 2000 (Based on 2 full and 6 partial tracts)
A) FHA, FSA/RHS & VA Home Purchase Loans
B) Conventional Home Purchase Loans
C) Refinancings
D) Home Improvement Loans
F) Non-occupant Loans on < 5 Family Dwellings (A B C & D)
Number
Average Value
Number
Average Value
Number
Average Value
Number
Average Value
Number
Average Value
LOANS ORIGINATED
60
$141,920
776
$228,693
250
$189,834
95
$41,272
35
$178,843
APPLICATIONS APPROVED, NOT ACCEPTED
0
$0
56
$214,365
52
$175,239
11
$77,292
2
$52,250
APPLICATIONS DENIED
1
$119,160
40
$232,088
95
$220,752
33
$55,813
5
$98,650
APPLICATIONS WITHDRAWN
6
$80,468
57
$272,568
50
$188,739
17
$121,501
4
$61,875
FILES CLOSED FOR INCOMPLETENESS
0
$0
11
$254,485
8
$173,131
2
$26,845
0
$0
Aggregated Statistics For Year 1999 (Based on 1 full and 4 partial tracts)
A) FHA, FSA/RHS & VA Home Purchase Loans
B) Conventional Home Purchase Loans
C) Refinancings
D) Home Improvement Loans
F) Non-occupant Loans on < 5 Family Dwellings (A B C & D)
2004 - 2018 National Fire Incident Reporting System (NFIRS) incidents
Based on the data from the years 2004 - 2018 the average number of fire incidents per year is 20. The highest number of fire incidents - 32 took place in 2010, and the least - 3 in 2004. The data has a growing trend.
When looking into fire subcategories, the most reports belonged to: Structure Fires (48.2%), and Outside Fires (34.4%).
Fire incident types reported to NFIRS in Zip Code 22181


 Nearest zip codes: 22185, 22182, 22180, 22124, 22031, 20191.


 Based on the data from the years 2004 - 2018 the average number of fire incidents per year is 20. The highest number of fire incidents - 32 took place in 2010, and the least - 3 in 2004. The data has a growing trend.
 When looking into fire subcategories, the most reports belonged to: Structure Fires (48.2%), and Outside Fires (34.4%).