Estimated zip code population in 2022: 1,951 Zip code population in 2010: 1,796 Zip code population in 2000: 1,998
Houses and condos: 1,201 Renter-occupied apartments: 322
% of renters here:
42%
State:
33%
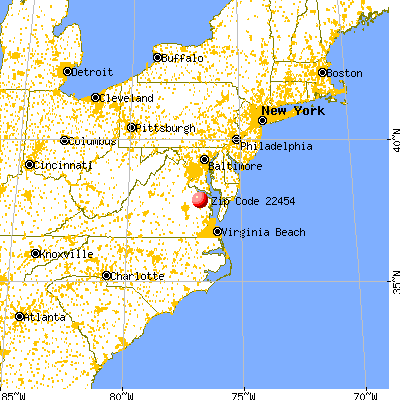
March 2022 cost of living index in zip code 22454: 86.5 (less than average, U.S. average is 100)
Land area: 40.7 sq. mi. Water area: 6.1 sq. mi.
Population density: 48 people per square mile
(very low).
OSM Map
General Map
Google Map
MSN Map
OSM Map
General Map
Google Map
MSN Map
OSM Map
General Map
Google Map
MSN Map
OSM Map
General Map
Google Map
MSN Map
Please wait while loading the map...
Real estate property taxes paid for housing units in 2022:
This zip code:
0.5% ($1,455)
Virginia:
0.7% ($2,617)
Median real estate property taxes paid for housing units with mortgages in 2022: $1,290 (0.5%) Median real estate property taxes paid for housing units with no mortgage in 2022: $2,797 (0.7%)
Business Search- 14 Million verified businesses
Males: 884
(45.3%)
Females: 1,066
(54.7%)
For population 25 years and over in 22454:
High school or higher: 91.8%
Bachelor's degree or higher: 16.0%
Graduate or professional degree: 5.7%
Unemployed: 12.9%
Mean travel time to work (commute): 28.1 minutes
For population 15 years and over in 22454:
Never married: 19.4%
Now married: 48.7%
Separated: 4.0%
Widowed: 7.5%
Divorced: 20.5%
Zip code 22454 compared to state average:
Median household income below state average.
Unemployed percentage significantly above state average.
Black race population percentage significantly below state average.
Hispanic race population percentage significantly below state average.
Median age significantly above state average.
Foreign-born population percentage significantly below state average.
Length of stay since moving in significantly above state average.
Number of college students below state average.
Percentage of population with a bachelor's degree or higher significantly below state average.
Averages for the 2020 tax year for zip code 22454, filed in 2021:
Average Adjusted Gross Income (AGI) in 2020: $57,656 (Individual Income Tax Returns)
Here:
$57,656
State:
$86,446
Salary/wage: $47,073 (reported on 84.1% of returns)
Here:
$47,073
State:
$71,185
(% of AGI for various income ranges: 1030.5% for AGIs below $25k, 3594.8% for AGIs $25k-50k, 6540.0% for AGIs $50k-75k, 8748.0% for AGIs $75k-100k, 12837.1% for AGIs $100k-200k)
Taxable interest for individuals: $830 (reported on 30.7% of returns)
This zip code:
$830
Virginia:
$1,805
(% of AGI for various income ranges: 11.4% for AGIs below $25k, 16.7% for AGIs $25k-50k, 27.8% for AGIs $50k-75k, 78.0% for AGIs $75k-100k, 92.9% for AGIs $100k-200k)
Ordinary dividends: $4,212 (reported on 19.3% of returns)
Here:
$4,212
State:
$8,327
(% of AGI for various income ranges: 19.5% for AGIs below $25k, 66.7% for AGIs $25k-50k, 175.6% for AGIs $50k-75k, 44.0% for AGIs $75k-100k, 504.3% for AGIs $100k-200k)
Net capital gain/loss in AGI: +$5,400 (reported on 14.8% of returns)
Here:
+$5,400
State:
+$24,644
(% of AGI for various income ranges: 44.8% for AGIs $25k-50k, 28.9% for AGIs $50k-75k, 831.4% for AGIs $100k-200k)
Profit/loss from business: +$8,171 (reported on 15.9% of returns)
Here:
+$8,171
State:
+$12,836
(% of AGI for various income ranges: 92.7% for AGIs below $25k, 111.0% for AGIs $25k-50k, 252.2% for AGIs $50k-75k, 685.7% for AGIs $100k-200k)
Taxable individual retirement arrangement distribution: $15,530 (reported on 11.4% of returns)
22454:
$15,530
Virginia:
$21,535
(% of AGI for various income ranges: 145.0% for AGIs below $25k, 552.2% for AGIs $50k-75k, 1052.9% for AGIs $100k-200k)
Total itemized deductions: $30,014 (reported on 8.0% of returns)
Here:
$30,014
State:
$33,287
(% of AGI for various income ranges: 958.9% for AGIs $50k-75k, 1768.6% for AGIs $100k-200k)
Charity contributions: $10,260 (reported on 5.7% of returns)
Here:
$10,260
State:
$10,381
(% of AGI for various income ranges: 63.8% for AGIs $25k-50k, 541.4% for AGIs $100k-200k)
Taxes paid: $6,257 (reported on 8.0% of returns)
22454:
$6,257
State:
$8,284
(% of AGI for various income ranges: 184.4% for AGIs $50k-75k, 388.6% for AGIs $100k-200k)
Earned income credit: $2,000 (reported on 18.2% of returns)
Here:
$2,000
State:
$2,214
(% of AGI for various income ranges: 88.2% for AGIs below $25k, 60.0% for AGIs $25k-50k)
Percentage of individuals using paid preparers for their 2020 taxes: 93.2%
Here:
93%
State:
92%
(% for various income ranges: 90.0% for AGIs below $25k, 96.0% for AGIs $25k-50k, 92.3% for AGIs $50k-75k, 100.0% for AGIs $75k-100k, 90.0% for AGIs $100k-200k, 100.0% for AGIs over 200k)
Averages for the 2012 tax year for zip code 22454, filed in 2013:
Average Adjusted Gross Income (AGI) in 2012: $44,032 (Individual Income Tax Returns)
Here:
$44,032
State:
$71,192
Salary/wage: $36,834 (reported on 84.8% of returns)
Here:
$36,834
State:
$59,229
(% of AGI for various income ranges: 77.7% for AGIs below $25k, 78.8% for AGIs $25k-50k, 73.1% for AGIs $50k-75k, 74.0% for AGIs $75k-100k, 60.7% for AGIs $100k-200k)
Taxable interest for individuals: $621 (reported on 30.4% of returns)
This zip code:
$621
Virginia:
$1,600
(% of AGI for various income ranges: 0.6% for AGIs below $25k, 0.6% for AGIs $25k-50k, 0.3% for AGIs $50k-75k, 0.7% for AGIs $75k-100k, 0.2% for AGIs $100k-200k)
Ordinary dividends: $2,217 (reported on 15.2% of returns)
Here:
$2,217
State:
$6,959
(% of AGI for various income ranges: 0.6% for AGIs below $25k, 0.4% for AGIs $25k-50k, 2.1% for AGIs $50k-75k, 0.7% for AGIs $100k-200k)
Net capital gain/loss in AGI: +$2,257 (reported on 8.9% of returns)
Here:
+$2,257
State:
+$16,672
(% of AGI for various income ranges: 1.7% for AGIs $100k-200k)
Profit/loss from business: +$10,750 (reported on 12.7% of returns)
Here:
+$10,750
State:
+$14,116
(% of AGI for various income ranges: 6.4% for AGIs below $25k, 5.3% for AGIs $25k-50k, 6.6% for AGIs $50k-75k)
Taxable individual retirement arrangement distribution: $12,178 (reported on 11.4% of returns)
22454:
$12,178
Virginia:
$16,667
(% of AGI for various income ranges: 3.5% for AGIs below $25k, 4.8% for AGIs $25k-50k, 10.8% for AGIs $75k-100k)
Total itemized deductions: $19,996 (25% of AGI, reported on 30.4% of returns)
Here:
$19,996
State:
$26,596
Here:
25.1% of AGI
State:
20.1% of AGI
(% of AGI for various income ranges: 10.8% for AGIs below $25k, 10.1% for AGIs $25k-50k, 18.2% for AGIs $50k-75k, 11.7% for AGIs $75k-100k, 15.8% for AGIs $100k-200k)
Charity contributions: $3,072 (reported on 22.8% of returns)
Here:
$3,072
State:
$4,443
(% of AGI for various income ranges: 1.2% for AGIs $25k-50k, 1.9% for AGIs $50k-75k, 1.9% for AGIs $75k-100k, 2.0% for AGIs $100k-200k)
Taxes paid: $6,025 (reported on 30.4% of returns)
22454:
$6,025
State:
$9,951
(% of AGI for various income ranges: 1.7% for AGIs below $25k, 2.5% for AGIs $25k-50k, 4.7% for AGIs $50k-75k, 3.6% for AGIs $75k-100k, 6.1% for AGIs $100k-200k)
Earned income credit: $2,145 (reported on 25.3% of returns)
Here:
$2,145
State:
$2,211
(% of AGI for various income ranges: 8.3% for AGIs below $25k, 1.3% for AGIs $25k-50k)
Percentage of individuals using paid preparers for their 2012 taxes: 46.8%
Here:
47%
State:
46%
(% for various income ranges: 47.1% for AGIs below $25k, 47.6% for AGIs $25k-50k, 45.5% for AGIs $50k-75k, 33.3% for AGIs $75k-100k, 57.1% for AGIs $100k-200k)
Averages for the 2004 tax year for zip code 22454, filed in 2005:
Average Adjusted Gross Income (AGI) in 2004: $38,209 (Individual Income Tax Returns)
Here:
$38,209
State:
$56,704
Salary/wage: $32,374 (reported on 84.4% of returns)
Here:
$32,374
State:
$48,441
(% of AGI for various income ranges: 88.3% for AGIs below $10k, 76.7% for AGIs $10k-25k, 84.2% for AGIs $25k-50k, 75.8% for AGIs $50k-75k, 70.8% for AGIs $75k-100k, 45.9% for AGIs over 100k)
Taxable interest for individuals: $1,065 (reported on 41.0% of returns)
This zip code:
$1,065
Virginia:
$1,688
(% of AGI for various income ranges: 2.8% for AGIs below $10k, 1.8% for AGIs $10k-25k, 0.7% for AGIs $25k-50k, 1.0% for AGIs $50k-75k, 1.2% for AGIs $75k-100k, 1.2% for AGIs over 100k)
Taxable dividends: $1,953 (reported on 21.4% of returns)
Here:
$1,953
State:
$4,028
(% of AGI for various income ranges: 1.8% for AGIs below $10k, 1.6% for AGIs $10k-25k, 0.3% for AGIs $25k-50k, 2.4% for AGIs $50k-75k, 1.1% for AGIs $75k-100k, 0.2% for AGIs over 100k)
Net capital gain/loss: +$2,862 (reported on 13.3% of returns)
Here:
+$2,862
State:
+$14,375
(% of AGI for various income ranges: 0.2% for AGIs $10k-25k, 0.1% for AGIs $25k-50k, 1.0% for AGIs $50k-75k, -0.1% for AGIs $75k-100k, 3.8% for AGIs over 100k)
Profit/loss from business: +$8,172 (reported on 15.4% of returns)
Here:
+$8,172
State:
+$13,342
(% of AGI for various income ranges: 7.0% for AGIs below $10k, 4.4% for AGIs $10k-25k, 5.0% for AGIs $25k-50k, 6.3% for AGIs $50k-75k)
Total itemized deductions: $16,088 (22% of AGI, reported on 24.4% of returns)
Here:
$16,088
State:
$21,492
Here:
22.0% of AGI
State:
21.0% of AGI
(% of AGI for various income ranges: 6.6% for AGIs $10k-25k, 8.5% for AGIs $25k-50k, 11.1% for AGIs $50k-75k, 13.8% for AGIs $75k-100k, 11.9% for AGIs over 100k)
Charity contributions deductions: $3,217 (4% of AGI, reported on 22.9% of returns)
Here:
$3,217
State:
$3,794
Here:
4.4% of AGI
State:
3.5% of AGI
(% of AGI for various income ranges: 1.3% for AGIs $10k-25k, 1.3% for AGIs $25k-50k, 2.0% for AGIs $50k-75k, 2.4% for AGIs $75k-100k, 2.8% for AGIs over 100k)
Total tax: $4,977 (reported on 72.8% of returns)
22454:
$4,977
State:
$9,537
(% of AGI for various income ranges: 3.0% for AGIs below $10k, 3.6% for AGIs $10k-25k, 6.9% for AGIs $25k-50k, 8.7% for AGIs $50k-75k, 11.2% for AGIs $75k-100k, 16.5% for AGIs over 100k)
Earned income credit: $1,669 (reported on 20.6% of returns)
Here:
$1,669
State:
$1,734
Percentage of individuals using paid preparers for their 2004 taxes: 53.5%
Here:
53%
State:
52%
(% for various income ranges: 47.1% for AGIs below $10k, 52.7% for AGIs $10k-25k, 55.8% for AGIs $25k-50k, 59.3% for AGIs $50k-75k, 55.8% for AGIs $75k-100k, 52.0% for AGIs over 100k)
Household received Food Stamps/SNAP in the past 12 months: 107 Household did not receive Food Stamps/SNAP in the past 12 months: 674
Women who did not have a birth in the past 12 months: 339 (161 now married, 177 unmarried)
Housing units in zip code 22454 with a mortgage: 217 (12 second mortgage, 9 both second mortgage and home equity loan) Median monthly owner costs for units with a mortgage: $1,106 Median monthly owner costs for units without a mortgage: $644
Residents with income below the poverty level in 2022:
This zip code:
20.1%
Whole state:
10.6%
Residents with income below 50% of the poverty level in 2022:
This zip code:
12.0%
Whole state:
5.2%
Median number of rooms in houses and condos:
Here:
5.4
State:
7.0
Median number of rooms in apartments:
Here:
5.6
State:
4.3
Notable locations in this zip code not listed on our city pages
Churches in zip code 22454 include: Angel Visit Church (A), Rappahannock Church (B), Trinity Church (C), Ephesus Church (D), Good Hope Church (E), Howerton Church (F), Lebanon Church (G), Oak Grove Church (H). Display/hide their locations on the map
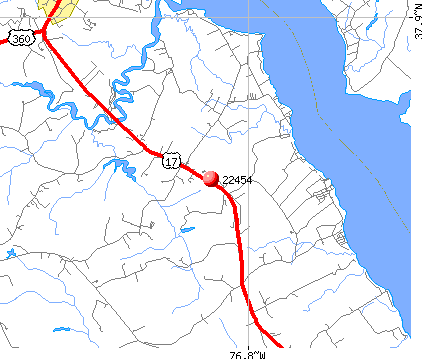
Streams, rivers, and creeks: Tuscarora Creek (A), Taylors Creek (B), Piscataway Creek (C), Mussel Swamp (D), Mill Creek (E), Bellview Creek (F), North Branch Beaverdam Swamp (G). Display/hide their locations on the map
Size of family households: 178 2-persons, 176 3-persons, 8 4-persons, 81 5-persons
Size of nonfamily households: 311 1-person, 17 2-persons
115 married couples with children.
167 single-parent households (167 women).
99.3% of residents of 22454 zip code speak English at home.
0.3% of residents speak other Indo-European language at home (100% very well).
Foreign born population: 9 (0.5%) (100.0% of them are naturalized citizens)
This zip code:
0.5%
Whole state:
12.7%
89%Sweden
41%American
25%English
4%Irish
2%Scottish
1%European
1%Greek
1%Italian
Year of entry for the foreign-born population
02010 or later
02000 to 2009
01990 to 1999
8Before 1990
Housing units lacking complete plumbing facilities: 3.8% Housing units lacking complete kitchen facilities: 1.0%
81.8%Electricity
10.7%Bottled, tank, or LP gas
3.4%Fuel oil, kerosene, etc.
1.6%No fuel used
1.3%Wood
0.7%Utility gas
0.7%Other fuel
Population in 1990: 1,795. Population change in the 1990s: +203 (+11.3%).
Place of birth for U.S.-born residents:
This state: 1,695
Northeast: 60
South: 153
West: 17
69% of the 22454 zip code residents lived in the same house 5 years ago. Out of people who lived in different houses, 47% lived in this county. Out of people who lived in different counties, 50% lived in Virginia.
92% of the 22454 zip code residents lived in the same house 1 year ago. Out of people who lived in different houses, 71% moved from different county within same state. Out of people who lived in different houses, 37% moved from different state.
Private vs. public school enrollment:
Students in private schools in grades 1 to 8 (elementary and middle school):
Here:
0.0%
Virginia:
13.2%
Students in private schools in grades 9 to 12 (high school): 22
Here:
22.3%
Virginia:
10.2%
Students in private undergraduate colleges:
Here:
0.0%
Virginia:
18.7%
Occupation by median earnings in the past 12 months ($)
54,595Management occupations
45,571Sales and related occupations
16,408Business and financial operations occupations
11,647Office and administrative support occupations
Top industries in this zip code by the number of employees in 2005:
Construction: New Single-Family Housing Construction (except Operative Builders) (5-9: 1, 1-4: 2)
Construction: Poured Concrete Foundation and Structure Contractors (5-9: 1, 1-4: 1)
Construction: Other Heavy and Civil Engineering Construction (5-9: 1)
Other Services (except Public Administration): Religious Organizations (5-9: 1)
Administrative and Support and Waste Management and Remediation Services: Investigation Services (1-4: 1)
Construction: Flooring Contractors (1-4: 1)
Other Services (except Public Administration): Commercial and Industrial Machinery and Equipment (except Automotive and Electronic) Repair and Maintenance (1-4: 1)
Administrative and Support and Waste Management and Remediation Services: Landscaping Services (1-4: 1)
Fatal accident statistics in 2010:
Fatal accident count: 1
Vehicles involved in fatal accidents: 1
Fatal accidents caused by drunken drivers: 0
Fatalities: 1
Persons involved in fatal accidents: 1
Pedestrians involved in fatal accidents: 0
Most common first names in zip code 22454 among deceased individuals
Name
Count
Lived (average)
Mary
23
82.4 years
William
18
74.8 years
John
16
77.5 years
James
15
68.5 years
Robert
11
79.0 years
Joseph
8
72.6 years
George
7
77.5 years
Richard
7
75.4 years
Margaret
7
81.6 years
Charles
7
73.3 years
Most common last names in zip code 22454 among deceased individuals
Last name
Count
Lived (average)
Davis
14
72.5 years
Ware
13
85.4 years
Washington
9
80.1 years
Haile
8
68.3 years
Taylor
8
69.1 years
Cox
6
83.3 years
Akers
6
70.3 years
Robinson
6
70.0 years
Harris
6
82.5 years
Johnson
6
67.5 years
Discuss , Virginia (VA) on our hugely popular Virginia forum.


 Nearest zip codes: 22437, 23115, 23085, 22548, 22504, 22572.