Estimated zip code population in 2022: 4,705 Zip code population in 2010: 5,402 Zip code population in 2000: 5,116
Houses and condos: 2,981 Renter-occupied apartments: 359
% of renters here:
18%
State:
33%
March 2022 cost of living index in zip code 22520: 85.2 (less than average, U.S. average is 100)
Land area: 91.5 sq. mi. Water area: 11.6 sq. mi.
Population density: 51 people per square mile
(very low).
OSM Map
General Map
Google Map
MSN Map
OSM Map
General Map
Google Map
MSN Map
OSM Map
General Map
Google Map
MSN Map
OSM Map
General Map
Google Map
MSN Map
Please wait while loading the map...
Real estate property taxes paid for housing units in 2022:
This zip code:
0.5% ($1,274)
Virginia:
0.7% ($2,617)
Median real estate property taxes paid for housing units with mortgages in 2022: $1,308 (0.5%) Median real estate property taxes paid for housing units with no mortgage in 2022: $1,227 (0.5%)
Estimated median house/condo value in 2022: $255,064
22520:
$255,064
Virginia:
$365,700
According to our research of Virginia and other state lists, there were 20 registered sex offenders living in 22520 zip code as of June 16, 2024. The ratio of all residents to sex offenders in zip code 22520 is 328 to 1. The ratio of registered sex offenders to all residents in this zip code is near the state average.
Median resident age:
This zip code:
51.1 years
Virginia median age:
39.0 years
Average household size:
This zip code:
2.4 people
Virginia:
2.5 people
Averages for the 2020 tax year for zip code 22520, filed in 2021:
Average Adjusted Gross Income (AGI) in 2020: $61,912 (Individual Income Tax Returns)
Here:
$61,912
State:
$86,446
Salary/wage: $50,748 (reported on 77.2% of returns)
Here:
$50,748
State:
$71,185
(% of AGI for various income ranges: 1162.7% for AGIs below $25k, 3557.6% for AGIs $25k-50k, 6378.9% for AGIs $50k-75k, 9295.6% for AGIs $75k-100k, 16034.2% for AGIs $100k-200k, 84145.0% for AGIs over 200k)
Taxable interest for individuals: $1,821 (reported on 29.1% of returns)
This zip code:
$1,821
Virginia:
$1,805
(% of AGI for various income ranges: 15.7% for AGIs below $25k, 23.8% for AGIs $25k-50k, 73.0% for AGIs $50k-75k, 148.9% for AGIs $75k-100k, 216.3% for AGIs $100k-200k, 1660.0% for AGIs over 200k)
Ordinary dividends: $6,471 (reported on 16.8% of returns)
Here:
$6,471
State:
$8,327
(% of AGI for various income ranges: 20.0% for AGIs below $25k, 38.2% for AGIs $25k-50k, 73.0% for AGIs $50k-75k, 186.7% for AGIs $75k-100k, 435.3% for AGIs $100k-200k, 6230.0% for AGIs over 200k)
Net capital gain/loss in AGI: +$14,931 (reported on 14.6% of returns)
Here:
+$14,931
State:
+$24,644
(% of AGI for various income ranges: 8.7% for AGIs below $25k, 25.1% for AGIs $25k-50k, 132.6% for AGIs $50k-75k, 123.9% for AGIs $75k-100k, 876.8% for AGIs $100k-200k, 17025.0% for AGIs over 200k)
Profit/loss from business: +$9,085 (reported on 14.6% of returns)
Here:
+$9,085
State:
+$12,836
(% of AGI for various income ranges: 118.4% for AGIs below $25k, 32.4% for AGIs $25k-50k, 126.3% for AGIs $50k-75k, 11.7% for AGIs $75k-100k, 703.2% for AGIs $100k-200k, 4530.0% for AGIs over 200k)
Taxable individual retirement arrangement distribution: $16,581 (reported on 10.1% of returns)
22520:
$16,581
Virginia:
$21,535
(% of AGI for various income ranges: 36.6% for AGIs below $25k, 104.7% for AGIs $25k-50k, 158.9% for AGIs $50k-75k, 488.9% for AGIs $75k-100k, 1290.5% for AGIs $100k-200k)
Total itemized deductions: $31,781 (reported on 10.1% of returns)
Here:
$31,781
State:
$33,287
(% of AGI for various income ranges: 206.0% for AGIs $25k-50k, 409.6% for AGIs $50k-75k, 745.0% for AGIs $75k-100k, 1658.9% for AGIs $100k-200k, 10275.0% for AGIs over 200k)
Charity contributions: $9,470 (reported on 8.6% of returns)
Here:
$9,470
State:
$10,381
(% of AGI for various income ranges: 26.6% for AGIs below $25k, 100.7% for AGIs $50k-75k, 186.1% for AGIs $75k-100k, 411.6% for AGIs $100k-200k, 3055.0% for AGIs over 200k)
Taxes paid: $7,430 (reported on 10.1% of returns)
22520:
$7,430
State:
$8,284
(% of AGI for various income ranges: 31.3% for AGIs $25k-50k, 77.0% for AGIs $50k-75k, 203.3% for AGIs $75k-100k, 462.6% for AGIs $100k-200k, 2060.0% for AGIs over 200k)
Earned income credit: $2,329 (reported on 17.9% of returns)
Here:
$2,329
State:
$2,214
(% of AGI for various income ranges: 110.3% for AGIs below $25k, 84.2% for AGIs $25k-50k)
Percentage of individuals using paid preparers for their 2020 taxes: 90.7%
Here:
91%
State:
92%
(% for various income ranges: 91.1% for AGIs below $25k, 91.5% for AGIs $25k-50k, 90.2% for AGIs $50k-75k, 86.2% for AGIs $75k-100k, 92.3% for AGIs $100k-200k, 90.0% for AGIs over 200k)
Averages for the 2012 tax year for zip code 22520, filed in 2013:
Average Adjusted Gross Income (AGI) in 2012: $50,203 (Individual Income Tax Returns)
Here:
$50,203
State:
$71,192
Salary/wage: $41,313 (reported on 79.0% of returns)
Here:
$41,313
State:
$59,229
(% of AGI for various income ranges: 73.2% for AGIs below $25k, 74.1% for AGIs $25k-50k, 64.5% for AGIs $50k-75k, 69.1% for AGIs $75k-100k, 62.6% for AGIs $100k-200k, 40.7% for AGIs over 200k)
Taxable interest for individuals: $1,836 (reported on 35.3% of returns)
This zip code:
$1,836
Virginia:
$1,600
(% of AGI for various income ranges: 1.5% for AGIs below $25k, 1.1% for AGIs $25k-50k, 1.0% for AGIs $50k-75k, 0.9% for AGIs $75k-100k, 1.1% for AGIs $100k-200k, 3.3% for AGIs over 200k)
Ordinary dividends: $4,095 (reported on 18.5% of returns)
Here:
$4,095
State:
$6,959
(% of AGI for various income ranges: 0.9% for AGIs below $25k, 1.1% for AGIs $25k-50k, 1.5% for AGIs $50k-75k, 1.5% for AGIs $75k-100k, 1.8% for AGIs $100k-200k, 2.2% for AGIs over 200k)
Net capital gain/loss in AGI: +$10,785 (reported on 11.3% of returns)
Here:
+$10,785
State:
+$16,672
(% of AGI for various income ranges: 0.9% for AGIs $75k-100k, 2.4% for AGIs $100k-200k, 16.6% for AGIs over 200k)
Profit/loss from business: +$6,470 (reported on 16.8% of returns)
Here:
+$6,470
State:
+$14,116
(% of AGI for various income ranges: 6.6% for AGIs below $25k, 1.7% for AGIs $25k-50k, 3.6% for AGIs $50k-75k, 0.3% for AGIs $75k-100k, 1.9% for AGIs $100k-200k)
Taxable individual retirement arrangement distribution: $15,712 (reported on 10.9% of returns)
22520:
$15,712
Virginia:
$16,667
(% of AGI for various income ranges: 2.7% for AGIs below $25k, 2.1% for AGIs $25k-50k, 3.0% for AGIs $50k-75k, 3.5% for AGIs $75k-100k, 6.0% for AGIs $100k-200k)
Total itemized deductions: $21,761 (25% of AGI, reported on 33.2% of returns)
Here:
$21,761
State:
$26,596
Here:
24.9% of AGI
State:
20.1% of AGI
(% of AGI for various income ranges: 9.3% for AGIs below $25k, 12.3% for AGIs $25k-50k, 14.0% for AGIs $50k-75k, 14.1% for AGIs $75k-100k, 18.0% for AGIs $100k-200k, 14.8% for AGIs over 200k)
Charity contributions: $3,800 (reported on 27.7% of returns)
Here:
$3,800
State:
$4,443
(% of AGI for various income ranges: 0.7% for AGIs below $25k, 1.4% for AGIs $25k-50k, 2.4% for AGIs $50k-75k, 1.8% for AGIs $75k-100k, 2.9% for AGIs $100k-200k, 2.6% for AGIs over 200k)
Taxes paid: $6,152 (reported on 33.2% of returns)
22520:
$6,152
State:
$9,951
(% of AGI for various income ranges: 1.0% for AGIs below $25k, 2.6% for AGIs $25k-50k, 3.1% for AGIs $50k-75k, 4.1% for AGIs $75k-100k, 5.9% for AGIs $100k-200k, 6.5% for AGIs over 200k)
Earned income credit: $2,363 (reported on 19.3% of returns)
Here:
$2,363
State:
$2,211
(% of AGI for various income ranges: 7.2% for AGIs below $25k, 1.0% for AGIs $25k-50k)
Percentage of individuals using paid preparers for their 2012 taxes: 55.9%
Here:
56%
State:
46%
(% for various income ranges: 56.4% for AGIs below $25k, 56.1% for AGIs $25k-50k, 57.6% for AGIs $50k-75k, 50.0% for AGIs $75k-100k, 54.2% for AGIs $100k-200k, 75.0% for AGIs over 200k)
Averages for the 2004 tax year for zip code 22520, filed in 2005:
Average Adjusted Gross Income (AGI) in 2004: $40,245 (Individual Income Tax Returns)
Here:
$40,245
State:
$56,704
Salary/wage: $34,053 (reported on 80.8% of returns)
Here:
$34,053
State:
$48,441
(% of AGI for various income ranges: 91.3% for AGIs below $10k, 73.9% for AGIs $10k-25k, 77.8% for AGIs $25k-50k, 70.3% for AGIs $50k-75k, 70.8% for AGIs $75k-100k, 54.1% for AGIs over 100k)
Taxable interest for individuals: $1,827 (reported on 44.7% of returns)
This zip code:
$1,827
Virginia:
$1,688
(% of AGI for various income ranges: 5.0% for AGIs below $10k, 2.5% for AGIs $10k-25k, 1.2% for AGIs $25k-50k, 1.5% for AGIs $50k-75k, 1.7% for AGIs $75k-100k, 2.9% for AGIs over 100k)
Taxable dividends: $2,661 (reported on 19.5% of returns)
Here:
$2,661
State:
$4,028
(% of AGI for various income ranges: 1.9% for AGIs below $10k, 1.4% for AGIs $10k-25k, 1.0% for AGIs $25k-50k, 1.0% for AGIs $50k-75k, 1.6% for AGIs $75k-100k, 1.5% for AGIs over 100k)
Net capital gain/loss: +$10,206 (reported on 14.2% of returns)
Here:
+$10,206
State:
+$14,375
(% of AGI for various income ranges: -0.5% for AGIs below $10k, 0.1% for AGIs $10k-25k, 0.7% for AGIs $25k-50k, 1.0% for AGIs $50k-75k, 2.0% for AGIs $75k-100k, 10.4% for AGIs over 100k)
Profit/loss from business: +$8,187 (reported on 16.6% of returns)
Here:
+$8,187
State:
+$13,342
(% of AGI for various income ranges: 1.2% for AGIs below $10k, 4.4% for AGIs $10k-25k, 2.4% for AGIs $25k-50k, 1.5% for AGIs $50k-75k, -1.3% for AGIs $75k-100k, 7.8% for AGIs over 100k)
IRA payment deduction: $3,086 (reported on 2.5% of returns)
22520:
$3,086
Virginia:
$2,943
Self-employed pension: $16,833 (reported on 0.5% of returns)
Here:
$16,833
Virginia:
$17,430
Total itemized deductions: $17,586 (24% of AGI, reported on 30.6% of returns)
Here:
$17,586
State:
$21,492
Here:
24.4% of AGI
State:
21.0% of AGI
(% of AGI for various income ranges: 10.8% for AGIs below $10k, 9.2% for AGIs $10k-25k, 12.0% for AGIs $25k-50k, 13.7% for AGIs $50k-75k, 14.6% for AGIs $75k-100k, 15.3% for AGIs over 100k)
Charity contributions deductions: $2,981 (4% of AGI, reported on 26.5% of returns)
Here:
$2,981
State:
$3,794
Here:
3.9% of AGI
State:
3.5% of AGI
(% of AGI for various income ranges: 1.1% for AGIs $10k-25k, 1.6% for AGIs $25k-50k, 2.2% for AGIs $50k-75k, 2.4% for AGIs $75k-100k, 2.3% for AGIs over 100k)
Total tax: $5,550 (reported on 72.9% of returns)
22520:
$5,550
State:
$9,537
(% of AGI for various income ranges: 3.6% for AGIs below $10k, 3.7% for AGIs $10k-25k, 6.5% for AGIs $25k-50k, 9.1% for AGIs $50k-75k, 11.0% for AGIs $75k-100k, 16.2% for AGIs over 100k)
Earned income credit: $1,822 (reported on 18.4% of returns)
Here:
$1,822
State:
$1,734
Percentage of individuals using paid preparers for their 2004 taxes: 59.0%
Here:
59%
State:
52%
(% for various income ranges: 52.8% for AGIs below $10k, 62.2% for AGIs $10k-25k, 60.5% for AGIs $25k-50k, 55.8% for AGIs $50k-75k, 61.1% for AGIs $75k-100k, 62.7% for AGIs over 100k)
Household received Food Stamps/SNAP in the past 12 months: 264 Household did not receive Food Stamps/SNAP in the past 12 months: 1,690
Women who had a birth in the past 12 months: 20 (5 now married, 14 unmarried) Women who did not have a birth in the past 12 months: 858 (470 now married, 384 unmarried)
Housing units in zip code 22520 with a mortgage: 802 (78 second mortgage, 36 both second mortgage and home equity loan) Houses without a mortgage: 5
Median monthly owner costs for units with a mortgage: $1,600 Median monthly owner costs for units without a mortgage: $464
Residents with income below the poverty level in 2022:
This zip code:
11.5%
Whole state:
10.6%
Residents with income below 50% of the poverty level in 2022:
This zip code:
2.8%
Whole state:
5.2%
Median number of rooms in houses and condos:
Here:
6.0
State:
7.0
Median number of rooms in apartments:
Here:
5.0
State:
4.3
Notable locations in this zip code not listed on our city pages
Notable locations in zip code 22520: Westmoreland County Montross Transfer Station (A), Beales Wharf (B), McGuires Wharf (C), Meadow Farm (D), Goodrich Farm (E), Deep Point Landing (F), Broadview (G), Morris Store (H), Muses Beach (I), Glebe Harbor (J), Baynesville Landing (K), Camp Hull Springs (L), Popes Creek Landing (M), Bushfield Golf Course (N), Montross Volunteer Rescue Squad Station 3 (O), Westmoreland Volunteer Rescue Squad (P), Knights Community Hall (Q), Westmoreland County Museum (R), Westmoreland County Courthouse (S), Northern Neck Historical Society Research Library (T). Display/hide their locations on the map
Churches in zip code 22520 include: Pope Creek Church (A), Providence Church (B), Saint James Church (C), Salem Church (D), Andrew Chapel United Methodist Church (E), Nomini Baptist Church (F), Nomini Church (G), Saint James Episcopal Church (H), Shiloh Church (I). Display/hide their locations on the map
Lakes, reservoirs, and swamps: Herring Pond (A), Bettys Pond (B), Stratford Millpond (C), Potomac Mills Pond (D), Weavers Millpond (E), Chandlers Millpond (F), Horners Pond (G), Omohundra Millpond (H). Display/hide their locations on the map
Streams, rivers, and creeks: Weatherall Creek (A), Waverly Branch (B), Ware Branch (C), Thomas Branch (D), The Big Swamp (E), Templeman Run (F), Tates Swamp (G), Springfield Branch (H), Smoots Mill Run (I). Display/hide their locations on the map
In group quarters: 6 (-1 institutionalized population)
Size of family households: 640 2-persons, 364 3-persons, 46 4-persons, 78 5-persons, 78 6-persons, 11 7-or-more-persons
Size of nonfamily households: 695 1-person, 36 2-persons
334 married couples with children.
233 single-parent households (129 men, 104 women).
96.8% of residents of 22520 zip code speak English at home.
2.6% of residents speak Spanish at home (10% very well, 90% well).
0.9% of residents speak other Indo-European language at home (2% very well, 98% well).
Foreign born population: 192 (4.1%) (99.0% of them are naturalized citizens)
This zip code:
4.1%
Whole state:
12.7%
42%Eritrea
19%Sweden
17%United Kingdom, excluding England and Scotland
16%Bhutan
5%Belgium
3%Serbia
1%Japan
14%English
10%Irish
7%American
4%Italian
4%Polish
3%European
2%Scotch-Irish
Year of entry for the foreign-born population
182010 or later
02000 to 2009
261990 to 1999
159Before 1990
Facilities with environmental interests located in this zip code:
CARRY ON TRAILER CORPORATION (159 INDUSTRIAL PK RD in MONTROSS, VA)
AIR SYNTHETIC MINOR (AIRS/AFS) STATE MASTER (Virginia pollutants databases) - CEDS-52063, AIR PROGRAM Large Quantity Generators, more that 1000 kg of hazardous waste/month (Resource Conservation and Recovery Act (tracking hazardous waste)) TRI REPORTER (Tracking of toxic chemicals releasing facilities) Business SIC classification: TRUCK TRAILERS Business NAICS classification: TRUCK TRAILER MANUFACTURING.; TRUCK TRAILER MANUFACTURING. Organizations: CARRY ON TRAILER CORP. (CONTACT/OPERATOR)
CHANDLER CHEV-POINT INC (ROUTE 3 in MONTROSS, VA)
Conditionally Exempt Small Quantity Generators, less than 100 kg/month of hazardous waste (Resource Conservation and Recovery Act (tracking hazardous waste)) Organizations: OPERNAME (CONTACT/OPERATOR)
Housing units lacking complete plumbing facilities: 5.1% Housing units lacking complete kitchen facilities: 5.4%
75.9%Electricity
13.2%Fuel oil, kerosene, etc.
4.5%Bottled, tank, or LP gas
4.4%Wood
1.6%Utility gas
Population in 1990: 4,836. Population change in the 1990s: +280 (+5.8%).
Place of birth for U.S.-born residents:
This state: 2,646
Northeast: 356
Midwest: 235
South: 960
West: 285
75% of the 22520 zip code residents lived in the same house 5 years ago. Out of people who lived in different houses, 47% lived in this county. Out of people who lived in different counties, 50% lived in Virginia.
96% of the 22520 zip code residents lived in the same house 1 year ago. Out of people who lived in different houses, 68% moved from this county. Out of people who lived in different houses, 24% moved from different county within same state. Out of people who lived in different houses, 11% moved from different state.
Private vs. public school enrollment:
Students in private schools in grades 1 to 8 (elementary and middle school): 49
Here:
14.1%
Virginia:
13.2%
Students in private schools in grades 9 to 12 (high school):
Here:
0.0%
Virginia:
10.2%
Students in private undergraduate colleges:
Here:
1.4%
Virginia:
18.7%
Occupation by median earnings in the past 12 months ($)
137,825Law enforcement workers including supervisors
91,386Computer and mathematical occupations
80,805Business and financial operations occupations
75,017Transportation occupations
67,731Building and grounds cleaning and maintenance occupations
65,987Production occupations
Companies with federal contracts located in this zip code (MONTROSS, VA):
NORTHERN NECK BUILDING SUPPLY (17144 KINGS HWY; small business) : $513,101 in 13 contractsfrom 2001 to 2006
Contracts for Lumber and Related Basic Wood Materials, Wallboard, Building Paper, and Thermal Insulation Materials, Plywood and Veneer, Pipe, Tube and Rigid Tubing by Navy, Army Signed by year:2000: $0; 2001: $23,214; 2002: $247,739; 2003: $17,628; 2004: $34,637; 2005: $34,637; 2006: $155,246.
Biggest contracts:
$242,242 with Navy for Lumber and Related Basic Wood Materials. Signed on 2002-04-26. Completion date: 2002-07-19.
$103,291 with Army for Lumber and Related Basic Wood Materials. Signed on 2006-06-05. Effective on 2006-05-31. Completion date: 2006-06-30.
$51,955 with Navy for Wallboard, Building Paper, and Thermal Insulation Materials. Signed on 2006-06-22. Completion date: 2006-09-20.
$34,637 with Navy for Lumber and Related Basic Wood Materials. Signed on 2005-08-30. Completion date: 2005-09-23.
REUBEN BURTON INC (645 N INDEPENDENT DR; small business) : $401,193 in 43 contractsfrom 2000 to 2006
Contracts for Lugs, Terminals, and Terminal Strips, Electrical Hardware and Supplies, Electrical Insulators and Insulating Materials by Defense Logistics Agency, Army, Air Force Signed by year:2000: $49,325; 2001: $25,200; 2002: $87,718; 2003: $0; 2004: $37,519; 2005: $159,994; 2006: $41,437.
Biggest contracts:
$53,480 with Defense Logistics Agency for Lugs, Terminals, and Terminal Strips. Signed on 2005-03-14. Completion date: 2005-07-12.
$49,325, same as above.Signed on 2000-05-08. Completion date: 2000-07-22.
$46,034 with Defense Logistics Agency for Electrical Hardware and Supplies. Signed on 2002-04-29. Completion date: 2002-07-28.
$37,426 with Defense Logistics Agency for Electrical Insulators and Insulating Materials. Signed on 2002-03-27. Completion date: 2002-06-25.
NORTHERN NECK COCA-COLA BOTTLI (15725 KINGS HWY; small business) : $72,892 in 6 contractsfrom 2004 to 2006
Contracts for Food Items For Resale, Non-Food Items For Resale by Defense Commissary Agency Signed by year:2000: $0; 2001: $0; 2002: $0; 2003: $0; 2004: $14,069; 2005: $42,293; 2006: $16,530.
Biggest contracts:
$19,579 with Defense Commissary Agency for Food Items For Resale. Signed on 2005-04-01. Completion date: 2005-08-31.
$16,530 with Defense Commissary Agency for Non-Food Items For Resale. Signed on 2006-01-01. Completion date: 2006-03-31.
$14,069 with Defense Commissary Agency for Food Items For Resale. Signed on 2004-10-01. Completion date: 2005-02-28.
$9,527 with Defense Commissary Agency for Non-Food Items For Resale. Signed on 2005-10-01. Completion date: 2005-12-31.
NORTHERN NECK LANDSCAPING, INC (119 HARRIS DRIVE; small business)
$11,734 with Navy for Landscaping/Groundskeeping Services. Signed on 2002-10-01. Completion date: 2002-12-05.
Top industries in this zip code by the number of employees in 2005:
Accommodation and Food Services: Full-Service Restaurants (10-19: 3)
Accommodation and Food Services: Limited-Service Restaurants (20-49: 1, 5-9: 1)
Other Services (except Public Administration): Religious Organizations (5-9: 3, 1-4: 8)
Educational Services: Elementary and Secondary Schools (20-49: 1)
Professional, Scientific, and Technical Services: Offices of Lawyers (5-9: 3, 1-4: 3)
People in group quarters in 2010:
3 people in nursing facilities/skilled-nursing facilities
People in group quarters in 2000:
23 people in nursing homes
Fatal accident statistics in 2012:
Fatal accident count: 2
Vehicles involved in fatal accidents: 2
Fatal accidents caused by drunken drivers: 0
Fatalities: 2
Persons involved in fatal accidents: 2
Pedestrians involved in fatal accidents: 0
Fatal accident statistics in 2011:
Fatal accident count: 1
Vehicles involved in fatal accidents: 2
Fatal accidents caused by drunken drivers: 1
Fatalities: 2
Persons involved in fatal accidents: 3
Pedestrians involved in fatal accidents: 0
2002 - 2018 National Fire Incident Reporting System (NFIRS) incidents
Based on the data from the years 2002 - 2018 the average number of fire incidents per year is 32. The highest number of fires - 58 took place in 2006, and the least - 3 in 2002. The data has a rising trend.
When looking into fire subcategories, the most reports belonged to: Structure Fires (42.4%), and Outside Fires (42.2%).
Fire incident types reported to NFIRS in Zip Code 22520

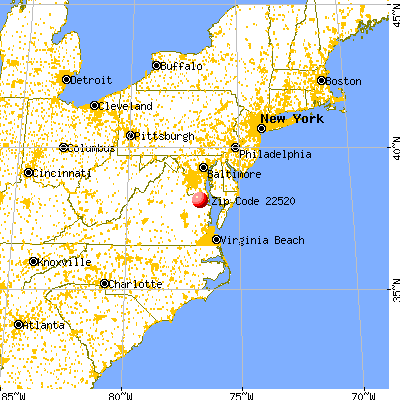


 Nearest zip codes: 20626, 20625, 20609, 20606, 22572, 22469.


 Based on the data from the years 2002 - 2018 the average number of fire incidents per year is 32. The highest number of fires - 58 took place in 2006, and the least - 3 in 2002. The data has a rising trend.
 When looking into fire subcategories, the most reports belonged to: Structure Fires (42.4%), and Outside Fires (42.2%).