Estimated zip code population in 2022: 1,869 Zip code population in 2010: 2,063 Zip code population in 2000: 2,315
Houses and condos: 1,813 Renter-occupied apartments: 31
% of renters here:
4%
State:
33%
March 2022 cost of living index in zip code 22539: 84.5 (less than average, U.S. average is 100)
Land area: 17.0 sq. mi. Water area: 5.5 sq. mi.
Population density: 110 people per square mile
(very low).
OSM Map
General Map
Google Map
MSN Map
OSM Map
General Map
Google Map
MSN Map
OSM Map
General Map
Google Map
MSN Map
OSM Map
General Map
Google Map
MSN Map
Please wait while loading the map...
Real estate property taxes paid for housing units in 2022:
This zip code:
0.6% ($2,274)
Virginia:
0.7% ($2,617)
Median real estate property taxes paid for housing units with mortgages in 2022: $2,417 (0.6%) Median real estate property taxes paid for housing units with no mortgage in 2022: $1,979 (0.5%)
Business Search- 14 Million verified businesses
Males: 967
(51.8%)
Females: 901
(48.2%)
For population 25 years and over in 22539:
High school or higher: 89.1%
Bachelor's degree or higher: 39.3%
Graduate or professional degree: 14.7%
Mean travel time to work (commute): 42.1 minutes
For population 15 years and over in 22539:
Never married: 15.2%
Now married: 66.3%
Separated: 1.9%
Widowed: 7.5%
Divorced: 9.1%
Zip code 22539 compared to state average:
Unemployed percentage significantly below state average.
Black race population percentage significantly below state average.
Hispanic race population percentage significantly below state average.
Median age significantly above state average.
Foreign-born population percentage significantly below state average.
Renting percentage significantly below state average.
Length of stay since moving in above state average.
Estimated median house/condo value in 2022: $403,368
22539:
$403,368
Virginia:
$365,700
According to our research of Virginia and other state lists, there were 7 registered sex offenders living in 22539 zip code as of June 16, 2024. The ratio of all residents to sex offenders in zip code 22539 is 321 to 1. The ratio of registered sex offenders to all residents in this zip code is near the state average.
Median resident age:
This zip code:
64.0 years
Virginia median age:
39.0 years
Average household size:
This zip code:
2.1 people
Virginia:
2.5 people
Averages for the 2020 tax year for zip code 22539, filed in 2021:
Average Adjusted Gross Income (AGI) in 2020: $85,045 (Individual Income Tax Returns)
Here:
$85,045
State:
$86,446
Salary/wage: $55,997 (reported on 63.4% of returns)
Here:
$55,997
State:
$71,185
(% of AGI for various income ranges: 1031.0% for AGIs below $25k, 3067.9% for AGIs $25k-50k, 5593.8% for AGIs $50k-75k, 5448.8% for AGIs $75k-100k, 9066.2% for AGIs $100k-200k)
Taxable interest for individuals: $1,942 (reported on 50.9% of returns)
This zip code:
$1,942
Virginia:
$1,805
(% of AGI for various income ranges: 27.0% for AGIs below $25k, 77.9% for AGIs $25k-50k, 180.0% for AGIs $50k-75k, 140.0% for AGIs $75k-100k, 280.8% for AGIs $100k-200k)
Ordinary dividends: $7,965 (reported on 35.7% of returns)
Here:
$7,965
State:
$8,327
(% of AGI for various income ranges: 79.0% for AGIs below $25k, 149.3% for AGIs $25k-50k, 355.0% for AGIs $50k-75k, 363.8% for AGIs $75k-100k, 1068.5% for AGIs $100k-200k)
Net capital gain/loss in AGI: +$12,576 (reported on 30.4% of returns)
Here:
+$12,576
State:
+$24,644
(% of AGI for various income ranges: 1.5% for AGIs below $25k, 27.1% for AGIs $25k-50k, 315.0% for AGIs $50k-75k, 410.0% for AGIs $75k-100k, 1251.5% for AGIs $100k-200k)
Profit/loss from business: +$15,637 (reported on 17.0% of returns)
Here:
+$15,637
State:
+$12,836
(% of AGI for various income ranges: 133.5% for AGIs below $25k, 310.7% for AGIs $25k-50k, 140.0% for AGIs $50k-75k, 531.2% for AGIs $75k-100k, 573.1% for AGIs $100k-200k)
Taxable individual retirement arrangement distribution: $27,154 (reported on 21.4% of returns)
22539:
$27,154
Virginia:
$21,535
(% of AGI for various income ranges: 135.5% for AGIs below $25k, 373.6% for AGIs $25k-50k, 985.0% for AGIs $50k-75k, 916.2% for AGIs $75k-100k, 2288.5% for AGIs $100k-200k)
Total itemized deductions: $35,107 (reported on 12.5% of returns)
Here:
$35,107
State:
$33,287
(% of AGI for various income ranges: 597.1% for AGIs $25k-50k, 1087.5% for AGIs $75k-100k, 1420.0% for AGIs $100k-200k)
Charity contributions: $7,831 (reported on 11.6% of returns)
Here:
$7,831
State:
$10,381
(% of AGI for various income ranges: 100.0% for AGIs $25k-50k, 248.7% for AGIs $75k-100k, 231.5% for AGIs $100k-200k)
Taxes paid: $7,779 (reported on 12.5% of returns)
22539:
$7,779
State:
$8,284
(% of AGI for various income ranges: 99.3% for AGIs $25k-50k, 181.2% for AGIs $75k-100k, 333.1% for AGIs $100k-200k)
Earned income credit: $1,992 (reported on 10.7% of returns)
Here:
$1,992
State:
$2,214
(% of AGI for various income ranges: 80.5% for AGIs below $25k, 55.7% for AGIs $25k-50k)
Percentage of individuals using paid preparers for their 2020 taxes: 88.4%
Here:
88%
State:
92%
(% for various income ranges: 84.8% for AGIs below $25k, 90.5% for AGIs $25k-50k, 92.9% for AGIs $50k-75k, 92.3% for AGIs $75k-100k, 87.0% for AGIs $100k-200k, 87.5% for AGIs over 200k)
Averages for the 2012 tax year for zip code 22539, filed in 2013:
Average Adjusted Gross Income (AGI) in 2012: $69,094 (Individual Income Tax Returns)
Here:
$69,094
State:
$71,192
Salary/wage: $41,156 (reported on 62.4% of returns)
Here:
$41,156
State:
$59,229
(% of AGI for various income ranges: 60.4% for AGIs below $25k, 55.2% for AGIs $25k-50k, 41.6% for AGIs $50k-75k, 29.9% for AGIs $75k-100k, 37.6% for AGIs $100k-200k, 26.1% for AGIs over 200k)
Taxable interest for individuals: $3,498 (reported on 57.4% of returns)
This zip code:
$3,498
Virginia:
$1,600
(% of AGI for various income ranges: 3.5% for AGIs below $25k, 1.7% for AGIs $25k-50k, 2.0% for AGIs $50k-75k, 1.9% for AGIs $75k-100k, 2.0% for AGIs $100k-200k, 5.3% for AGIs over 200k)
Ordinary dividends: $10,508 (reported on 38.6% of returns)
Here:
$10,508
State:
$6,959
(% of AGI for various income ranges: 4.5% for AGIs below $25k, 2.4% for AGIs $25k-50k, 3.5% for AGIs $50k-75k, 6.0% for AGIs $75k-100k, 4.3% for AGIs $100k-200k, 10.3% for AGIs over 200k)
Net capital gain/loss in AGI: +$10,143 (reported on 27.7% of returns)
Here:
+$10,143
State:
+$16,672
(% of AGI for various income ranges: 0.4% for AGIs $25k-50k, 0.7% for AGIs $50k-75k, 3.0% for AGIs $75k-100k, 2.1% for AGIs $100k-200k, 10.9% for AGIs over 200k)
Profit/loss from business: +$21,067 (reported on 17.8% of returns)
Here:
+$21,067
State:
+$14,116
(% of AGI for various income ranges: 8.6% for AGIs below $25k, 2.3% for AGIs $25k-50k, 2.6% for AGIs $50k-75k, 3.5% for AGIs $75k-100k, 12.9% for AGIs $100k-200k)
Taxable individual retirement arrangement distribution: $17,477 (reported on 25.7% of returns)
22539:
$17,477
Virginia:
$16,667
(% of AGI for various income ranges: 6.7% for AGIs below $25k, 6.8% for AGIs $25k-50k, 7.9% for AGIs $50k-75k, 7.5% for AGIs $75k-100k, 11.1% for AGIs $100k-200k)
Total itemized deductions: $23,765 (21% of AGI, reported on 42.6% of returns)
Here:
$23,765
State:
$26,596
Here:
20.8% of AGI
State:
20.1% of AGI
(% of AGI for various income ranges: 22.4% for AGIs below $25k, 19.1% for AGIs $25k-50k, 13.0% for AGIs $50k-75k, 13.8% for AGIs $75k-100k, 16.0% for AGIs $100k-200k, 10.8% for AGIs over 200k)
Charity contributions: $3,589 (reported on 37.6% of returns)
Here:
$3,589
State:
$4,443
(% of AGI for various income ranges: 2.0% for AGIs below $25k, 2.2% for AGIs $25k-50k, 2.0% for AGIs $50k-75k, 2.2% for AGIs $75k-100k, 2.3% for AGIs $100k-200k, 1.3% for AGIs over 200k)
Taxes paid: $7,837 (reported on 42.6% of returns)
22539:
$7,837
State:
$9,951
(% of AGI for various income ranges: 3.6% for AGIs below $25k, 4.0% for AGIs $25k-50k, 3.0% for AGIs $50k-75k, 4.3% for AGIs $75k-100k, 5.8% for AGIs $100k-200k, 5.6% for AGIs over 200k)
Earned income credit: $2,393 (reported on 13.9% of returns)
Here:
$2,393
State:
$2,211
(% of AGI for various income ranges: 6.2% for AGIs below $25k, 0.9% for AGIs $25k-50k)
Percentage of individuals using paid preparers for their 2012 taxes: 59.4%
Here:
59%
State:
46%
(% for various income ranges: 60.0% for AGIs below $25k, 55.0% for AGIs $25k-50k, 60.0% for AGIs $50k-75k, 58.3% for AGIs $75k-100k, 60.0% for AGIs $100k-200k, 75.0% for AGIs over 200k)
Averages for the 2004 tax year for zip code 22539, filed in 2005:
Average Adjusted Gross Income (AGI) in 2004: $53,227 (Individual Income Tax Returns)
Here:
$53,227
State:
$56,704
Salary/wage: $33,281 (reported on 64.3% of returns)
Here:
$33,281
State:
$48,441
(% of AGI for various income ranges: 78.7% for AGIs below $10k, 61.9% for AGIs $10k-25k, 49.6% for AGIs $25k-50k, 39.4% for AGIs $50k-75k, 35.7% for AGIs $75k-100k, 33.6% for AGIs over 100k)
Taxable interest for individuals: $3,147 (reported on 63.1% of returns)
This zip code:
$3,147
Virginia:
$1,688
(% of AGI for various income ranges: 9.5% for AGIs below $10k, 6.5% for AGIs $10k-25k, 4.7% for AGIs $25k-50k, 4.0% for AGIs $50k-75k, 4.8% for AGIs $75k-100k, 2.3% for AGIs over 100k)
Taxable dividends: $6,192 (reported on 42.4% of returns)
Here:
$6,192
State:
$4,028
(% of AGI for various income ranges: 5.6% for AGIs below $10k, 4.6% for AGIs $10k-25k, 3.9% for AGIs $25k-50k, 3.8% for AGIs $50k-75k, 5.1% for AGIs $75k-100k, 5.7% for AGIs over 100k)
Net capital gain/loss: +$14,301 (reported on 36.6% of returns)
Here:
+$14,301
State:
+$14,375
(% of AGI for various income ranges: -4.3% for AGIs below $10k, 3.1% for AGIs $10k-25k, 1.3% for AGIs $25k-50k, 5.7% for AGIs $50k-75k, 7.4% for AGIs $75k-100k, 16.8% for AGIs over 100k)
Profit/loss from business: +$6,564 (reported on 19.2% of returns)
Here:
+$6,564
State:
+$13,342
(% of AGI for various income ranges: 13.8% for AGIs below $10k, 3.0% for AGIs $10k-25k, 2.3% for AGIs $25k-50k, 2.7% for AGIs $50k-75k, 3.8% for AGIs $75k-100k, 1.3% for AGIs over 100k)
IRA payment deduction: $3,804 (reported on 4.7% of returns)
22539:
$3,804
Virginia:
$2,943
Total itemized deductions: $19,765 (20% of AGI, reported on 34.8% of returns)
Here:
$19,765
State:
$21,492
Here:
20.4% of AGI
State:
21.0% of AGI
(% of AGI for various income ranges: 14.9% for AGIs $10k-25k, 14.9% for AGIs $25k-50k, 11.5% for AGIs $50k-75k, 14.5% for AGIs $75k-100k, 12.3% for AGIs over 100k)
Charity contributions deductions: $3,169 (3% of AGI, reported on 30.7% of returns)
Here:
$3,169
State:
$3,794
Here:
3.2% of AGI
State:
3.5% of AGI
(% of AGI for various income ranges: 1.0% for AGIs $10k-25k, 2.4% for AGIs $25k-50k, 2.2% for AGIs $50k-75k, 2.5% for AGIs $75k-100k, 1.5% for AGIs over 100k)
Total tax: $8,610 (reported on 77.4% of returns)
22539:
$8,610
State:
$9,537
(% of AGI for various income ranges: 3.8% for AGIs below $10k, 3.7% for AGIs $10k-25k, 6.5% for AGIs $25k-50k, 8.9% for AGIs $50k-75k, 10.9% for AGIs $75k-100k, 18.3% for AGIs over 100k)
Earned income credit: $1,763 (reported on 13.8% of returns)
Here:
$1,763
State:
$1,734
Percentage of individuals using paid preparers for their 2004 taxes: 63.9%
Here:
64%
State:
52%
(% for various income ranges: 60.9% for AGIs below $10k, 64.2% for AGIs $10k-25k, 60.8% for AGIs $25k-50k, 60.3% for AGIs $50k-75k, 70.2% for AGIs $75k-100k, 74.1% for AGIs over 100k)
Household received Food Stamps/SNAP in the past 12 months: 106 Household did not receive Food Stamps/SNAP in the past 12 months: 785
Women who did not have a birth in the past 12 months: 229 (84 now married, 145 unmarried)
Housing units in zip code 22539 with a mortgage: 521 (16 second mortgage, 15 both second mortgage and home equity loan) Median monthly owner costs for units with a mortgage: $1,582 Median monthly owner costs for units without a mortgage: $495
Residents with income below the poverty level in 2022:
This zip code:
2.8%
Whole state:
10.6%
Residents with income below 50% of the poverty level in 2022:
This zip code:
1.5%
Whole state:
5.2%
Median number of rooms in houses and condos:
Here:
7.0
State:
7.0
Notable locations in this zip code not listed on our city pages
Notable locations in zip code 22539: Northumberland Volunteer Rescue Squad Station 1 (A), Smith Point Sea Rescue 1 (B), Northumberland County Rescue Squad (C), Fairfields Volunteer Fire Department (D). Display/hide their locations on the map
Churches in zip code 22539 include: Tibitha Church of God (A), Bethany Church (B), Saint Marys Church (C), Shiloh Church (D). Display/hide their locations on the map
Creeks: Willis Creek (A), Whays Creek (B), Warehouse Creek (C), Slough Creek (D), Sloop Creek (E), Sharps Creek (F), Reason Creek (G), Cod Creek (H), Cockrell Creek (I). Display/hide their locations on the map
Size of family households: 406 2-persons, 82 3-persons, 34 4-persons, 29 5-persons
Size of nonfamily households: 328 1-person, 9 2-persons
165 married couples with children.
0 single-parent households ().
99.7% of residents of 22539 zip code speak English at home.
1.3% of residents speak other Indo-European language at home (100% very well).
Foreign born population: 11 (0.6%) (100.0% of them are naturalized citizens)
This zip code:
0.6%
Whole state:
12.7%
118%Ukraine
25%American
18%German
12%English
8%Scottish
7%European
6%Irish
3%French
Year of entry for the foreign-born population
02010 or later
02000 to 2009
01990 to 1999
10Before 1990
Facilities with environmental interests located in this zip code:
CHESAPEAKE BAY FISHING CO LC (140 MCNEAL RD in REEDVILLE, VA)
TRI REPORTER (Tracking of toxic chemicals releasing facilities) Business SIC classification: ANIMAL AND MARINE FATS AND OILS Alternative names: AMPRO FISHERIES CO., A DIV. OF AMERICAN PROTEINS
Housing units lacking complete plumbing facilities: 4.6% Housing units lacking complete kitchen facilities: 5.3%
78.4%Electricity
12.7%Fuel oil, kerosene, etc.
7.9%Bottled, tank, or LP gas
1.2%Utility gas
Population in 1990: 2,037. Population change in the 1990s: +278 (+13.6%).
Place of birth for U.S.-born residents:
This state: 671
Northeast: 340
Midwest: 118
South: 628
West: 102
61% of the 22539 zip code residents lived in the same house 5 years ago. Out of people who lived in different houses, 55% lived in this county. Out of people who lived in different counties, 50% lived in Virginia.
82% of the 22539 zip code residents lived in the same house 1 year ago. Out of people who lived in different houses, 19% moved from this county. Out of people who lived in different houses, 61% moved from different county within same state. Out of people who lived in different houses, 20% moved from different state.
Private vs. public school enrollment:
Students in private schools in grades 1 to 8 (elementary and middle school):
Here:
0.0%
Virginia:
13.2%
Students in private schools in grades 9 to 12 (high school):
Here:
0.0%
Virginia:
10.2%
Students in private undergraduate colleges:
Here:
0.0%
Virginia:
18.7%
Companies with federal contracts located in this zip code:
DOD CONTRACTING SERVICES (235 PELICAN LN in REEDVILLE, VA; small business)
$19,000 with Navy for Restoration. Signed on 2005-09-21. Completion date: 2005-10-07.
Top industries in this zip code by the number of employees in 2005:
Construction: New Single-Family Housing Construction (except Operative Builders) (10-19 employees: 1 establishment, 5-9 employees: 3 establishments, 1-4 employees: 1 establishment)
Wholesale Trade: Other Grocery and Related Products Merchant Wholesalers (20-49: 1)
Other Services (except Public Administration): Religious Organizations (5-9: 1, 1-4: 3)
Arts, Entertainment, and Recreation: Marinas (5-9: 1, 1-4: 1)
Fatal accident statistics in 2011:
Fatal accident count: 1
Vehicles involved in fatal accidents: 1
Fatal accidents caused by drunken drivers: 0
Fatalities: 1
Persons involved in fatal accidents: 1
Pedestrians involved in fatal accidents: 1
Fatal accident statistics in 2010:
Fatal accident count: 1
Vehicles involved in fatal accidents: 1
Fatal accidents caused by drunken drivers: 0
Fatalities: 1
Persons involved in fatal accidents: 1
Pedestrians involved in fatal accidents: 0
2002 - 2018 National Fire Incident Reporting System (NFIRS) incidents
According to the data from the years 2002 - 2018 the average number of fire incidents per year is 7. The highest number of fire incidents - 36 took place in 2007, and the least - 0 in 2003. The data has an increasing trend.
When looking into fire subcategories, the most reports belonged to: Outside Fires (45.8%), and Structure Fires (39.8%).
Fire incident types reported to NFIRS in Zip Code 22539

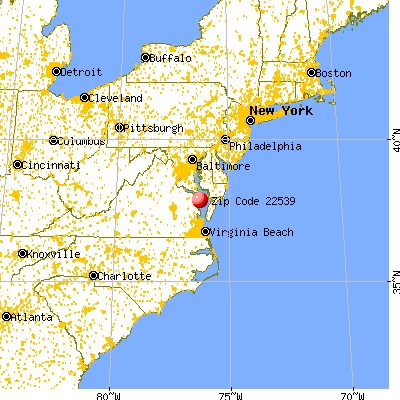


 Nearest zip codes: 22530, 22432, 22579, 22473, 22482, 20687.


 According to the data from the years 2002 - 2018 the average number of fire incidents per year is 7. The highest number of fire incidents - 36 took place in 2007, and the least - 0 in 2003. The data has an increasing trend.
 When looking into fire subcategories, the most reports belonged to: Outside Fires (45.8%), and Structure Fires (39.8%).