Estimated zip code population in 2022: 1,941 Zip code population in 2010: 1,950 Zip code population in 2000: 1,606
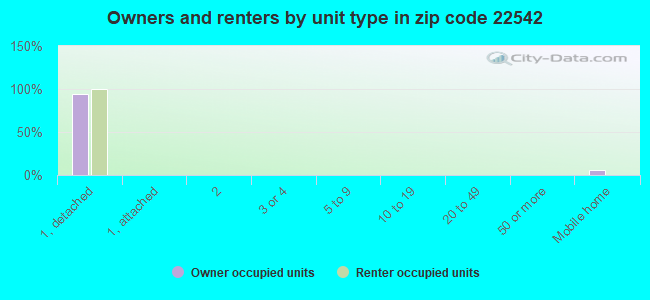
Houses and condos: 835 Renter-occupied apartments: 75
% of renters here:
9%
State:
33%
March 2022 cost of living index in zip code 22542: 83.6 (less than average, U.S. average is 100)
Land area: 20.7 sq. mi. Water area: 0.1 sq. mi.
Population density: 94 people per square mile
(very low).
OSM Map
General Map
Google Map
MSN Map
OSM Map
General Map
Google Map
MSN Map
OSM Map
General Map
Google Map
MSN Map
OSM Map
General Map
Google Map
MSN Map
Please wait while loading the map...
Real estate property taxes paid for housing units in 2022:
This zip code:
0.6% ($2,132)
Virginia:
0.7% ($2,617)
Median real estate property taxes paid for housing units with mortgages in 2022: $2,315 (0.6%) Median real estate property taxes paid for housing units with no mortgage in 2022: $1,237 (0.8%)
Business Search- 14 Million verified businesses
Males: 1,064
(54.8%)
Females: 876
(45.2%)
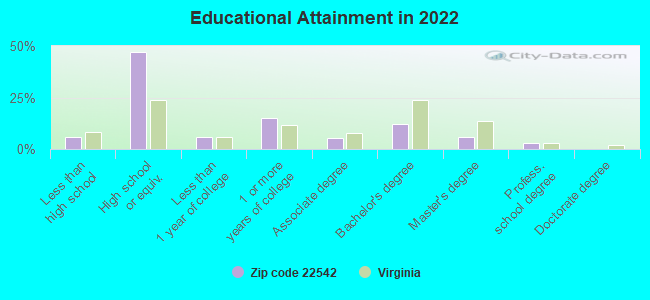
For population 25 years and over in 22542:
High school or higher: 92.8%
Bachelor's degree or higher: 20.6%
Graduate or professional degree: 8.7%
Unemployed: 6.5%
Mean travel time to work (commute): 42.3 minutes
For population 15 years and over in 22542:
Never married: 20.9%
Now married: 63.6%
Separated: 3.3%
Widowed: 6.3%
Divorced: 5.8%
Zip code 22542 compared to state average:
Unemployed percentage above state average.
Black race population percentage significantly below state average.
Hispanic race population percentage significantly below state average.
Median age significantly above state average.
Foreign-born population percentage significantly below state average.
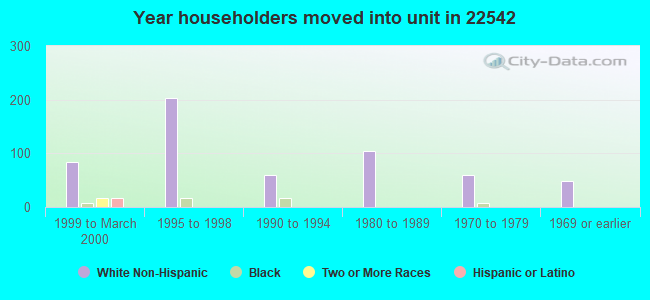
Renting percentage significantly below state average.
Length of stay since moving in significantly above state average.
Percentage of population with a bachelor's degree or higher below state average.
Averages for the 2020 tax year for zip code 22542, filed in 2021:
Average Adjusted Gross Income (AGI) in 2020: $61,819 (Individual Income Tax Returns)
Here:
$61,819
State:
$86,446
Salary/wage: $55,491 (reported on 85.4% of returns)
Here:
$55,491
State:
$71,185
(% of AGI for various income ranges: 1180.5% for AGIs below $25k, 3513.5% for AGIs $25k-50k, 6894.2% for AGIs $50k-75k, 9237.1% for AGIs $75k-100k, 18080.0% for AGIs $100k-200k)
Taxable interest for individuals: $608 (reported on 24.3% of returns)
This zip code:
$608
Virginia:
$1,805
(% of AGI for various income ranges: 5.7% for AGIs below $25k, 7.0% for AGIs $25k-50k, 24.2% for AGIs $50k-75k, 8.6% for AGIs $75k-100k, 80.9% for AGIs $100k-200k)
Ordinary dividends: $1,223 (reported on 12.6% of returns)
Here:
$1,223
State:
$8,327
(% of AGI for various income ranges: 14.8% for AGIs $25k-50k, 25.0% for AGIs $50k-75k, 86.4% for AGIs $100k-200k)
Net capital gain/loss in AGI: +$11,290 (reported on 9.7% of returns)
Here:
+$11,290
State:
+$24,644
(% of AGI for various income ranges: 8.7% for AGIs $25k-50k, 1008.2% for AGIs $100k-200k)
Profit/loss from business: +$8,411 (reported on 17.5% of returns)
Here:
+$8,411
State:
+$12,836
(% of AGI for various income ranges: 117.1% for AGIs below $25k, 161.3% for AGIs $25k-50k, 121.7% for AGIs $50k-75k, 682.7% for AGIs $100k-200k)
Taxable individual retirement arrangement distribution: $12,388 (reported on 7.8% of returns)
22542:
$12,388
Virginia:
$21,535
(% of AGI for various income ranges: 85.2% for AGIs below $25k, 210.8% for AGIs $50k-75k, 508.2% for AGIs $100k-200k)
Total itemized deductions: $34,400 (reported on 7.8% of returns)
Here:
$34,400
State:
$33,287
(% of AGI for various income ranges: 987.5% for AGIs $50k-75k, 1424.5% for AGIs $100k-200k)
Charity contributions: $8,083 (reported on 5.8% of returns)
Here:
$8,083
State:
$10,381
(% of AGI for various income ranges: 205.8% for AGIs $50k-75k, 216.4% for AGIs $100k-200k)
Taxes paid: $7,600 (reported on 7.8% of returns)
22542:
$7,600
State:
$8,284
(% of AGI for various income ranges: 196.7% for AGIs $50k-75k, 338.2% for AGIs $100k-200k)
Earned income credit: $2,173 (reported on 14.6% of returns)
Here:
$2,173
State:
$2,214
(% of AGI for various income ranges: 77.6% for AGIs below $25k, 70.9% for AGIs $25k-50k)
Percentage of individuals using paid preparers for their 2020 taxes: 90.3%
Here:
90%
State:
92%
(% for various income ranges: 89.7% for AGIs below $25k, 92.6% for AGIs $25k-50k, 88.2% for AGIs $50k-75k, 88.9% for AGIs $75k-100k, 89.5% for AGIs $100k-200k, 100.0% for AGIs over 200k)
Averages for the 2012 tax year for zip code 22542, filed in 2013:
Average Adjusted Gross Income (AGI) in 2012: $50,026 (Individual Income Tax Returns)
Here:
$50,026
State:
$71,192
Salary/wage: $45,168 (reported on 87.2% of returns)
Here:
$45,168
State:
$59,229
(% of AGI for various income ranges: 79.9% for AGIs below $25k, 78.1% for AGIs $25k-50k, 72.8% for AGIs $50k-75k, 84.9% for AGIs $75k-100k, 77.9% for AGIs $100k-200k)
Taxable interest for individuals: $630 (reported on 26.7% of returns)
This zip code:
$630
Virginia:
$1,600
(% of AGI for various income ranges: 0.3% for AGIs below $25k, 0.3% for AGIs $25k-50k, 0.8% for AGIs $50k-75k, 0.2% for AGIs $75k-100k, 0.2% for AGIs $100k-200k)
Ordinary dividends: $717 (reported on 14.0% of returns)
Here:
$717
State:
$6,959
(% of AGI for various income ranges: 0.5% for AGIs below $25k, 0.2% for AGIs $25k-50k, 0.2% for AGIs $50k-75k, 0.3% for AGIs $100k-200k)
Net capital gain/loss in AGI: +$4,467 (reported on 7.0% of returns)
Here:
+$4,467
State:
+$16,672
Profit/loss from business: +$6,577 (reported on 15.1% of returns)
Here:
+$6,577
State:
+$14,116
(% of AGI for various income ranges: 7.1% for AGIs below $25k, 4.0% for AGIs $25k-50k, 1.4% for AGIs $50k-75k, 1.8% for AGIs $75k-100k)
Taxable individual retirement arrangement distribution: $8,100 (reported on 5.8% of returns)
22542:
$8,100
Virginia:
$16,667
Total itemized deductions: $19,923 (26% of AGI, reported on 40.7% of returns)
Here:
$19,923
State:
$26,596
Here:
25.6% of AGI
State:
20.1% of AGI
(% of AGI for various income ranges: 10.6% for AGIs below $25k, 12.0% for AGIs $25k-50k, 17.7% for AGIs $50k-75k, 18.0% for AGIs $75k-100k, 18.0% for AGIs $100k-200k)
Charity contributions: $2,652 (reported on 29.1% of returns)
Here:
$2,652
State:
$4,443
(% of AGI for various income ranges: 0.6% for AGIs below $25k, 0.7% for AGIs $25k-50k, 1.7% for AGIs $50k-75k, 2.1% for AGIs $75k-100k, 1.8% for AGIs $100k-200k)
Taxes paid: $6,077 (reported on 40.7% of returns)
22542:
$6,077
State:
$9,951
(% of AGI for various income ranges: 1.6% for AGIs below $25k, 2.8% for AGIs $25k-50k, 4.5% for AGIs $50k-75k, 6.0% for AGIs $75k-100k, 6.5% for AGIs $100k-200k)
Earned income credit: $2,033 (reported on 17.4% of returns)
Here:
$2,033
State:
$2,211
(% of AGI for various income ranges: 6.4% for AGIs below $25k, 0.8% for AGIs $25k-50k)
Percentage of individuals using paid preparers for their 2012 taxes: 45.3%
Here:
45%
State:
46%
(% for various income ranges: 41.9% for AGIs below $25k, 42.9% for AGIs $25k-50k, 53.8% for AGIs $50k-75k, 45.5% for AGIs $75k-100k, 50.0% for AGIs $100k-200k)
Averages for the 2004 tax year for zip code 22542, filed in 2005:
Average Adjusted Gross Income (AGI) in 2004: $45,251 (Individual Income Tax Returns)
Here:
$45,251
State:
$56,704
Salary/wage: $40,295 (reported on 85.5% of returns)
Here:
$40,295
State:
$48,441
(% of AGI for various income ranges: 99.8% for AGIs below $10k, 76.1% for AGIs $10k-25k, 83.6% for AGIs $25k-50k, 79.0% for AGIs $50k-75k, 82.9% for AGIs $75k-100k, 61.2% for AGIs over 100k)
Taxable interest for individuals: $1,432 (reported on 35.6% of returns)
This zip code:
$1,432
Virginia:
$1,688
(% of AGI for various income ranges: 1.6% for AGIs below $10k, 1.3% for AGIs $10k-25k, 0.5% for AGIs $25k-50k, 1.2% for AGIs $50k-75k, 0.4% for AGIs $75k-100k, 2.0% for AGIs over 100k)
Taxable dividends: $805 (reported on 15.1% of returns)
Here:
$805
State:
$4,028
(% of AGI for various income ranges: 0.4% for AGIs $10k-25k, 0.2% for AGIs $25k-50k, 0.3% for AGIs $50k-75k, 0.2% for AGIs $75k-100k, 0.3% for AGIs over 100k)
Net capital gain/loss: +$13,010 (reported on 12.9% of returns)
Here:
+$13,010
State:
+$14,375
(% of AGI for various income ranges: 1.4% for AGIs $10k-25k, -0.1% for AGIs $25k-50k, 0.6% for AGIs $50k-75k, 0.9% for AGIs $75k-100k, 13.0% for AGIs over 100k)
Profit/loss from business: +$8,075 (reported on 15.4% of returns)
Here:
+$8,075
State:
+$13,342
(% of AGI for various income ranges: 5.3% for AGIs below $10k, 11.1% for AGIs $10k-25k, 2.3% for AGIs $25k-50k, 4.0% for AGIs $50k-75k, 0.8% for AGIs $75k-100k)
Total itemized deductions: $17,025 (24% of AGI, reported on 41.6% of returns)
Here:
$17,025
State:
$21,492
Here:
24.0% of AGI
State:
21.0% of AGI
(% of AGI for various income ranges: 12.7% for AGIs $10k-25k, 17.6% for AGIs $25k-50k, 15.3% for AGIs $50k-75k, 18.5% for AGIs $75k-100k, 14.3% for AGIs over 100k)
Charity contributions deductions: $2,279 (3% of AGI, reported on 33.9% of returns)
Here:
$2,279
State:
$3,794
Here:
3.0% of AGI
State:
3.5% of AGI
(% of AGI for various income ranges: 1.0% for AGIs $10k-25k, 1.8% for AGIs $25k-50k, 1.7% for AGIs $50k-75k, 1.7% for AGIs $75k-100k, 2.0% for AGIs over 100k)
Total tax: $5,705 (reported on 78.2% of returns)
22542:
$5,705
State:
$9,537
(% of AGI for various income ranges: 3.7% for AGIs below $10k, 4.7% for AGIs $10k-25k, 6.5% for AGIs $25k-50k, 9.0% for AGIs $50k-75k, 9.9% for AGIs $75k-100k, 15.6% for AGIs over 100k)
Earned income credit: $1,872 (reported on 14.0% of returns)
Here:
$1,872
State:
$1,734
Percentage of individuals using paid preparers for their 2004 taxes: 54.2%
Here:
54%
State:
52%
(% for various income ranges: 42.7% for AGIs below $10k, 57.4% for AGIs $10k-25k, 60.4% for AGIs $25k-50k, 49.3% for AGIs $50k-75k, 56.0% for AGIs $75k-100k, 55.2% for AGIs over 100k)
Likely homosexual households (counted as self-reported same-sex unmarried-partner households)
Lesbian couples: 0.0% of all households
Gay men: 1.6% of all households
Household received Food Stamps/SNAP in the past 12 months: 80 Household did not receive Food Stamps/SNAP in the past 12 months: 750
Women who had a birth in the past 12 months: 13 (14 now married, 0 unmarried) Women who did not have a birth in the past 12 months: 274 (170 now married, 101 unmarried)
Housing units in zip code 22542 with a mortgage: 576 (65 second mortgage, 29 both second mortgage and home equity loan) Median monthly owner costs for units with a mortgage: $1,797 Median monthly owner costs for units without a mortgage: $524
Residents with income below the poverty level in 2022:
This zip code:
5.4%
Whole state:
10.6%
Residents with income below 50% of the poverty level in 2022:
This zip code:
0.6%
Whole state:
5.2%
Median number of rooms in houses and condos:
Here:
5.7
State:
7.0
Median number of rooms in apartments:
Here:
9.8
State:
4.3
Notable locations in this zip code not listed on our city pages
Size of family households: 265 2-persons, 137 3-persons, 47 4-persons, 65 5-persons, 36 6-persons
Size of nonfamily households: 230 1-person, 49 2-persons
120 married couples with children.
0 single-parent households ().
99.1% of residents of 22542 zip code speak English at home.
0.7% of residents speak Spanish at home (100% not well).
Foreign born population: 0 (0.0%)
:
0.0%
Whole state:
12.7%
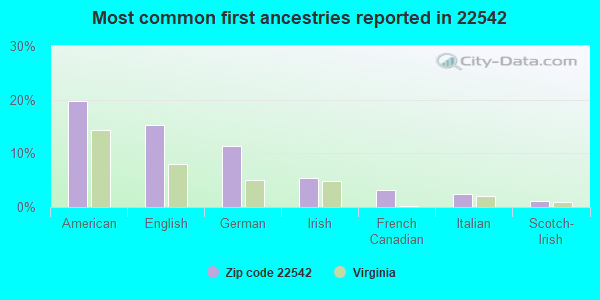
20%American
15%English
11%German
5%Irish
3%French Canadian
2%Italian
1%Scotch-Irish
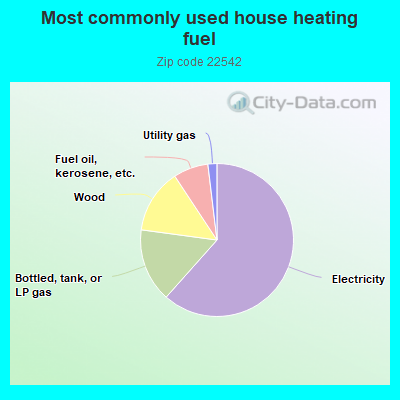
61.7%Electricity
15.6%Bottled, tank, or LP gas
13.6%Wood
7.4%Fuel oil, kerosene, etc.
1.9%Utility gas
Population in 1990: 1,072. Population change in the 1990s: +534 (+49.8%).
Place of birth for U.S.-born residents:
This state: 1,241
Northeast: 81
Midwest: 94
South: 433
West: 83
52% of the 22542 zip code residents lived in the same house 5 years ago. Out of people who lived in different houses, 29% lived in this county. Out of people who lived in different counties, 50% lived in Virginia.
97% of the 22542 zip code residents lived in the same house 1 year ago. Out of people who lived in different houses, 120% moved from different county within same state.
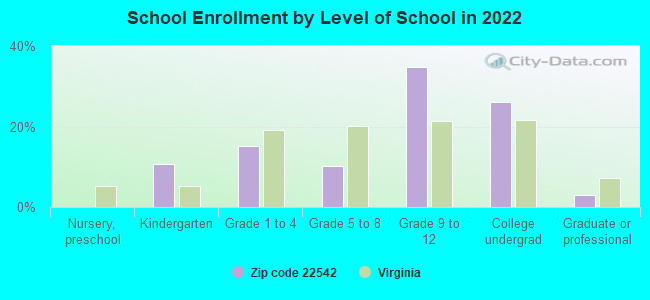
Private vs. public school enrollment:
Students in private schools in grades 1 to 8 (elementary and middle school): 17
Here:
24.9%
Virginia:
13.2%
Students in private schools in grades 9 to 12 (high school): 50
Here:
54.9%
Virginia:
10.2%
Students in private undergraduate colleges: 30
Here:
45.8%
Virginia:
18.7%
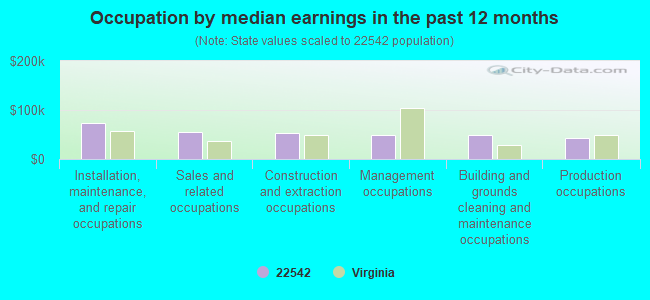
Occupation by median earnings in the past 12 months ($)
74,408Installation, maintenance, and repair occupations
54,183Sales and related occupations
53,865Construction and extraction occupations
49,483Management occupations
48,928Building and grounds cleaning and maintenance occupations
42,782Production occupations
Top industries in this zip code by the number of employees in 2005:
Construction: Painting and Wall Covering Contractors (5-9: 1)
Other Services (except Public Administration): General Automotive Repair (5-9: 1)
Construction: Site Preparation Contractors (5-9: 1)
2004 - 2018 National Fire Incident Reporting System (NFIRS) incidents
Based on the data from the years 2004 - 2018 the average number of fire incidents per year is 9. The highest number of reported fires - 25 took place in 2014, and the least - 1 in 2004. The data has an increasing trend.
When looking into fire subcategories, the most reports belonged to: Structure Fires (45.2%), and Outside Fires (39.3%).
Fire incident types reported to NFIRS in Zip Code 22542

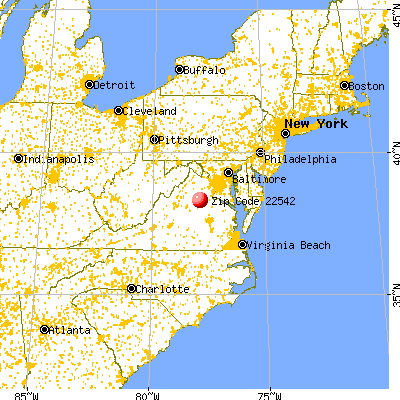


 Nearest zip codes: 22433, 22567, 22508, 22726, 22741, 22729.


 Based on the data from the years 2004 - 2018 the average number of fire incidents per year is 9. The highest number of reported fires - 25 took place in 2014, and the least - 1 in 2004. The data has an increasing trend.
 When looking into fire subcategories, the most reports belonged to: Structure Fires (45.2%), and Outside Fires (39.3%).