Estimated zip code population in 2022: 4,460 Zip code population in 2010: 3,880 Zip code population in 2000: 2,921
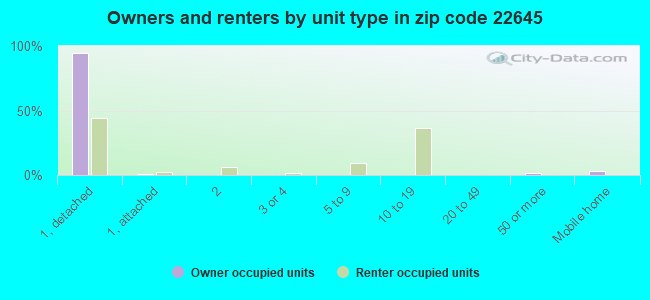
Houses and condos: 1,896 Renter-occupied apartments: 423
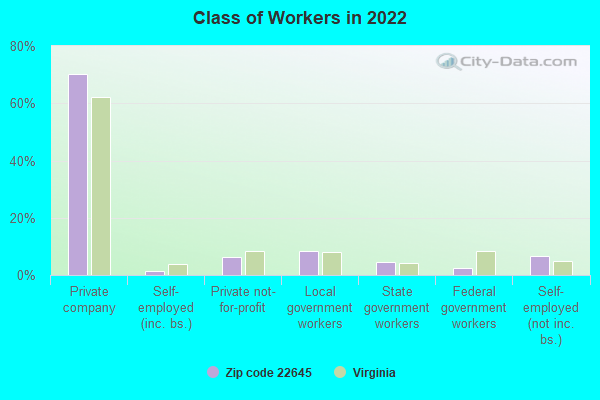
% of renters here:
24%
State:
33%
March 2022 cost of living index in zip code 22645: 86.6 (less than average, U.S. average is 100)
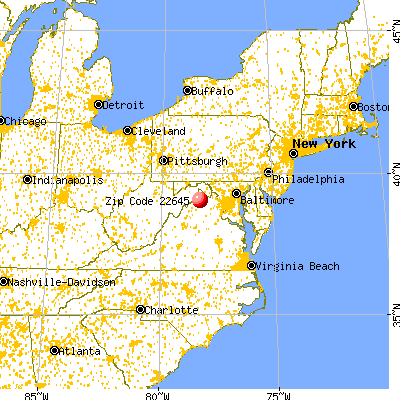
Land area: 35.7 sq. mi. Water area: 0.4 sq. mi.
Population density: 125 people per square mile
(very low).
OSM Map
General Map
Google Map
MSN Map
OSM Map
General Map
Google Map
MSN Map
OSM Map
General Map
Google Map
MSN Map
OSM Map
General Map
Google Map
MSN Map
Please wait while loading the map...
Real estate property taxes paid for housing units in 2022:
This zip code:
0.5% ($1,792)
Virginia:
0.7% ($2,617)
Median real estate property taxes paid for housing units with mortgages in 2022: $1,948 (0.5%) Median real estate property taxes paid for housing units with no mortgage in 2022: $1,478 (0.5%)
Business Search- 14 Million verified businesses
Males: 2,069
(46.4%)
Females: 2,390
(53.6%)
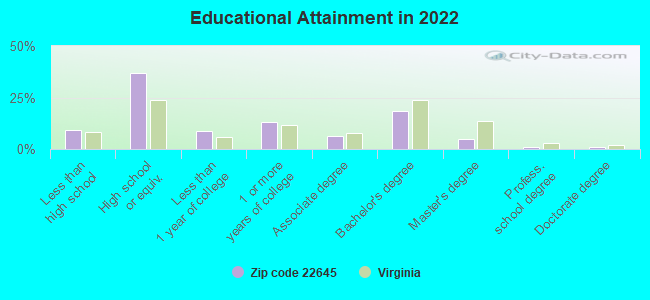
For population 25 years and over in 22645:
High school or higher: 89.9%
Bachelor's degree or higher: 25.3%
Graduate or professional degree: 7.1%
Unemployed: 1.1%
Mean travel time to work (commute): 32.5 minutes
For population 15 years and over in 22645:
Never married: 27.5%
Now married: 50.7%
Separated: 1.7%
Widowed: 7.0%
Divorced: 13.1%
Zip code 22645 compared to state average:
Unemployed percentage significantly below state average.
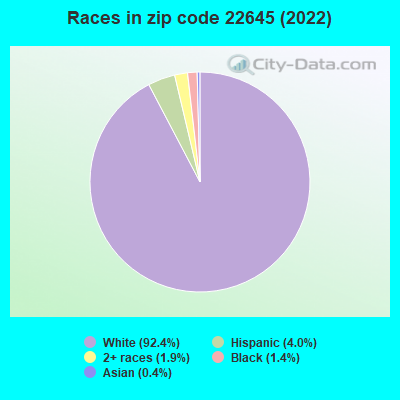
Black race population percentage significantly below state average.
Hispanic race population percentage below state average.
Median age above state average.
Foreign-born population percentage significantly below state average.
Length of stay since moving in significantly above state average.
Number of college students below state average.
Percentage of population with a bachelor's degree or higher below state average.
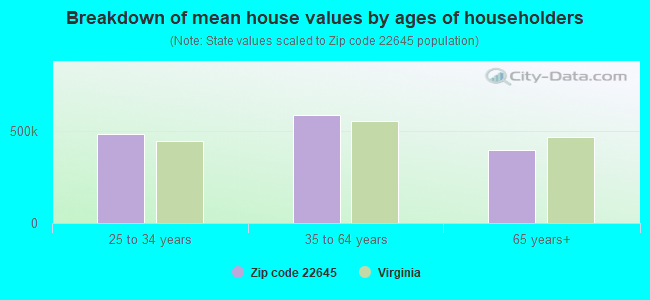
Estimated median house/condo value in 2022: $373,234
22645:
$373,234
Virginia:
$365,700
According to our research of Virginia and other state lists, there were 11 registered sex offenders living in 22645 zip code as of June 16, 2024. The ratio of all residents to sex offenders in zip code 22645 is 381 to 1. The ratio of registered sex offenders to all residents in this zip code is near the state average.
Median resident age:
This zip code:
45.8 years
Virginia median age:
39.0 years
Average household size:
This zip code:
2.5 people
Virginia:
2.5 people
Averages for the 2020 tax year for zip code 22645, filed in 2021:
Average Adjusted Gross Income (AGI) in 2020: $74,806 (Individual Income Tax Returns)
Here:
$74,806
State:
$86,446
Salary/wage: $66,267 (reported on 83.6% of returns)
Here:
$66,267
State:
$71,185
(% of AGI for various income ranges: 1179.0% for AGIs below $25k, 3623.8% for AGIs $25k-50k, 6125.9% for AGIs $50k-75k, 9042.4% for AGIs $75k-100k, 17845.4% for AGIs $100k-200k, 67387.5% for AGIs over 200k)
Taxable interest for individuals: $1,956 (reported on 26.0% of returns)
This zip code:
$1,956
Virginia:
$1,805
(% of AGI for various income ranges: 12.7% for AGIs below $25k, 17.0% for AGIs $25k-50k, 19.1% for AGIs $50k-75k, 70.0% for AGIs $75k-100k, 113.8% for AGIs $100k-200k, 1335.0% for AGIs over 200k)
Ordinary dividends: $3,620 (reported on 18.7% of returns)
Here:
$3,620
State:
$8,327
(% of AGI for various income ranges: 16.9% for AGIs below $25k, 28.1% for AGIs $25k-50k, 71.8% for AGIs $50k-75k, 78.8% for AGIs $75k-100k, 133.5% for AGIs $100k-200k, 1650.0% for AGIs over 200k)
Net capital gain/loss in AGI: +$9,103 (reported on 17.4% of returns)
Here:
+$9,103
State:
+$24,644
(% of AGI for various income ranges: 4.4% for AGIs below $25k, 25.9% for AGIs $25k-50k, 44.1% for AGIs $50k-75k, 190.6% for AGIs $75k-100k, 358.8% for AGIs $100k-200k, 4970.0% for AGIs over 200k)
Profit/loss from business: +$9,370 (reported on 15.1% of returns)
Here:
+$9,370
State:
+$12,836
(% of AGI for various income ranges: 126.7% for AGIs below $25k, 67.8% for AGIs $25k-50k, 272.3% for AGIs $50k-75k, 278.2% for AGIs $75k-100k, 333.1% for AGIs $100k-200k, 737.5% for AGIs over 200k)
Taxable individual retirement arrangement distribution: $17,604 (reported on 10.5% of returns)
22645:
$17,604
Virginia:
$21,535
(% of AGI for various income ranges: 65.4% for AGIs below $25k, 70.5% for AGIs $25k-50k, 190.0% for AGIs $50k-75k, 447.6% for AGIs $75k-100k, 882.7% for AGIs $100k-200k)
Total itemized deductions: $29,955 (reported on 13.2% of returns)
Here:
$29,955
State:
$33,287
(% of AGI for various income ranges: 77.5% for AGIs below $25k, 362.3% for AGIs $50k-75k, 592.4% for AGIs $75k-100k, 1355.8% for AGIs $100k-200k, 7465.0% for AGIs over 200k)
Charity contributions: $8,657 (reported on 10.5% of returns)
Here:
$8,657
State:
$10,381
(% of AGI for various income ranges: 45.5% for AGIs $50k-75k, 82.9% for AGIs $75k-100k, 275.8% for AGIs $100k-200k, 2582.5% for AGIs over 200k)
Taxes paid: $7,834 (reported on 13.2% of returns)
22645:
$7,834
State:
$8,284
(% of AGI for various income ranges: 18.5% for AGIs below $25k, 100.5% for AGIs $50k-75k, 132.9% for AGIs $75k-100k, 406.9% for AGIs $100k-200k, 1695.0% for AGIs over 200k)
Earned income credit: $2,127 (reported on 11.9% of returns)
Here:
$2,127
State:
$2,214
(% of AGI for various income ranges: 68.8% for AGIs below $25k, 60.3% for AGIs $25k-50k)
Percentage of individuals using paid preparers for their 2020 taxes: 92.7%
Here:
93%
State:
92%
(% for various income ranges: 92.1% for AGIs below $25k, 93.3% for AGIs $25k-50k, 93.3% for AGIs $50k-75k, 91.7% for AGIs $75k-100k, 93.2% for AGIs $100k-200k, 92.3% for AGIs over 200k)
Averages for the 2012 tax year for zip code 22645, filed in 2013:
Average Adjusted Gross Income (AGI) in 2012: $60,134 (Individual Income Tax Returns)
Here:
$60,134
State:
$71,192
Salary/wage: $52,658 (reported on 84.8% of returns)
Here:
$52,658
State:
$59,229
(% of AGI for various income ranges: 78.4% for AGIs below $25k, 75.9% for AGIs $25k-50k, 77.8% for AGIs $50k-75k, 73.0% for AGIs $75k-100k, 78.1% for AGIs $100k-200k, 61.5% for AGIs over 200k)
Taxable interest for individuals: $1,383 (reported on 33.1% of returns)
This zip code:
$1,383
Virginia:
$1,600
(% of AGI for various income ranges: 1.3% for AGIs below $25k, 0.8% for AGIs $25k-50k, 1.1% for AGIs $50k-75k, 0.5% for AGIs $75k-100k, 0.6% for AGIs $100k-200k, 0.8% for AGIs over 200k)
Ordinary dividends: $2,667 (reported on 21.9% of returns)
Here:
$2,667
State:
$6,959
(% of AGI for various income ranges: 1.5% for AGIs below $25k, 1.5% for AGIs $25k-50k, 1.1% for AGIs $50k-75k, 0.6% for AGIs $75k-100k, 0.5% for AGIs $100k-200k, 1.5% for AGIs over 200k)
Net capital gain/loss in AGI: +$8,089 (reported on 15.2% of returns)
Here:
+$8,089
State:
+$16,672
(% of AGI for various income ranges: 0.8% for AGIs below $25k, 0.9% for AGIs $75k-100k, 1.1% for AGIs $100k-200k, 9.1% for AGIs over 200k)
Profit/loss from business: +$10,771 (reported on 15.7% of returns)
Here:
+$10,771
State:
+$14,116
(% of AGI for various income ranges: 5.7% for AGIs below $25k, 2.5% for AGIs $25k-50k, 2.8% for AGIs $50k-75k, 2.0% for AGIs $75k-100k, 4.1% for AGIs $100k-200k)
Taxable individual retirement arrangement distribution: $12,435 (reported on 9.6% of returns)
22645:
$12,435
Virginia:
$16,667
(% of AGI for various income ranges: 2.1% for AGIs below $25k, 1.9% for AGIs $25k-50k, 1.9% for AGIs $50k-75k, 3.3% for AGIs $75k-100k, 2.4% for AGIs $100k-200k)
Total itemized deductions: $23,535 (22% of AGI, reported on 38.8% of returns)
Here:
$23,535
State:
$26,596
Here:
22.2% of AGI
State:
20.1% of AGI
(% of AGI for various income ranges: 8.3% for AGIs below $25k, 11.2% for AGIs $25k-50k, 13.8% for AGIs $50k-75k, 16.8% for AGIs $75k-100k, 17.9% for AGIs $100k-200k, 15.8% for AGIs over 200k)
Charity contributions: $3,540 (reported on 29.2% of returns)
Here:
$3,540
State:
$4,443
(% of AGI for various income ranges: 0.4% for AGIs below $25k, 1.0% for AGIs $25k-50k, 1.2% for AGIs $50k-75k, 1.9% for AGIs $75k-100k, 2.0% for AGIs $100k-200k, 2.6% for AGIs over 200k)
Taxes paid: $7,612 (reported on 38.8% of returns)
22645:
$7,612
State:
$9,951
(% of AGI for various income ranges: 0.7% for AGIs below $25k, 2.0% for AGIs $25k-50k, 3.9% for AGIs $50k-75k, 4.9% for AGIs $75k-100k, 6.5% for AGIs $100k-200k, 6.8% for AGIs over 200k)
Earned income credit: $2,123 (reported on 14.6% of returns)
Here:
$2,123
State:
$2,211
(% of AGI for various income ranges: 5.4% for AGIs below $25k, 0.9% for AGIs $25k-50k)
Percentage of individuals using paid preparers for their 2012 taxes: 53.4%
Here:
53%
State:
46%
(% for various income ranges: 50.8% for AGIs below $25k, 51.3% for AGIs $25k-50k, 56.0% for AGIs $50k-75k, 57.9% for AGIs $75k-100k, 57.7% for AGIs $100k-200k, 50.0% for AGIs over 200k)
Averages for the 2004 tax year for zip code 22645, filed in 2005:
Average Adjusted Gross Income (AGI) in 2004: $51,620 (Individual Income Tax Returns)
Here:
$51,620
State:
$56,704
Salary/wage: $43,764 (reported on 87.2% of returns)
Here:
$43,764
State:
$48,441
(% of AGI for various income ranges: 151.6% for AGIs below $10k, 83.3% for AGIs $10k-25k, 85.2% for AGIs $25k-50k, 80.3% for AGIs $50k-75k, 84.1% for AGIs $75k-100k, 58.3% for AGIs over 100k)
Taxable interest for individuals: $1,460 (reported on 41.7% of returns)
This zip code:
$1,460
Virginia:
$1,688
(% of AGI for various income ranges: 7.1% for AGIs below $10k, 2.6% for AGIs $10k-25k, 1.1% for AGIs $25k-50k, 1.4% for AGIs $50k-75k, 1.1% for AGIs $75k-100k, 0.7% for AGIs over 100k)
Taxable dividends: $2,209 (reported on 20.2% of returns)
Here:
$2,209
State:
$4,028
(% of AGI for various income ranges: 6.9% for AGIs below $10k, 1.4% for AGIs $10k-25k, 0.4% for AGIs $25k-50k, 0.7% for AGIs $50k-75k, 0.5% for AGIs $75k-100k, 1.0% for AGIs over 100k)
Net capital gain/loss: +$13,171 (reported on 16.2% of returns)
Here:
+$13,171
State:
+$14,375
(% of AGI for various income ranges: 1.8% for AGIs below $10k, -0.3% for AGIs $10k-25k, 0.3% for AGIs $25k-50k, 0.9% for AGIs $50k-75k, 3.3% for AGIs $75k-100k, 8.7% for AGIs over 100k)
Profit/loss from business: +$7,285 (reported on 15.7% of returns)
Here:
+$7,285
State:
+$13,342
(% of AGI for various income ranges: 0.9% for AGIs below $10k, 4.6% for AGIs $10k-25k, 4.4% for AGIs $25k-50k, 3.5% for AGIs $50k-75k, 1.8% for AGIs $75k-100k, 0.3% for AGIs over 100k)
IRA payment deduction: $3,263 (reported on 2.4% of returns)
22645:
$3,263
Virginia:
$2,943
Total itemized deductions: $17,573 (18% of AGI, reported on 36.1% of returns)
Here:
$17,573
State:
$21,492
Here:
18.4% of AGI
State:
21.0% of AGI
(% of AGI for various income ranges: 23.4% for AGIs below $10k, 10.2% for AGIs $10k-25k, 11.4% for AGIs $25k-50k, 13.6% for AGIs $50k-75k, 15.1% for AGIs $75k-100k, 11.1% for AGIs over 100k)
Charity contributions deductions: $2,759 (3% of AGI, reported on 30.0% of returns)
Here:
$2,759
State:
$3,794
Here:
2.7% of AGI
State:
3.5% of AGI
(% of AGI for various income ranges: 1.1% for AGIs $10k-25k, 1.3% for AGIs $25k-50k, 1.5% for AGIs $50k-75k, 1.6% for AGIs $75k-100k, 2.0% for AGIs over 100k)
Total tax: $8,870 (reported on 77.7% of returns)
22645:
$8,870
State:
$9,537
(% of AGI for various income ranges: 5.4% for AGIs below $10k, 4.2% for AGIs $10k-25k, 8.3% for AGIs $25k-50k, 8.8% for AGIs $50k-75k, 10.0% for AGIs $75k-100k, 21.1% for AGIs over 100k)
Earned income credit: $1,561 (reported on 14.3% of returns)
Here:
$1,561
State:
$1,734
Percentage of individuals using paid preparers for their 2004 taxes: 58.8%
Here:
59%
State:
52%
(% for various income ranges: 51.9% for AGIs below $10k, 61.0% for AGIs $10k-25k, 60.7% for AGIs $25k-50k, 61.2% for AGIs $50k-75k, 54.2% for AGIs $75k-100k, 62.0% for AGIs over 100k)
Likely homosexual households (counted as self-reported same-sex unmarried-partner households)
Lesbian couples: 0.3% of all households
Gay men: 0.0% of all households
Household received Food Stamps/SNAP in the past 12 months: 162 Household did not receive Food Stamps/SNAP in the past 12 months: 1,605
Women who had a birth in the past 12 months: 66 (42 now married, 23 unmarried) Women who did not have a birth in the past 12 months: 973 (381 now married, 594 unmarried)
Housing units in zip code 22645 with a mortgage: 920 (152 second mortgage, 140 both second mortgage and home equity loan) Houses without a mortgage: 51
Median monthly owner costs for units with a mortgage: $1,884 Median monthly owner costs for units without a mortgage: $439
Residents with income below the poverty level in 2022:
This zip code:
8.6%
Whole state:
10.6%
Residents with income below 50% of the poverty level in 2022:
This zip code:
6.2%
Whole state:
5.2%
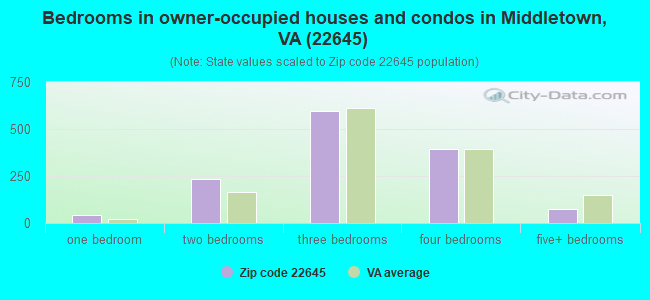
Median number of rooms in houses and condos:
Here:
6.9
State:
7.0
Median number of rooms in apartments:
Here:
4.3
State:
4.3
Notable locations in this zip code not listed on our city pages
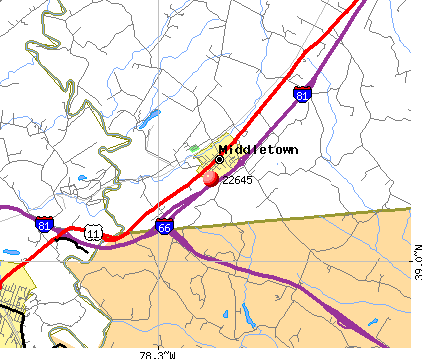
Notable locations in zip code 22645: Cedar Creek Battlefield (A), Ashton Farm (B), Derflingers Farm (C), Forest Grove (D), Long Meadow (E), Montvue Farms (F), Mountain View Farm (G), River Hill (H), Windcrest Farm (I), Middletown Town Hall (J), Frederick County Fire and Rescue Department Station 12 - Middletown Volunteer Fire and Rescue (K), Cedar Creek Battlefield Foundation Visitor Center (L), Belle Grove Plantation (M). Display/hide their locations on the map
Churches in zip code 22645 include: Epworth Chapel (A), Hites Chapel (B), Reliance United Methodist Church (C), Middletown Church (D). Display/hide their locations on the map
Streams, rivers, and creeks: Watson Run (A), Middle Marsh Brook (B), Meadow Brook (C), Dry Run (D), Molly Booth Run (E), Catlett Run (F), Cedar Creek (G). Display/hide their locations on the map
Size of family households: 602 2-persons, 236 3-persons, 204 4-persons, 65 5-persons, 46 6-persons, 29 7-or-more-persons
Size of nonfamily households: 521 1-person, 57 2-persons, 7 3-persons
582 married couples with children.
248 single-parent households (11 men, 237 women).
95.2% of residents of 22645 zip code speak English at home.
3.5% of residents speak Spanish at home (74% very well, 13% well, 14% not well).
0.3% of residents speak other Indo-European language at home (77% very well, 23% well).
0.9% of residents speak Asian or Pacific Island language at home (100% very well).
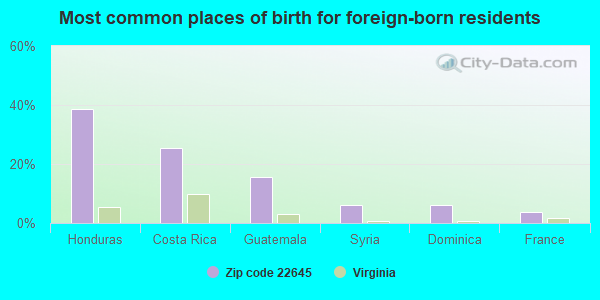
Foreign born population: 82 (1.8%) (50.3% of them are naturalized citizens)
This zip code:
1.8%
Whole state:
12.7%
39%Honduras
25%Costa Rica
16%Guatemala
6%Syria
6%Dominica
4%France
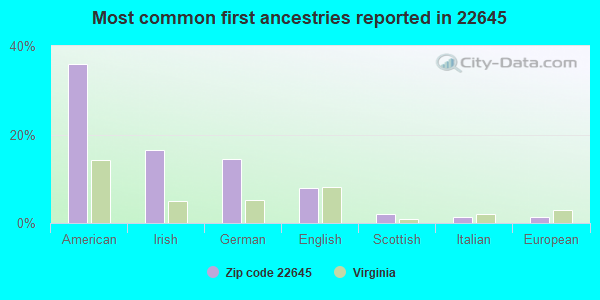
36%American
17%Irish
15%German
8%English
2%Scottish
1%Italian
1%European
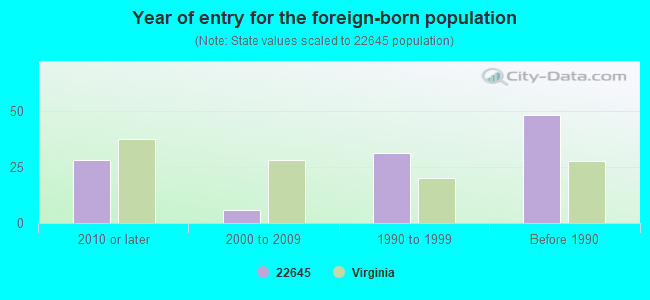
Year of entry for the foreign-born population
282010 or later
62000 to 2009
311990 to 1999
48Before 1990
Facilities with environmental interests located in this zip code:
AT&T EASY LINK SERVICES (8209 VALLEY PIKE in MIDDLETOWN, VA)
AIR MINOR (AIRS/AFS) STATE MASTER (Virginia pollutants databases) - CEDS-80941, AIR PROGRAM CRITERIA AND HAZARDOUS AIR POLLUTANT INVENTORY (Inventory of air pollution sources) (Resource Conservation and Recovery Act (tracking hazardous waste)) Business SIC classification: TELEGRAPH AND OTHER MESSAGE COMMUNICATIONS Business NAICS classification: WIRED TELECOMMUNICATIONS CARRIERS.; WIRED TELECOMMUNICATIONS CARRIERS. Alternative names: AT & T EASYLINK SERVICES
DONOVAN TRUCKING AND EXCAVATING (57 RELIANCE ROAD in MIDDLETOWN, VA)
AIR MINOR (AIRS/AFS) Business SIC classification: EXCAVATION WORK
Housing units lacking complete plumbing facilities: 1.6% Housing units lacking complete kitchen facilities: 1.6%
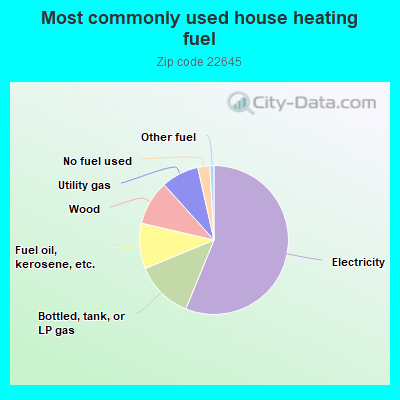
56.3%Electricity
12.6%Bottled, tank, or LP gas
9.9%Fuel oil, kerosene, etc.
9.7%Wood
8.2%Utility gas
2.6%No fuel used
0.9%Other fuel
Population in 1990: 2,239. Population change in the 1990s: +682 (+30.5%).
Place of birth for U.S.-born residents:
This state: 2,923
Northeast: 551
Midwest: 207
South: 533
West: 108
63% of the 22645 zip code residents lived in the same house 5 years ago. Out of people who lived in different houses, 49% lived in this county. Out of people who lived in different counties, 50% lived in Virginia.
92% of the 22645 zip code residents lived in the same house 1 year ago. Out of people who lived in different houses, 34% moved from this county. Out of people who lived in different houses, 61% moved from different county within same state. Out of people who lived in different houses, 7% moved from abroad.
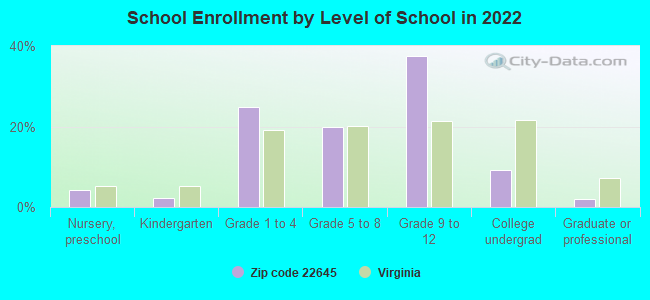
Private vs. public school enrollment:
Students in private schools in grades 1 to 8 (elementary and middle school): 104
Here:
25.0%
Virginia:
13.2%
Students in private schools in grades 9 to 12 (high school): 25
Here:
7.2%
Virginia:
10.2%
Students in private undergraduate colleges: 23
Here:
27.9%
Virginia:
18.7%
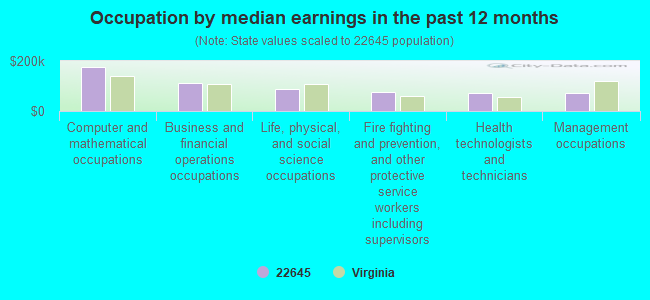
Occupation by median earnings in the past 12 months ($)
175,340Computer and mathematical occupations
110,763Business and financial operations occupations
89,117Life, physical, and social science occupations
75,795Fire fighting and prevention, and other protective service workers including supervisors
71,467Health technologists and technicians
70,204Management occupations
Top industries in this zip code by the number of employees in 2005:
Professional, Scientific, and Technical Services: Surveying and Mapping (except Geophysical) Services (50-99 employees: 1 establishment, 5-9 employees: 1 establishment)
Construction: Site Preparation Contractors (20-49: 1, 5-9: 1, 1-4: 1)
Construction: Plumbing, Heating, and Air-Conditioning Contractors (20-49: 1, 1-4: 3)
Accommodation and Food Services: Full-Service Restaurants (20-49: 1, 1-4: 1)
Construction: Commercial and Institutional Building Construction (20-49: 1)
Arts, Entertainment, and Recreation: Theater Companies and Dinner Theaters (20-49: 1)
Construction: Poured Concrete Foundation and Structure Contractors (20-49: 1)
People in group quarters in 2000:
2 people in homes for the physically handicapped
Fatal accident statistics in 2014:
Fatal accident count: 2
Vehicles involved in fatal accidents: 2
Fatal accidents caused by drunken drivers: 1
Fatalities: 2
Persons involved in fatal accidents: 3
Pedestrians involved in fatal accidents: 0
Fatal accident statistics in 2013:
Fatal accident count: 2
Vehicles involved in fatal accidents: 3
Fatal accidents caused by drunken drivers: 1
Fatalities: 2
Persons involved in fatal accidents: 4
Pedestrians involved in fatal accidents: 0
Home Mortgage Disclosure Act Aggregated Statistics For Year 2009 (Based on 6 partial tracts)
A) FHA, FSA/RHS & VA Home Purchase Loans
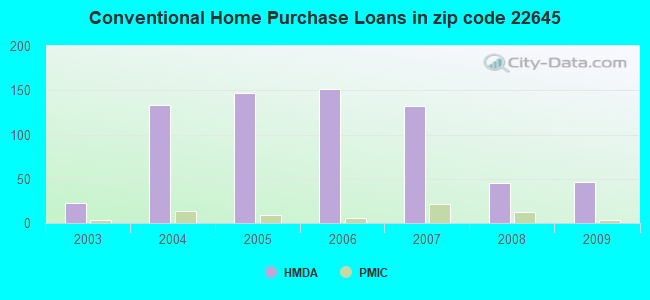
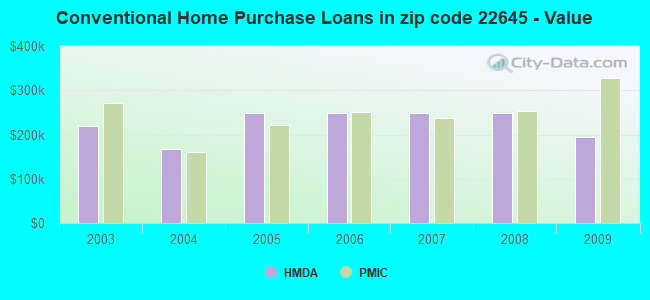
B) Conventional Home Purchase Loans
C) Refinancings
D) Home Improvement Loans
F) Non-occupant Loans on < 5 Family Dwellings (A B C & D)
G) Loans On Manufactured Home Dwelling (A B C & D)
Number
Average Value
Number
Average Value
Number
Average Value
Number
Average Value
Number
Average Value
Number
Average Value
LOANS ORIGINATED
40
$207,948
46
$194,282
173
$233,542
15
$53,278
20
$150,990
2
$44,915
APPLICATIONS APPROVED, NOT ACCEPTED
0
$0
3
$307,577
7
$250,610
0
$0
2
$147,625
0
$0
APPLICATIONS DENIED
12
$192,922
8
$146,011
77
$237,131
8
$21,611
6
$256,672
5
$115,298
APPLICATIONS WITHDRAWN
2
$185,705
7
$207,313
55
$256,044
3
$168,247
4
$174,235
0
$0
FILES CLOSED FOR INCOMPLETENESS
0
$0
1
$318,500
12
$278,893
0
$0
0
$0
0
$0
Aggregated Statistics For Year 2008 (Based on 6 partial tracts)
A) FHA, FSA/RHS & VA Home Purchase Loans
B) Conventional Home Purchase Loans
C) Refinancings
D) Home Improvement Loans
F) Non-occupant Loans on < 5 Family Dwellings (A B C & D)
G) Loans On Manufactured Home Dwelling (A B C & D)
Number
Average Value
Number
Average Value
Number
Average Value
Number
Average Value
Number
Average Value
Number
Average Value
LOANS ORIGINATED
22
$225,828
45
$247,628
110
$226,614
20
$74,102
22
$232,936
6
$77,242
APPLICATIONS APPROVED, NOT ACCEPTED
1
$244,370
8
$190,175
12
$267,991
3
$74,350
2
$58,260
2
$31,070
APPLICATIONS DENIED
10
$316,793
17
$217,658
114
$242,226
9
$149,924
8
$187,851
3
$161,070
APPLICATIONS WITHDRAWN
6
$265,798
4
$276,112
53
$255,012
2
$206,975
8
$207,626
2
$78,455
FILES CLOSED FOR INCOMPLETENESS
0
$0
2
$347,435
19
$304,558
1
$47,120
0
$0
0
$0
Aggregated Statistics For Year 2007 (Based on 6 partial tracts)
A) FHA, FSA/RHS & VA Home Purchase Loans
B) Conventional Home Purchase Loans
C) Refinancings
D) Home Improvement Loans
E) Loans on Dwellings For 5+ Families
F) Non-occupant Loans on < 5 Family Dwellings (A B C & D)
G) Loans On Manufactured Home Dwelling (A B C & D)
Number
Average Value
Number
Average Value
Number
Average Value
Number
Average Value
Number
Average Value
Number
Average Value
Number
Average Value
LOANS ORIGINATED
9
$278,441
132
$248,269
177
$224,006
34
$113,993
2
$745,730
21
$249,763
3
$174,477
APPLICATIONS APPROVED, NOT ACCEPTED
1
$107,420
17
$240,519
32
$240,763
1
$78,470
0
$0
7
$379,709
0
$0
APPLICATIONS DENIED
0
$0
15
$206,407
136
$276,807
14
$168,046
0
$0
6
$338,567
2
$55,275
APPLICATIONS WITHDRAWN
1
$223,620
16
$177,454
69
$219,933
7
$250,767
0
$0
6
$173,805
2
$65,510
FILES CLOSED FOR INCOMPLETENESS
0
$0
5
$201,172
16
$270,682
3
$62,713
0
$0
0
$0
0
$0
Aggregated Statistics For Year 2006 (Based on 6 partial tracts)
A) FHA, FSA/RHS & VA Home Purchase Loans
B) Conventional Home Purchase Loans
C) Refinancings
D) Home Improvement Loans
F) Non-occupant Loans on < 5 Family Dwellings (A B C & D)
G) Loans On Manufactured Home Dwelling (A B C & D)
Number
Average Value
Number
Average Value
Number
Average Value
Number
Average Value
Number
Average Value
Number
Average Value
LOANS ORIGINATED
4
$263,815
151
$247,873
250
$209,891
43
$92,976
26
$159,115
6
$87,270
APPLICATIONS APPROVED, NOT ACCEPTED
0
$0
18
$304,069
32
$217,827
8
$47,812
1
$324,100
0
$0
APPLICATIONS DENIED
0
$0
32
$211,486
149
$203,227
16
$85,769
8
$190,401
2
$60,965
APPLICATIONS WITHDRAWN
0
$0
19
$185,696
104
$212,481
6
$66,530
6
$225,460
1
$77,270
FILES CLOSED FOR INCOMPLETENESS
0
$0
6
$266,643
17
$214,899
3
$191,610
0
$0
0
$0
Aggregated Statistics For Year 2005 (Based on 6 partial tracts)
A) FHA, FSA/RHS & VA Home Purchase Loans
B) Conventional Home Purchase Loans
C) Refinancings
D) Home Improvement Loans
F) Non-occupant Loans on < 5 Family Dwellings (A B C & D)
G) Loans On Manufactured Home Dwelling (A B C & D)
Number
Average Value
Number
Average Value
Number
Average Value
Number
Average Value
Number
Average Value
Number
Average Value
LOANS ORIGINATED
7
$198,794
147
$249,208
261
$186,971
48
$96,507
31
$184,231
3
$82,717
APPLICATIONS APPROVED, NOT ACCEPTED
0
$0
9
$245,071
34
$164,435
8
$43,994
3
$173,507
0
$0
APPLICATIONS DENIED
0
$0
20
$194,337
132
$170,747
40
$85,095
2
$125,840
1
$70,180
APPLICATIONS WITHDRAWN
0
$0
29
$206,404
78
$169,928
18
$181,198
3
$171,530
0
$0
FILES CLOSED FOR INCOMPLETENESS
0
$0
4
$213,378
16
$181,437
3
$41,743
3
$146,047
0
$0
Aggregated Statistics For Year 2004 (Based on 6 partial tracts)
A) FHA, FSA/RHS & VA Home Purchase Loans
B) Conventional Home Purchase Loans
C) Refinancings
D) Home Improvement Loans
E) Loans on Dwellings For 5+ Families
F) Non-occupant Loans on < 5 Family Dwellings (A B C & D)
G) Loans On Manufactured Home Dwelling (A B C & D)
Number
Average Value
Number
Average Value
Number
Average Value
Number
Average Value
Number
Average Value
Number
Average Value
Number
Average Value
LOANS ORIGINATED
6
$144,245
133
$166,306
231
$152,170
26
$92,124
0
$0
28
$191,530
4
$59,385
APPLICATIONS APPROVED, NOT ACCEPTED
1
$82,920
11
$151,575
42
$139,876
6
$48,088
1
$150,770
2
$142,155
0
$0
APPLICATIONS DENIED
0
$0
22
$106,114
107
$138,350
31
$69,985
0
$0
4
$156,980
9
$73,874
APPLICATIONS WITHDRAWN
2
$137,590
17
$180,208
102
$141,340
9
$48,458
0
$0
2
$112,995
0
$0
FILES CLOSED FOR INCOMPLETENESS
2
$94,770
4
$293,222
17
$152,958
5
$77,680
0
$0
0
$0
0
$0
Aggregated Statistics For Year 2003 (Based on 2 partial tracts)
A) FHA, FSA/RHS & VA Home Purchase Loans
B) Conventional Home Purchase Loans
C) Refinancings
D) Home Improvement Loans
F) Non-occupant Loans on < 5 Family Dwellings (A B C & D)
2002 - 2018 National Fire Incident Reporting System (NFIRS) incidents
Based on the data from the years 2002 - 2018 the average number of fire incidents per year is 26. The highest number of fire incidents - 51 took place in 2007, and the least - 10 in 2003. The data has a growing trend.
When looking into fire subcategories, the most incidents belonged to: Structure Fires (42.1%), and Outside Fires (35.1%).
Fire incident types reported to NFIRS in Zip Code 22645


 Nearest zip codes: 22655, 22657, 22641, 22602, 22630, 22663.


 Based on the data from the years 2002 - 2018 the average number of fire incidents per year is 26. The highest number of fire incidents - 51 took place in 2007, and the least - 10 in 2003. The data has a growing trend.
 When looking into fire subcategories, the most incidents belonged to: Structure Fires (42.1%), and Outside Fires (35.1%).