Estimated zip code population in 2022: 1,563 Zip code population in 2010: 1,399 Zip code population in 2000: 1,143
Houses and condos: 771 Renter-occupied apartments: 55
% of renters here:
9%
State:
33%
March 2022 cost of living index in zip code 22652: 83.3 (low, U.S. average is 100)
Land area: 70.3 sq. mi. Water area: 0.3 sq. mi.
Population density: 22 people per square mile
(very low).
OSM Map
General Map
Google Map
MSN Map
OSM Map
General Map
Google Map
MSN Map
OSM Map
General Map
Google Map
MSN Map
OSM Map
General Map
Google Map
MSN Map
Please wait while loading the map...
Real estate property taxes paid for housing units in 2022:
This zip code:
0.4% ($1,469)
Virginia:
0.7% ($2,617)
Median real estate property taxes paid for housing units with mortgages in 2022: $1,484 (0.4%) Median real estate property taxes paid for housing units with no mortgage in 2022: $1,471 (0.4%)
Business Search- 14 Million verified businesses
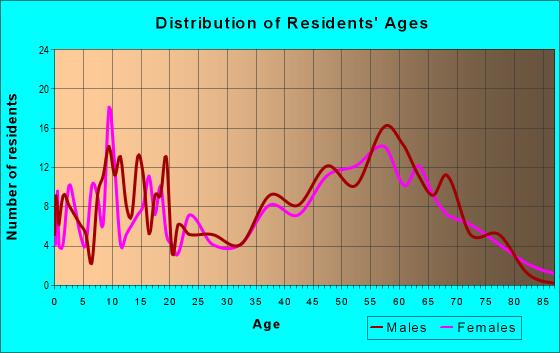
Males: 908
(58.1%)
Females: 655
(41.9%)
For population 25 years and over in 22652:
High school or higher: 85.8%
Bachelor's degree or higher: 18.2%
Graduate or professional degree: 9.3%
Unemployed: 7.6%
Mean travel time to work (commute): 41.9 minutes
For population 15 years and over in 22652:
Never married: 34.3%
Now married: 53.6%
Separated: 0.0%
Widowed: 2.9%
Divorced: 9.3%
Zip code 22652 compared to state average:
Unemployed percentage above state average.
Black race population percentage significantly below state average.
Hispanic race population percentage significantly below state average.
Median age above state average.
Foreign-born population percentage significantly below state average.
Renting percentage significantly below state average.
Length of stay since moving in significantly above state average.
Number of college students below state average.
Percentage of population with a bachelor's degree or higher significantly below state average.
Averages for the 2020 tax year for zip code 22652, filed in 2021:
Average Adjusted Gross Income (AGI) in 2020: $70,442 (Individual Income Tax Returns)
Here:
$70,442
State:
$86,446
Salary/wage: $59,241 (reported on 71.0% of returns)
Here:
$59,241
State:
$71,185
(% of AGI for various income ranges: 1331.0% for AGIs below $25k, 3790.8% for AGIs $25k-50k, 5432.2% for AGIs $50k-75k, 8860.0% for AGIs $75k-100k, 12257.1% for AGIs $100k-200k)
Taxable interest for individuals: $743 (reported on 33.3% of returns)
This zip code:
$743
Virginia:
$1,805
(% of AGI for various income ranges: 15.0% for AGIs below $25k, 22.5% for AGIs $25k-50k, 21.1% for AGIs $50k-75k, 92.0% for AGIs $75k-100k, 47.1% for AGIs $100k-200k)
Ordinary dividends: $3,158 (reported on 27.5% of returns)
Here:
$3,158
State:
$8,327
(% of AGI for various income ranges: 56.0% for AGIs below $25k, 70.8% for AGIs $25k-50k, 22.2% for AGIs $50k-75k, 54.0% for AGIs $75k-100k, 235.7% for AGIs $100k-200k)
Net capital gain/loss in AGI: +$12,346 (reported on 18.8% of returns)
Here:
+$12,346
State:
+$24,644
(% of AGI for various income ranges: 35.0% for AGIs $25k-50k, 6.7% for AGIs $50k-75k, 665.7% for AGIs $100k-200k)
Profit/loss from business: +$15,554 (reported on 18.8% of returns)
Here:
+$15,554
State:
+$12,836
(% of AGI for various income ranges: 414.0% for AGIs below $25k, 282.2% for AGIs $50k-75k, 1934.3% for AGIs $100k-200k)
Taxable individual retirement arrangement distribution: $17,220 (reported on 14.5% of returns)
22652:
$17,220
Virginia:
$21,535
(% of AGI for various income ranges: 250.0% for AGIs $25k-50k, 487.8% for AGIs $50k-75k, 1404.3% for AGIs $100k-200k)
Total itemized deductions: $29,771 (reported on 10.1% of returns)
Here:
$29,771
State:
$33,287
(% of AGI for various income ranges: 592.5% for AGIs $25k-50k, 1961.4% for AGIs $100k-200k)
Charity contributions: $13,040 (reported on 7.2% of returns)
Here:
$13,040
State:
$10,381
(% of AGI for various income ranges: 90.0% for AGIs $25k-50k, 777.1% for AGIs $100k-200k)
Taxes paid: $7,643 (reported on 10.1% of returns)
22652:
$7,643
State:
$8,284
(% of AGI for various income ranges: 139.2% for AGIs $25k-50k, 525.7% for AGIs $100k-200k)
Earned income credit: $2,214 (reported on 10.1% of returns)
Here:
$2,214
State:
$2,214
(% of AGI for various income ranges: 67.0% for AGIs below $25k, 73.3% for AGIs $25k-50k)
Percentage of individuals using paid preparers for their 2020 taxes: 89.9%
Here:
90%
State:
92%
(% for various income ranges: 84.2% for AGIs below $25k, 93.8% for AGIs $25k-50k, 91.7% for AGIs $50k-75k, 87.5% for AGIs $75k-100k, 90.9% for AGIs $100k-200k, 100.0% for AGIs over 200k)
Averages for the 2012 tax year for zip code 22652, filed in 2013:
Average Adjusted Gross Income (AGI) in 2012: $54,933 (Individual Income Tax Returns)
Here:
$54,933
State:
$71,192
Salary/wage: $47,224 (reported on 77.8% of returns)
Here:
$47,224
State:
$59,229
(% of AGI for various income ranges: 60.6% for AGIs below $25k, 77.2% for AGIs $25k-50k, 69.5% for AGIs $50k-75k, 72.9% for AGIs $75k-100k, 60.1% for AGIs $100k-200k)
Taxable interest for individuals: $933 (reported on 38.1% of returns)
This zip code:
$933
Virginia:
$1,600
(% of AGI for various income ranges: 2.0% for AGIs below $25k, 0.8% for AGIs $25k-50k, 0.8% for AGIs $50k-75k, 0.3% for AGIs $75k-100k, 0.4% for AGIs $100k-200k)
Ordinary dividends: $3,188 (reported on 27.0% of returns)
Here:
$3,188
State:
$6,959
(% of AGI for various income ranges: 2.8% for AGIs below $25k, 0.7% for AGIs $25k-50k, 1.7% for AGIs $50k-75k, 1.1% for AGIs $75k-100k, 1.8% for AGIs $100k-200k)
Net capital gain/loss in AGI: +$7,030 (reported on 15.9% of returns)
Here:
+$7,030
State:
+$16,672
(% of AGI for various income ranges: 5.2% for AGIs $100k-200k)
Profit/loss from business: +$6,377 (reported on 20.6% of returns)
Here:
+$6,377
State:
+$14,116
(% of AGI for various income ranges: 17.3% for AGIs below $25k, 4.4% for AGIs $25k-50k, 1.4% for AGIs $50k-75k, 0.3% for AGIs $100k-200k)
Taxable individual retirement arrangement distribution: $9,325 (reported on 12.7% of returns)
22652:
$9,325
Virginia:
$16,667
(% of AGI for various income ranges: 4.0% for AGIs below $25k, 4.0% for AGIs $25k-50k, 5.7% for AGIs $50k-75k)
Total itemized deductions: $20,792 (24% of AGI, reported on 41.3% of returns)
Here:
$20,792
State:
$26,596
Here:
24.0% of AGI
State:
20.1% of AGI
(% of AGI for various income ranges: 21.3% for AGIs below $25k, 13.9% for AGIs $25k-50k, 14.8% for AGIs $50k-75k, 16.6% for AGIs $75k-100k, 15.4% for AGIs $100k-200k)
Charity contributions: $3,955 (reported on 31.7% of returns)
Here:
$3,955
State:
$4,443
(% of AGI for various income ranges: 2.4% for AGIs $25k-50k, 2.4% for AGIs $50k-75k, 2.9% for AGIs $75k-100k, 2.4% for AGIs $100k-200k)
Taxes paid: $6,031 (reported on 41.3% of returns)
22652:
$6,031
State:
$9,951
(% of AGI for various income ranges: 2.1% for AGIs below $25k, 2.5% for AGIs $25k-50k, 3.7% for AGIs $50k-75k, 4.5% for AGIs $75k-100k, 6.3% for AGIs $100k-200k)
Earned income credit: $1,730 (reported on 15.9% of returns)
Here:
$1,730
State:
$2,211
(% of AGI for various income ranges: 4.3% for AGIs below $25k, 1.1% for AGIs $25k-50k)
Percentage of individuals using paid preparers for their 2012 taxes: 52.4%
Here:
52%
State:
46%
(% for various income ranges: 45.0% for AGIs below $25k, 52.9% for AGIs $25k-50k, 58.3% for AGIs $50k-75k, 50.0% for AGIs $75k-100k, 62.5% for AGIs $100k-200k)
Averages for the 2004 tax year for zip code 22652, filed in 2005:
Average Adjusted Gross Income (AGI) in 2004: $42,151 (Individual Income Tax Returns)
Here:
$42,151
State:
$56,704
Salary/wage: $37,506 (reported on 78.6% of returns)
Here:
$37,506
State:
$48,441
(% of AGI for various income ranges: 96.0% for AGIs below $10k, 71.8% for AGIs $10k-25k, 73.2% for AGIs $25k-50k, 73.3% for AGIs $50k-75k, 69.4% for AGIs $75k-100k, 61.6% for AGIs over 100k)
Taxable interest for individuals: $1,570 (reported on 50.1% of returns)
This zip code:
$1,570
Virginia:
$1,688
(% of AGI for various income ranges: 7.1% for AGIs below $10k, 4.9% for AGIs $10k-25k, 1.6% for AGIs $25k-50k, 2.3% for AGIs $50k-75k, 1.6% for AGIs $75k-100k, 0.4% for AGIs over 100k)
Taxable dividends: $2,971 (reported on 28.2% of returns)
Here:
$2,971
State:
$4,028
(% of AGI for various income ranges: 1.4% for AGIs below $10k, 4.1% for AGIs $10k-25k, 1.1% for AGIs $25k-50k, 2.9% for AGIs $50k-75k, 1.1% for AGIs $75k-100k, 1.9% for AGIs over 100k)
Net capital gain/loss: +$2,567 (reported on 19.9% of returns)
Here:
+$2,567
State:
+$14,375
(% of AGI for various income ranges: -3.1% for AGIs below $10k, -0.6% for AGIs $10k-25k, 1.6% for AGIs $25k-50k, 1.7% for AGIs $50k-75k, -0.4% for AGIs $75k-100k, 2.8% for AGIs over 100k)
Profit/loss from business: +$10,088 (reported on 18.7% of returns)
Here:
+$10,088
State:
+$13,342
(% of AGI for various income ranges: -6.9% for AGIs below $10k, 10.8% for AGIs $10k-25k, 5.7% for AGIs $25k-50k, 1.1% for AGIs $50k-75k, 10.2% for AGIs $75k-100k)
IRA payment deduction: $2,700 (reported on 3.3% of returns)
22652:
$2,700
Virginia:
$2,943
Total itemized deductions: $16,928 (24% of AGI, reported on 36.8% of returns)
Here:
$16,928
State:
$21,492
Here:
24.5% of AGI
State:
21.0% of AGI
(% of AGI for various income ranges: 18.1% for AGIs $10k-25k, 13.3% for AGIs $25k-50k, 14.1% for AGIs $50k-75k, 14.9% for AGIs $75k-100k, 16.5% for AGIs over 100k)
Charity contributions deductions: $3,540 (5% of AGI, reported on 31.0% of returns)
Here:
$3,540
State:
$3,794
Here:
5.0% of AGI
State:
3.5% of AGI
(% of AGI for various income ranges: 1.8% for AGIs $10k-25k, 2.4% for AGIs $25k-50k, 2.1% for AGIs $50k-75k, 1.9% for AGIs $75k-100k, 4.3% for AGIs over 100k)
Total tax: $5,356 (reported on 79.6% of returns)
22652:
$5,356
State:
$9,537
(% of AGI for various income ranges: 3.8% for AGIs below $10k, 5.3% for AGIs $10k-25k, 7.5% for AGIs $25k-50k, 9.0% for AGIs $50k-75k, 11.0% for AGIs $75k-100k, 15.1% for AGIs over 100k)
Earned income credit: $1,616 (reported on 12.1% of returns)
Here:
$1,616
State:
$1,734
Percentage of individuals using paid preparers for their 2004 taxes: 57.4%
Here:
57%
State:
52%
(% for various income ranges: 51.3% for AGIs below $10k, 59.9% for AGIs $10k-25k, 61.8% for AGIs $25k-50k, 56.2% for AGIs $50k-75k, 59.0% for AGIs $75k-100k, 50.0% for AGIs over 100k)
Likely homosexual households (counted as self-reported same-sex unmarried-partner households)
Lesbian couples: 0.0% of all households
Gay men: 1.4% of all households
Household received Food Stamps/SNAP in the past 12 months: 50 Household did not receive Food Stamps/SNAP in the past 12 months: 537
Women who did not have a birth in the past 12 months: 227 (138 now married, 87 unmarried)
Housing units in zip code 22652 with a mortgage: 378 (110 second mortgage, 54 both second mortgage and home equity loan) Median monthly owner costs for units with a mortgage: $1,548 Median monthly owner costs for units without a mortgage: $365
Residents with income below the poverty level in 2022:
This zip code:
2.6%
Whole state:
10.6%
Median number of rooms in houses and condos:
Here:
6.5
State:
7.0
Median number of rooms in apartments:
Here:
5.6
State:
4.3
Notable locations in this zip code not listed on our city pages
Notable locations in zip code 22652: Powells Fort Camp (A), Little Crease Shelter (B), Fort Valley Overlook (C), Shenandoah Valley Overlook (D), Buzzard Rock Overlook (E), Caroline Furnace Camp (F), Elizabeth Furnace (G). Display/hide their locations on the map
Churches in zip code 22652 include: Dry Run Church (A), Fort Valley Church (B), Joppa Church (C), Mount Zion Church (D), Oak Hill Church (E), Oak Level Church (F), Saint Davids Church (G), Trinity Church (H), White Chapel (I). Display/hide their locations on the map
Streams, rivers, and creeks: Mountain Run (A), Mine Run (B), Mill Run (C), Little Passage Creek (D), Dry Run (E), Buck Run (F). Display/hide their locations on the map
Parks in zip code 22652 include: Woodstock Recreational Area (1), Camp Roosevelt Recreation Area (2), Elizabeth Furnace Recreational Area (3), Little Fort Recreation Area (4). Display/hide their locations on the map
Size of family households: 209 2-persons, 89 3-persons, 32 4-persons, 84 5-persons
Size of nonfamily households: 148 1-person, 21 2-persons
331 married couples with children.
81 single-parent households (81 men).
97.7% of residents of 22652 zip code speak English at home.
1.2% of residents speak Spanish at home (39% very well, 61% well).
0.9% of residents speak other Indo-European language at home (100% very well).
Foreign born population: 28 (1.8%) (83.1% of them are naturalized citizens)
This zip code:
1.8%
Whole state:
12.7%
37%Ukraine
26%Greece
19%France
15%Costa Rica
34%American
16%German
8%English
8%Eastern European
5%Irish
5%Dutch
3%Italian
Year of entry for the foreign-born population
02010 or later
42000 to 2009
71990 to 1999
20Before 1990
Facilities with environmental interests located in this zip code:
CAROLINE FURNACE LUTHERAN CAMP (2239 CAMP ROOSEVELT ROAD in FORT VALLEY, VA)
National Pollutant Discharge Elimination System NON-MAJOR (Tracking pollutant discharge elimination systems) - permit Business SIC classification: SPORTING AND RECREATIONAL CAMPS Alternative names: CAROLINE FURNACE CAMP STP
Housing units lacking complete plumbing facilities: 3.2% Housing units lacking complete kitchen facilities: 4.6%
38.8%Wood
31.8%Electricity
13.5%Bottled, tank, or LP gas
13.3%Fuel oil, kerosene, etc.
1.4%Other fuel
1.4%No fuel used
Population in 1990: 1,004. Population change in the 1990s: +139 (+13.8%).
Place of birth for U.S.-born residents:
This state: 1,040
Northeast: 126
Midwest: 115
South: 223
West: 13
74% of the 22652 zip code residents lived in the same house 5 years ago. Out of people who lived in different houses, 63% lived in this county. Out of people who lived in different counties, 50% lived in Virginia.
95% of the 22652 zip code residents lived in the same house 1 year ago. Out of people who lived in different houses, 36% moved from this county. Out of people who lived in different houses, 50% moved from different county within same state. Out of people who lived in different houses, 22% moved from different state.
Private vs. public school enrollment:
Students in private schools in grades 1 to 8 (elementary and middle school): 86
Here:
51.5%
Virginia:
13.2%
Students in private schools in grades 9 to 12 (high school):
Here:
0.0%
Virginia:
10.2%
Students in private undergraduate colleges:
Here:
0.0%
Virginia:
18.7%
Occupation by median earnings in the past 12 months ($)
95,206Business and financial operations occupations
89,708Management occupations
64,732Production occupations
50,369Office and administrative support occupations
36,507Building and grounds cleaning and maintenance occupations
21,115Education, training, and library occupations
Companies with federal contracts located in this zip code:
THE PRECISION COMPANY (12158 FORT VALLEY ROAD in FORT VALLEY, VA; small business) : $402,640 in 4 contractsfrom 2000 to 2002
$312,000 with Army for Air Conditioning Equipment. Signed on 2001-07-11. Completion date: 2001-10-10.
$54,640, same as above.Signed on 2000-09-28. Completion date: 2000-12-15.
$19,500 with Army for Office Furniture. Signed on 2002-12-12. Completion date: 2003-01-31.
$16,500 with Army for Air Conditioning Equipment. Signed on 2001-08-15. Completion date: 2001-10-10.
Top industries in this zip code by the number of employees in 2005:
Construction: New Single-Family Housing Construction (except Operative Builders) (10-19 employees: 1 establishment, 5-9 employees: 1 establishment, 1-4 employees: 1 establishment)
Construction: Poured Concrete Foundation and Structure Contractors (10-19: 1)
Professional, Scientific, and Technical Services: Computer Systems Design Services (5-9: 1)
Construction: Highway, Street, and Bridge Construction (5-9: 1)
Construction: Residential Remodelers (5-9: 1)
Other Services (except Public Administration): Religious Organizations (1-4: 3)
Construction: Site Preparation Contractors (1-4: 2)
Accommodation and Food Services: RV (Recreational Vehicle) Parks and Campgrounds (1-4: 1)
Accommodation and Food Services: Recreational and Vacation Camps (except Campgrounds) (1-4: 1)
Fatal accident statistics in 2011:
Fatal accident count: 1
Vehicles involved in fatal accidents: 1
Fatal accidents caused by drunken drivers: 0
Fatalities: 1
Persons involved in fatal accidents: 1
Pedestrians involved in fatal accidents: 0
2002 - 2018 National Fire Incident Reporting System (NFIRS) incidents
According to the data from the years 2002 - 2018 the average number of fire incidents per year is 12. The highest number of reported fires - 24 took place in 2013, and the least - 1 in 2011. The data has a growing trend.
When looking into fire subcategories, the most reports belonged to: Structure Fires (54.8%), and Outside Fires (34.2%).
Fire incident types reported to NFIRS in Zip Code 22652
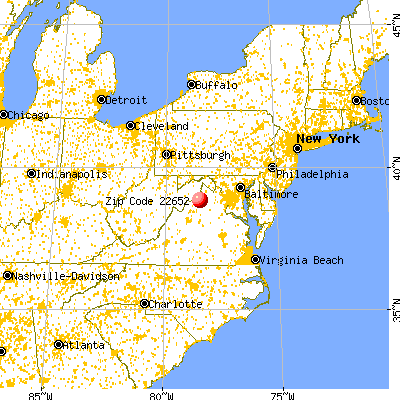


 Nearest zip codes: 22650, 22660, 22664, 22644, 22610, 22835.


 According to the data from the years 2002 - 2018 the average number of fire incidents per year is 12. The highest number of reported fires - 24 took place in 2013, and the least - 1 in 2011. The data has a growing trend.
 When looking into fire subcategories, the most reports belonged to: Structure Fires (54.8%), and Outside Fires (34.2%).