Estimated zip code population in 2022: 1,109 Zip code population in 2010: 853 Zip code population in 2000: 951
Houses and condos: 637 Renter-occupied apartments: 28
% of renters here:
5%
State:
33%
March 2022 cost of living index in zip code 22716: 84.7 (less than average, U.S. average is 100)
Land area: 25.0 sq. mi. Water area: 0.1 sq. mi.
Population density: 44 people per square mile
(very low).
OSM Map
General Map
Google Map
MSN Map
OSM Map
General Map
Google Map
MSN Map
OSM Map
General Map
Google Map
MSN Map
OSM Map
General Map
Google Map
MSN Map
Please wait while loading the map...
Real estate property taxes paid for housing units in 2022:
This zip code:
0.5% ($3,511)
Virginia:
0.7% ($2,617)
Median real estate property taxes paid for housing units with mortgages in 2022: $3,663 (0.5%) Median real estate property taxes paid for housing units with no mortgage in 2022: $2,668 (0.5%)
Business Search- 14 Million verified businesses
Males: 428
(38.6%)
Females: 681
(61.4%)
For population 25 years and over in 22716:
High school or higher: 97.4%
Bachelor's degree or higher: 18.6%
Graduate or professional degree: 8.6%
Mean travel time to work (commute): 31.5 minutes
For population 15 years and over in 22716:
Never married: 12.4%
Now married: 52.2%
Separated: 0.0%
Widowed: 20.4%
Divorced: 14.9%
Zip code 22716 compared to state average:
Median household income above state average.
Median house value above state average.
Unemployed percentage significantly below state average.
Black race population percentage below state average.
Hispanic race population percentage significantly below state average.
Median age significantly above state average.
Foreign-born population percentage significantly below state average.
Renting percentage significantly below state average.
Number of rooms per house significantly above state average.
Number of college students significantly below state average.
Percentage of population with a bachelor's degree or higher below state average.
Estimated median house/condo value in 2022: $673,284
22716:
$673,284
Virginia:
$365,700
According to our research of Virginia and other state lists, there were 3 registered sex offenders living in 22716 zip code as of June 16, 2024. The ratio of all residents to sex offenders in zip code 22716 is 346 to 1. The ratio of registered sex offenders to all residents in this zip code is near the state average.
Median resident age:
This zip code:
58.2 years
Virginia median age:
39.0 years
Average household size:
This zip code:
2.1 people
Virginia:
2.5 people
Averages for the 2020 tax year for zip code 22716, filed in 2021:
Average Adjusted Gross Income (AGI) in 2020: $87,264 (Individual Income Tax Returns)
Here:
$87,264
State:
$86,446
Salary/wage: $72,071 (reported on 73.8% of returns)
Here:
$72,071
State:
$71,185
(% of AGI for various income ranges: 1111.1% for AGIs below $25k, 3286.7% for AGIs $25k-50k, 9170.0% for AGIs $50k-75k, 8083.3% for AGIs $75k-100k, 11926.7% for AGIs $100k-200k)
Taxable interest for individuals: $3,000 (reported on 38.1% of returns)
This zip code:
$3,000
Virginia:
$1,805
(% of AGI for various income ranges: 10.0% for AGIs below $25k, 33.3% for AGIs $25k-50k, 190.0% for AGIs $50k-75k, 155.0% for AGIs $100k-200k)
Ordinary dividends: $11,691 (reported on 26.2% of returns)
Here:
$11,691
State:
$8,327
(% of AGI for various income ranges: 43.3% for AGIs below $25k, 590.0% for AGIs $50k-75k, 330.0% for AGIs $100k-200k)
Net capital gain/loss in AGI: +$29,580 (reported on 23.8% of returns)
Here:
+$29,580
State:
+$24,644
(% of AGI for various income ranges: 125.0% for AGIs $50k-75k, 825.0% for AGIs $100k-200k)
Profit/loss from business: +$8,870 (reported on 23.8% of returns)
Here:
+$8,870
State:
+$12,836
(% of AGI for various income ranges: 375.6% for AGIs below $25k, 876.7% for AGIs $25k-50k, 38.3% for AGIs $100k-200k)
Taxable individual retirement arrangement distribution: $30,075 (reported on 9.5% of returns)
22716:
$30,075
Virginia:
$21,535
(% of AGI for various income ranges: 4010.0% for AGIs $75k-100k)
Total itemized deductions: $33,486 (reported on 16.7% of returns)
Here:
$33,486
State:
$33,287
(% of AGI for various income ranges: 1916.7% for AGIs $100k-200k)
Charity contributions: $7,733 (reported on 14.3% of returns)
Here:
$7,733
State:
$10,381
(% of AGI for various income ranges: 253.3% for AGIs $75k-100k)
Taxes paid: $8,771 (reported on 16.7% of returns)
22716:
$8,771
State:
$8,284
(% of AGI for various income ranges: 551.7% for AGIs $100k-200k)
Earned income credit: $1,967 (reported on 14.3% of returns)
Here:
$1,967
State:
$2,214
(% of AGI for various income ranges: 131.1% for AGIs below $25k)
Percentage of individuals using paid preparers for their 2020 taxes: 90.5%
Here:
90%
State:
92%
(% for various income ranges: 85.7% for AGIs below $25k, 100.0% for AGIs $25k-50k, 80.0% for AGIs $50k-75k, 100.0% for AGIs $75k-100k, 85.7% for AGIs $100k-200k, 100.0% for AGIs over 200k)
Averages for the 2012 tax year for zip code 22716, filed in 2013:
Average Adjusted Gross Income (AGI) in 2012: $60,751 (Individual Income Tax Returns)
Here:
$60,751
State:
$71,192
Salary/wage: $51,557 (reported on 71.8% of returns)
Here:
$51,557
State:
$59,229
(% of AGI for various income ranges: 49.1% for AGIs below $25k, 73.0% for AGIs $25k-50k, 63.8% for AGIs $50k-75k, 69.4% for AGIs $75k-100k, 55.7% for AGIs $100k-200k)
Taxable interest for individuals: $1,288 (reported on 41.0% of returns)
This zip code:
$1,288
Virginia:
$1,600
(% of AGI for various income ranges: 1.1% for AGIs below $25k, 0.8% for AGIs $25k-50k, 1.1% for AGIs $50k-75k, 0.3% for AGIs $75k-100k, 1.0% for AGIs $100k-200k)
Ordinary dividends: $4,967 (reported on 23.1% of returns)
Here:
$4,967
State:
$6,959
(% of AGI for various income ranges: 2.4% for AGIs below $25k, 4.2% for AGIs $50k-75k, 2.4% for AGIs $100k-200k)
Net capital gain/loss in AGI: +$10,167 (reported on 15.4% of returns)
Here:
+$10,167
State:
+$16,672
(% of AGI for various income ranges: 5.8% for AGIs $100k-200k)
Profit/loss from business: +$11,682 (reported on 28.2% of returns)
Here:
+$11,682
State:
+$14,116
Taxable individual retirement arrangement distribution: $16,675 (reported on 10.3% of returns)
22716:
$16,675
Virginia:
$16,667
Total itemized deductions: $24,820 (23% of AGI, reported on 38.5% of returns)
Here:
$24,820
State:
$26,596
Here:
23.3% of AGI
State:
20.1% of AGI
(% of AGI for various income ranges: 22.3% for AGIs $25k-50k, 17.7% for AGIs $50k-75k, 17.4% for AGIs $75k-100k, 15.5% for AGIs $100k-200k)
Charity contributions: $3,755 (reported on 28.2% of returns)
Here:
$3,755
State:
$4,443
(% of AGI for various income ranges: 2.3% for AGIs below $25k, 1.5% for AGIs $50k-75k, 4.1% for AGIs $75k-100k, 1.3% for AGIs $100k-200k)
Taxes paid: $7,920 (reported on 38.5% of returns)
22716:
$7,920
State:
$9,951
(% of AGI for various income ranges: 4.8% for AGIs $25k-50k, 5.0% for AGIs $50k-75k, 4.7% for AGIs $75k-100k, 6.1% for AGIs $100k-200k)
Earned income credit: $2,471 (reported on 17.9% of returns)
Here:
$2,471
State:
$2,211
(% of AGI for various income ranges: 8.5% for AGIs below $25k)
Percentage of individuals using paid preparers for their 2012 taxes: 53.8%
Here:
54%
State:
46%
(% for various income ranges: 53.3% for AGIs below $25k, 44.4% for AGIs $25k-50k, 80.0% for AGIs $50k-75k, 40.0% for AGIs $75k-100k, 60.0% for AGIs $100k-200k)
Averages for the 2004 tax year for zip code 22716, filed in 2005:
Average Adjusted Gross Income (AGI) in 2004: $58,315 (Individual Income Tax Returns)
Here:
$58,315
State:
$56,704
Salary/wage: $49,020 (reported on 74.4% of returns)
Here:
$49,020
State:
$48,441
(% of AGI for various income ranges: 168.6% for AGIs below $10k, 65.3% for AGIs $10k-25k, 81.7% for AGIs $25k-50k, 70.7% for AGIs $50k-75k, 69.0% for AGIs $75k-100k, 50.3% for AGIs over 100k)
Taxable interest for individuals: $1,536 (reported on 54.1% of returns)
This zip code:
$1,536
Virginia:
$1,688
(% of AGI for various income ranges: 6.6% for AGIs below $10k, 2.0% for AGIs $10k-25k, 1.3% for AGIs $25k-50k, 1.5% for AGIs $50k-75k, 0.7% for AGIs $75k-100k, 1.5% for AGIs over 100k)
Taxable dividends: $2,917 (reported on 26.6% of returns)
Here:
$2,917
State:
$4,028
(% of AGI for various income ranges: 10.7% for AGIs below $10k, 2.0% for AGIs $10k-25k, 0.1% for AGIs $25k-50k, 1.4% for AGIs $50k-75k, 1.7% for AGIs $75k-100k, 1.5% for AGIs over 100k)
Net capital gain/loss: +$44,631 (reported on 20.5% of returns)
Here:
+$44,631
State:
+$14,375
(% of AGI for various income ranges: -2.0% for AGIs $10k-25k, 1.1% for AGIs $50k-75k, 1.7% for AGIs $75k-100k, 31.8% for AGIs over 100k)
Profit/loss from business: +$12,143 (reported on 20.5% of returns)
Here:
+$12,143
State:
+$13,342
(% of AGI for various income ranges: 0.0% for AGIs below $10k, 21.0% for AGIs $10k-25k, 1.8% for AGIs $25k-50k, 8.6% for AGIs $50k-75k, 2.9% for AGIs over 100k)
Total itemized deductions: $23,949 (24% of AGI, reported on 42.9% of returns)
Here:
$23,949
State:
$21,492
Here:
24.3% of AGI
State:
21.0% of AGI
(% of AGI for various income ranges: 17.2% for AGIs $10k-25k, 11.2% for AGIs $25k-50k, 18.1% for AGIs $50k-75k, 19.7% for AGIs $75k-100k, 19.2% for AGIs over 100k)
Charity contributions deductions: $5,565 (6% of AGI, reported on 35.9% of returns)
Here:
$5,565
State:
$3,794
Here:
5.6% of AGI
State:
3.5% of AGI
(% of AGI for various income ranges: 0.5% for AGIs $10k-25k, 2.1% for AGIs $25k-50k, 3.3% for AGIs $50k-75k, 1.9% for AGIs $75k-100k, 4.7% for AGIs over 100k)
Total tax: $8,417 (reported on 82.0% of returns)
22716:
$8,417
State:
$9,537
(% of AGI for various income ranges: 15.7% for AGIs below $10k, 7.3% for AGIs $10k-25k, 7.3% for AGIs $25k-50k, 8.6% for AGIs $50k-75k, 10.6% for AGIs $75k-100k, 15.2% for AGIs over 100k)
Earned income credit: $1,596 (reported on 11.5% of returns)
Here:
$1,596
State:
$1,734
Percentage of individuals using paid preparers for their 2004 taxes: 60.7%
Here:
61%
State:
52%
(% for various income ranges: 64.8% for AGIs below $10k, 59.5% for AGIs $10k-25k, 57.4% for AGIs $25k-50k, 53.3% for AGIs $50k-75k, 66.7% for AGIs $75k-100k, 67.9% for AGIs over 100k)
Household received Food Stamps/SNAP in the past 12 months: 48 Household did not receive Food Stamps/SNAP in the past 12 months: 488
Women who did not have a birth in the past 12 months: 140 (43 now married, 97 unmarried)
Housing units in zip code 22716 with a mortgage: 388 (48 second mortgage, 47 both second mortgage and home equity loan) Median monthly owner costs for units with a mortgage: $2,737 Median monthly owner costs for units without a mortgage: $473
Residents with income below the poverty level in 2022:
This zip code:
8.9%
Whole state:
10.6%
Residents with income below 50% of the poverty level in 2022:
This zip code:
7.6%
Whole state:
5.2%
Median number of rooms in houses and condos:
Here:
10.0
State:
7.0
Notable locations in this zip code not listed on our city pages
Notable locations in zip code 22716: Thornton River Camp (A), Newbus Cross Roads (B), Castleton Community Volunteer Fire Company (C). Display/hide their locations on the map
Size of family households: 349 2-persons, 33 3-persons, 17 4-persons, 12 5-persons
Size of nonfamily households: 114 1-person, 9 3-persons
18 married couples with children.
71 single-parent households (71 women).
93.2% of residents of 22716 zip code speak English at home.
7.1% of residents speak other language at home (76% very well, 24% well).
Foreign born population: 39 (3.5%) (100.0% of them are naturalized citizens)
This zip code:
3.5%
Whole state:
12.7%
111%Georgia
22%Italian
15%Swiss
10%Polish
8%Arab
8%Irish
8%English
4%French
Year of entry for the foreign-born population
662010 or later
182000 to 2009
01990 to 1999
47Before 1990
Housing units lacking complete plumbing facilities: 1.8% Housing units lacking complete kitchen facilities: 1.9%
55.1%Bottled, tank, or LP gas
29.6%Electricity
11.5%Wood
2.1%Utility gas
2.1%Other fuel
Population in 1990: 536. Population change in the 1990s: +415 (+77.4%).
Place of birth for U.S.-born residents:
This state: 399
Northeast: 260
Midwest: 154
South: 154
West: 11
68% of the 22716 zip code residents lived in the same house 5 years ago. Out of people who lived in different houses, 43% lived in this county. Out of people who lived in different counties, 50% lived in Virginia.
99% of the 22716 zip code residents lived in the same house 1 year ago. Out of people who lived in different houses, 158% moved from different county within same state.
Private vs. public school enrollment:
Students in private schools in grades 1 to 8 (elementary and middle school): 21
Here:
35.8%
Virginia:
13.2%
Students in private schools in grades 9 to 12 (high school):
Here:
0.0%
Virginia:
10.2%
Occupation by median earnings in the past 12 months ($)
161,043Computer and mathematical occupations
78,929Business and financial operations occupations
67,569Management occupations
36,579Office and administrative support occupations
Top industries in this zip code by the number of employees in 2005:
Construction: All Other Specialty Trade Contractors (5-9 employees: 1 establishment)
Construction: Plumbing, Heating, and Air-Conditioning Contractors (1-4: 1)
Finance and Insurance: Portfolio Management (1-4: 1)
Construction: New Single-Family Housing Construction (except Operative Builders) (1-4: 1)
Administrative and Support and Waste Management and Remediation Services: Landscaping Services (1-4: 1)
Other Services (except Public Administration): Pet Care (except Veterinary) Services (1-4: 1)
2002 - 2018 National Fire Incident Reporting System (NFIRS) incidents
According to the data from the years 2002 - 2018 the average number of fire incidents per year is 24. The highest number of fire incidents - 42 took place in 2018, and the least - 7 in 2003. The data has an increasing trend.
When looking into fire subcategories, the most reports belonged to: Outside Fires (43.7%), and Structure Fires (39.7%).
Fire incident types reported to NFIRS in Zip Code 22716

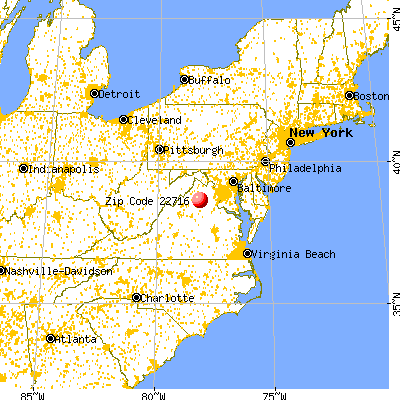


 Nearest zip codes: 22713, 22749, 22747, 22737, 20106, 22627.


 According to the data from the years 2002 - 2018 the average number of fire incidents per year is 24. The highest number of fire incidents - 42 took place in 2018, and the least - 7 in 2003. The data has an increasing trend.
 When looking into fire subcategories, the most reports belonged to: Outside Fires (43.7%), and Structure Fires (39.7%).