Averages for the 2020 tax year for zip code 23523, filed in 2021:
Average Adjusted Gross Income (AGI) in 2020: $29,472 (Individual Income Tax Returns)
Here:
$29,472
State:
$86,446
Salary/wage: $27,090 (reported on 89.5% of returns)
Here:
$27,090
State:
$71,185
(% of AGI for various income ranges: 1101.6% for AGIs below $25k, 3609.8% for AGIs $25k-50k, 7068.7% for AGIs $50k-75k, 12628.3% for AGIs $75k-100k, 19010.0% for AGIs $100k-200k)
Taxable interest for individuals: $317 (reported on 6.7% of returns)
This zip code:
$317
Virginia:
$1,805
(% of AGI for various income ranges: 0.5% for AGIs below $25k, 1.1% for AGIs $25k-50k, 3.5% for AGIs $50k-75k, 11.7% for AGIs $75k-100k, 100.0% for AGIs $100k-200k)
Ordinary dividends: $229 (reported on 2.0% of returns)
Here:
$229
State:
$8,327
(% of AGI for various income ranges: 0.5% for AGIs below $25k, 3.0% for AGIs $50k-75k)
Net capital gain/loss in AGI: +$2,933 (reported on 2.6% of returns)
Here:
+$2,933
State:
+$24,644
(% of AGI for various income ranges: 0.1% for AGIs below $25k, 5.0% for AGIs $25k-50k, 93.5% for AGIs $50k-75k)
Profit/loss from business: +$2,249 (reported on 14.8% of returns)
Here:
+$2,249
State:
+$12,836
(% of AGI for various income ranges: 65.2% for AGIs below $25k, 511.7% for AGIs $75k-100k)
Taxable individual retirement arrangement distribution: $9,700 (reported on 1.5% of returns)
23523:
$9,700
Virginia:
$21,535
(% of AGI for various income ranges: 20.6% for AGIs $25k-50k, 126.5% for AGIs $50k-75k)
Total itemized deductions: $23,774 (reported on 5.5% of returns)
Here:
$23,774
State:
$33,287
(% of AGI for various income ranges: 186.5% for AGIs $25k-50k, 653.5% for AGIs $50k-75k, 1036.7% for AGIs $75k-100k, 1597.5% for AGIs $100k-200k)
Charity contributions: $7,853 (reported on 4.4% of returns)
Here:
$7,853
State:
$10,381
(% of AGI for various income ranges: 41.7% for AGIs $25k-50k, 169.6% for AGIs $50k-75k, 263.3% for AGIs $75k-100k, 595.0% for AGIs $100k-200k)
Taxes paid: $4,826 (reported on 5.5% of returns)
23523:
$4,826
State:
$8,284
(% of AGI for various income ranges: 25.6% for AGIs $25k-50k, 132.2% for AGIs $50k-75k, 298.3% for AGIs $75k-100k, 482.5% for AGIs $100k-200k)
Earned income credit: $2,863 (reported on 44.5% of returns)
Here:
$2,863
State:
$2,214
(% of AGI for various income ranges: 197.7% for AGIs below $25k, 121.1% for AGIs $25k-50k)
Percentage of individuals using paid preparers for their 2020 taxes: 93.6%
Here:
94%
State:
92%
(% for various income ranges: 94.0% for AGIs below $25k, 93.6% for AGIs $25k-50k, 90.6% for AGIs $50k-75k, 90.9% for AGIs $75k-100k, 100.0% for AGIs $100k-200k)
Averages for the 2012 tax year for zip code 23523, filed in 2013:
Average Adjusted Gross Income (AGI) in 2012: $23,832 (Individual Income Tax Returns)
Here:
$23,832
State:
$71,192
Salary/wage: $22,558 (reported on 87.2% of returns)
Here:
$22,558
State:
$59,229
(% of AGI for various income ranges: 78.0% for AGIs below $25k, 88.1% for AGIs $25k-50k, 85.7% for AGIs $50k-75k, 80.5% for AGIs $75k-100k, 75.1% for AGIs $100k-200k)
Taxable interest for individuals: $204 (reported on 7.6% of returns)
This zip code:
$204
Virginia:
$1,600
(% of AGI for various income ranges: 0.1% for AGIs $75k-100k)
Ordinary dividends: $320 (reported on 1.5% of returns)
Here:
$320
State:
$6,959
Profit/loss from business: +$7,235 (reported on 14.9% of returns)
Here:
+$7,235
State:
+$14,116
(% of AGI for various income ranges: 12.3% for AGIs below $25k, 0.3% for AGIs $25k-50k)
Taxable individual retirement arrangement distribution: $9,180 (reported on 1.5% of returns)
23523:
$9,180
Virginia:
$16,667
Total itemized deductions: $17,022 (34% of AGI, reported on 16.7% of returns)
Here:
$17,022
State:
$26,596
Here:
33.6% of AGI
State:
20.1% of AGI
(% of AGI for various income ranges: 4.4% for AGIs below $25k, 13.6% for AGIs $25k-50k, 19.6% for AGIs $50k-75k, 18.8% for AGIs $75k-100k, 17.9% for AGIs $100k-200k)
Charity contributions: $3,674 (reported on 13.1% of returns)
Here:
$3,674
State:
$4,443
(% of AGI for various income ranges: 0.7% for AGIs below $25k, 2.3% for AGIs $25k-50k, 3.6% for AGIs $50k-75k, 2.9% for AGIs $75k-100k, 3.1% for AGIs $100k-200k)
Taxes paid: $4,574 (reported on 16.4% of returns)
23523:
$4,574
State:
$9,951
(% of AGI for various income ranges: 1.1% for AGIs below $25k, 3.3% for AGIs $25k-50k, 4.9% for AGIs $50k-75k, 5.6% for AGIs $75k-100k, 6.1% for AGIs $100k-200k)
Earned income credit: $2,929 (reported on 51.4% of returns)
Here:
$2,929
State:
$2,211
(% of AGI for various income ranges: 15.9% for AGIs below $25k, 1.8% for AGIs $25k-50k)
Percentage of individuals using paid preparers for their 2012 taxes: 36.2%
Here:
36%
State:
46%
(% for various income ranges: 32.6% for AGIs below $25k, 38.7% for AGIs $25k-50k, 55.0% for AGIs $50k-75k, 55.6% for AGIs $75k-100k, 50.0% for AGIs $100k-200k)
Averages for the 2004 tax year for zip code 23523, filed in 2005:
Average Adjusted Gross Income (AGI) in 2004: $19,809 (Individual Income Tax Returns)
Here:
$19,809
State:
$56,704
Salary/wage: $18,901 (reported on 92.3% of returns)
Here:
$18,901
State:
$48,441
(% of AGI for various income ranges: 95.1% for AGIs below $10k, 88.1% for AGIs $10k-25k, 87.9% for AGIs $25k-50k, 90.8% for AGIs $50k-75k, 87.7% for AGIs $75k-100k, 52.6% for AGIs over 100k)
Taxable interest for individuals: $541 (reported on 10.4% of returns)
This zip code:
$541
Virginia:
$1,688
(% of AGI for various income ranges: 0.4% for AGIs below $10k, 0.2% for AGIs $10k-25k, 0.4% for AGIs $25k-50k, 0.2% for AGIs $50k-75k, 0.4% for AGIs $75k-100k)
Taxable dividends: $261 (reported on 2.9% of returns)
Here:
$261
State:
$4,028
(% of AGI for various income ranges: 0.0% for AGIs $10k-25k, 0.1% for AGIs $25k-50k, 0.0% for AGIs $50k-75k, 0.1% for AGIs $75k-100k)
Net capital gain/loss: +$878 (reported on 1.6% of returns)
Here:
+$878
State:
+$14,375
Profit/loss from business: +$3,473 (reported on 6.1% of returns)
Here:
+$3,473
State:
+$13,342
(% of AGI for various income ranges: 1.5% for AGIs below $10k, 2.2% for AGIs $10k-25k, 0.3% for AGIs $25k-50k, 0.6% for AGIs $50k-75k)
IRA payment deduction: $1,000 (reported on 0.7% of returns)
23523:
$1,000
Virginia:
$2,943
Total itemized deductions: $14,255 (35% of AGI, reported on 13.3% of returns)
Here:
$14,255
State:
$21,492
Here:
34.6% of AGI
State:
21.0% of AGI
(% of AGI for various income ranges: 5.0% for AGIs $10k-25k, 12.9% for AGIs $25k-50k, 15.7% for AGIs $50k-75k, 23.0% for AGIs $75k-100k)
Charity contributions deductions: $3,939 (9% of AGI, reported on 11.9% of returns)
Here:
$3,939
State:
$3,794
Here:
9.4% of AGI
State:
3.5% of AGI
(% of AGI for various income ranges: 1.1% for AGIs $10k-25k, 2.9% for AGIs $25k-50k, 4.8% for AGIs $50k-75k, 6.3% for AGIs $75k-100k)
Total tax: $2,117 (reported on 47.3% of returns)
23523:
$2,117
State:
$9,537
(% of AGI for various income ranges: 1.1% for AGIs below $10k, 2.4% for AGIs $10k-25k, 5.3% for AGIs $25k-50k, 8.6% for AGIs $50k-75k, 10.6% for AGIs $75k-100k, 19.9% for AGIs over 100k)
Earned income credit: $2,115 (reported on 51.5% of returns)
Here:
$2,115
State:
$1,734
Percentage of individuals using paid preparers for their 2004 taxes: 61.7%
Here:
62%
State:
52%
(% for various income ranges: 61.9% for AGIs below $10k, 63.2% for AGIs $10k-25k, 58.0% for AGIs $25k-50k, 61.7% for AGIs $50k-75k, 93.1% for AGIs $75k-100k)
Household received Food Stamps/SNAP in the past 12 months: 1,470 Household did not receive Food Stamps/SNAP in the past 12 months: 1,747
Women who had a birth in the past 12 months: 168 (58 now married, 104 unmarried) Women who did not have a birth in the past 12 months: 1,726 (328 now married, 1,414 unmarried)
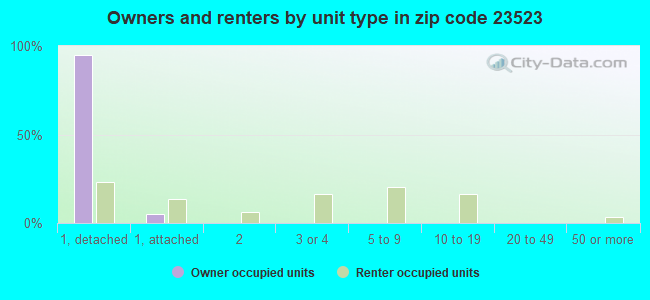
Housing units in zip code 23523 with a mortgage: 733 (75 second mortgage, 17 home equity loan, 22 both second mortgage and home equity loan) Houses without a mortgage: 13
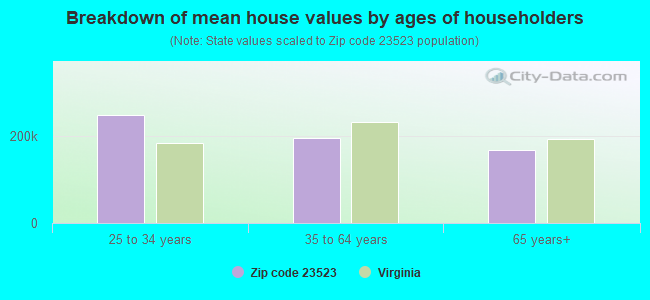
Median monthly owner costs for units with a mortgage: $1,668 Median monthly owner costs for units without a mortgage: $427
Residents with income below the poverty level in 2022:
This zip code:
36.8%
Whole state:
10.6%
Residents with income below 50% of the poverty level in 2022:
This zip code:
17.7%
Whole state:
5.2%
Median number of rooms in houses and condos:
Here:
6.5
State:
7.0
Median number of rooms in apartments:
Here:
4.6
State:
4.3
Notable locations in this zip code not listed on our city pages
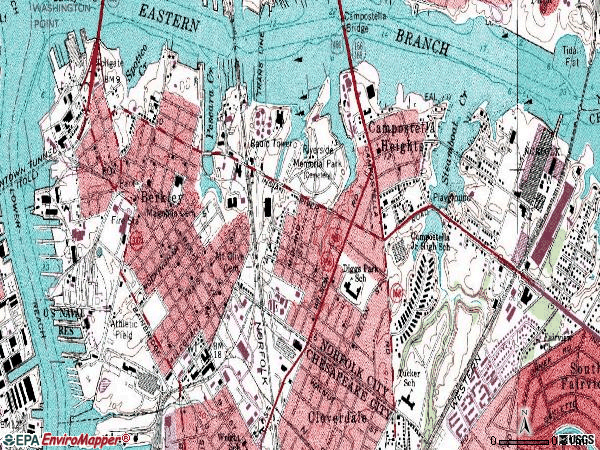
Churches in zip code 23523 include: Campostella Seventh Day Adventist Church (A), Morning Star United Holy Church (B), Metropolitan African Methodist Episcopal Church (C), Saint Paul Church of God in Christ (D), First Baptist Church (E), New Rising Sun United Holy Church (F), Smyrna Community Church (G), Center of Love Church of God (H), Saint Mark United Church of Christ (I). Display/hide their locations on the map
In group quarters: 4 (-1 institutionalized population)
Size of family households: 635 2-persons, 494 3-persons, 260 4-persons, 158 5-persons, 37 6-persons, 151 7-or-more-persons
Size of nonfamily households: 1,196 1-person, 85 2-persons, 16 3-persons
362 married couples with children.
1,268 single-parent households (42 men, 1,226 women).
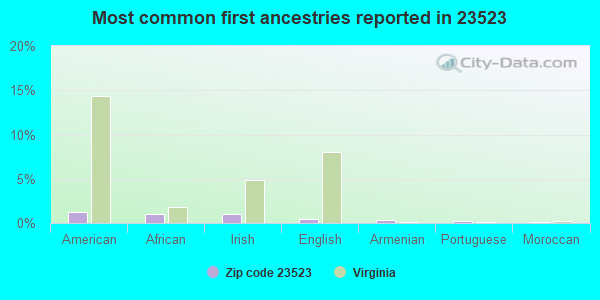
95.0% of residents of 23523 zip code speak English at home.
2.5% of residents speak Spanish at home (85% very well, 15% well).
0.6% of residents speak other Indo-European language at home (100% very well).
1.0% of residents speak other language at home (100% very well).
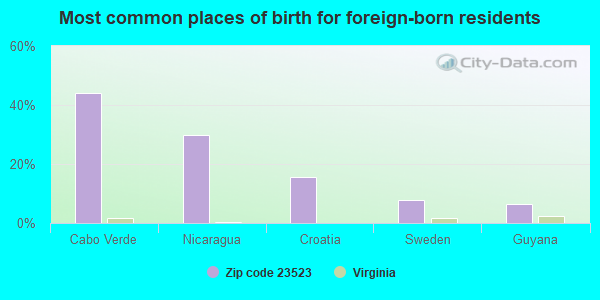
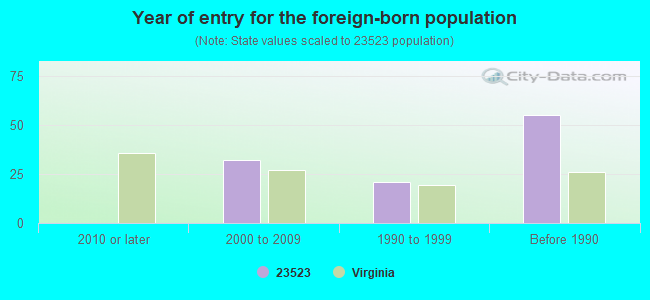
Foreign born population: 79 (1.1%) (90.5% of them are naturalized citizens)
Facilities with environmental interests located in this zip code:
AMERICAN WASTE INDUSTRIES INCORPORATED (508 E INDIAN RIVER RD in NORFOLK, VA)
AIR MINOR (AIRS/AFS) STATE MASTER (Virginia pollutants databases) - CEDS-61038, AIR PROGRAM (Integrated Compliance Information System) - ICIS-03-2000-0056, FORMAL ENFORCEMENT ACTION COMPLIANCE ACTIVITY (Tracking inspections of insecticide, fungicide, and rodenticide, and toxic substances) CRITERIA AND HAZARDOUS AIR POLLUTANT INVENTORY (Inventory of air pollution sources) STATE MASTER (New Jersey environmental info) - NJEMS-239418, REFUSE DISPOSAL (Resource Conservation and Recovery Act (tracking hazardous waste)) Business SIC classification: SEWERAGE SYSTEMS; REFUSE SYSTEMS Business NAICS classification: SEWAGE TREATMENT FACILITIES. Organizations: T&S ASSOCIATES (CONTACT/OWNER)
Alternative names: AMERICAN WASTE INDUSTRIES, INCORPORATED, CANNON HYGIENE/AWI OF VA
ALLIED TERMINALS INCORPORATED - NORFOLK (1000 LANSING STREET in NORFOLK, VA)
AIR MINOR (AIRS/AFS) STATE MASTER (Virginia pollutants databases) - CEDS-60912, AIR PROGRAM OIL CONTROL (Facility Response Plan for oil discharge) CRITERIA AND HAZARDOUS AIR POLLUTANT INVENTORY (Inventory of air pollution sources) Business SIC classification: SPECIAL WAREHOUSING AND STORAGE Business NAICS classification: OTHER WAREHOUSING AND STORAGE. Alternative names: NORFOLK MARINE TERMINAL
BERKLEY MACHINE WORKS AND FOUNDARY (703 PEARL STREET in NORFOLK, VA)
AIR MINOR (AIRS/AFS) STATE MASTER (Virginia pollutants databases) - CEDS-60332, AIR PROGRAM Business SIC classification: GRAY AND DUCTILE IRON FOUNDRIES; ALUMINUM FOUNDRIES; COPPER FOUNDRIES Business NAICS classification: IRON FOUNDRIES. Alternative names: BERKLEY MACHINE WKS & FNDRY, BERKLEY MACHINE WORKS AND FOUNDRY
ALLIED TOWING CORPORATION (100 AVORY STREET in NORFOLK, VA)
(Resource Conservation and Recovery Act (tracking hazardous waste)) Organizations: OPERNAME (CONTACT/OPERATOR)
, OWNERNAME (CONTACT/OWNER)
, ALLIED REPAIR SERVICE INC (CONTACT/OWNER)
Alternative names: ALLIED REPAIR SERVICE INC
CAMPOSTELLA ELEM. (1106 CAMPOSTELLA RD in NORFOLK, VA)
(National Center for Education Statistics) - STATE ID-1180770 Organizations: NORFOLK CITY PUBLIC SCHOOLS (SCHOOL DISTRICT)
7-ELEVEN #23434 (1618 EAST INDIAN RIVER ROAD in NORFOLK, VA)
(Resource Conservation and Recovery Act (tracking hazardous waste)) Organizations: OPERNAME (CONTACT/OPERATOR)
, THE SOUTHLAND CORP (CONTACT/OWNER)
BEST FOODS A UNIT OF CPC NORTH AMERICA (INDIAN RIVER RD & LANSING ST in NORFOLK, VA)
(Resource Conservation and Recovery Act (tracking hazardous waste)) Organizations: OPERNAME (CONTACT/OPERATOR)
, BEST FOODS CPC INTERNATIONAL INC (CONTACT/OWNER)
ALBANO CLEANERS INC (1115 CAMPOSTELLA RD in NORFOLK, VA)
APPLIED TECHNOLOGY INTERNATIONAL LTD (1000 LANSING STREET in NORFOLK, VA)
(Resource Conservation and Recovery Act (tracking hazardous waste))
BAY GULF TRADING CO LTD (150A S MAIN ST in NORFOLK, VA)
TRANSPORTER (Resource Conservation and Recovery Act (tracking hazardous waste)) - notification USED OIL PROGRAM (Resource Conservation and Recovery Act (tracking hazardous waste)) Organizations: ELM ENTERPRISES (CONTACT/OWNER)
CAMPOSTELLA BUILDERS & SUPPLY CORP (1109 POPPLETON ST in NORFOLK, VA)
Conditionally Exempt Small Quantity Generators, less than 100 kg/month of hazardous waste (Resource Conservation and Recovery Act (tracking hazardous waste)) - notification Organizations: OPERNAME (CONTACT/OPERATOR)
, PALMER FRANK M (CONTACT/OWNER)
CAMPOSTELLA MIDDLE SCHOOLS (1106 CAMPOSTELLA RD in NORFOLK, VA)
Small Quantity Generators, between 100 kg and 1000 kg of hazardous waste/month (Resource Conservation and Recovery Act (tracking hazardous waste)) - notification Organizations: OPERNAME (CONTACT/OPERATOR)
, NORFOLK PUBLIC SCHOOLS (CONTACT/OWNER)
Housing units lacking complete plumbing facilities: 1.6% Housing units lacking complete kitchen facilities: 1.0%
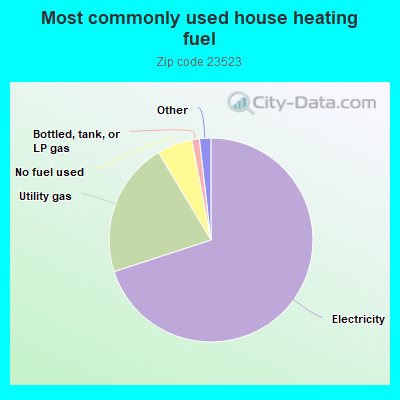
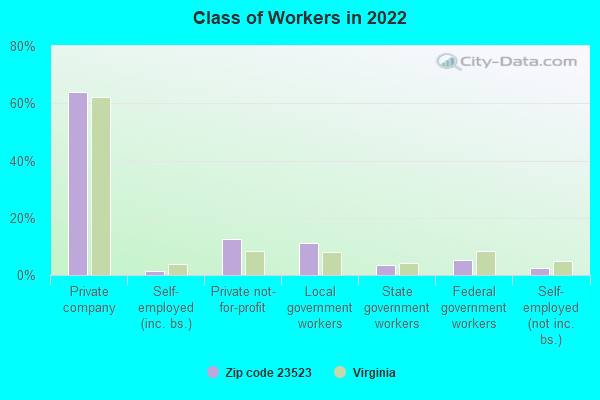
70.0%Electricity
21.4%Utility gas
5.6%No fuel used
1.2%Bottled, tank, or LP gas
1.0%Fuel oil, kerosene, etc.
0.9%Other fuel
Population in 1990: 8,682.
Place of birth for U.S.-born residents:
This state: 5,745
Northeast: 192
Midwest: 110
South: 1,071
West: 119
57% of the 23523 zip code residents lived in the same house 5 years ago. Out of people who lived in different houses, 77% lived in this county. Out of people who lived in different counties, 50% lived in Virginia.
89% of the 23523 zip code residents lived in the same house 1 year ago. Out of people who lived in different houses, 61% moved from this county. Out of people who lived in different houses, 35% moved from different county within same state.
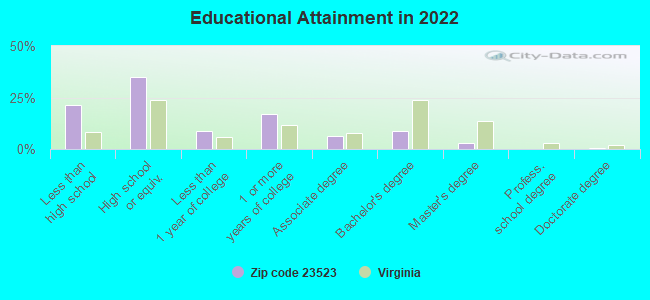
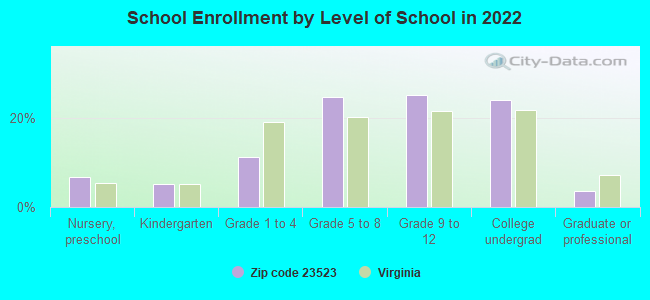
Private vs. public school enrollment:
Students in private schools in grades 1 to 8 (elementary and middle school): 19
Here:
2.3%
Virginia:
13.2%
Students in private schools in grades 9 to 12 (high school): 48
Here:
8.1%
Virginia:
10.2%
Students in private undergraduate colleges: 197
Here:
35.2%
Virginia:
18.7%
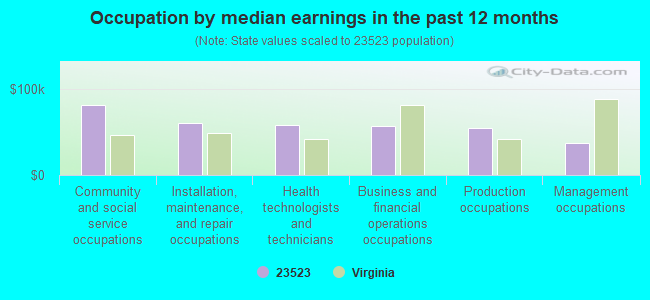
Occupation by median earnings in the past 12 months ($)
81,257Community and social service occupations
60,654Installation, maintenance, and repair occupations
58,890Health technologists and technicians
56,817Business and financial operations occupations
54,768Production occupations
37,698Management occupations
Companies with biggest federal contracts located in this zip code (NORFOLK, VA):
NORFOLK SHIPBUILDING & DRYDOCK (750 WEST BERKLEY AVENUE) : $987,354,685 in 2233 contractsfrom 1999 to 2006
Contracts for Cruisers, Non-nuclear Ship Repair (East) Ship repair (including overhauls and conversions) performed on non-nuclear propelled and nonpropelled ships east of the 108th meridian, Maintenance, Repair and Rebuilding of Equipment -- Ships, Small Craft, Pontoons, and Floating Docks, Technical Representation Services -- Ships, Small Craft, Pontoons, and Floating Docks, and moreby Navy, U.S. Army Corps of Engineers - civil program financing only, Army, United States Coast Guard (disused code: now 7008), and others Signed by year:2000: $72,881,341; 2001: $129,233,759; 2002: $201,356,896; 2003: $211,108,854; 2004: $131,858,807; 2005: $82,645,911; 2006: $99,542,820.
Biggest contracts:
$27,947,320 with Navy for Cruisers. Signed on 2006-05-18. Completion date: 2011-08-17.
$24,447,146 with Navy for Non-nuclear Ship Repair (East) Ship repair (including overhauls and conversions) performed on non-nuclear propelled and nonpropelled ships east of the 108th meridian. Signed on 2002-10-14. Completion date: 2003-04-04.
$21,975,514, same as above.Signed on 2004-04-07. Completion date: 2004-10-27.
$21,694,925 with Navy for Non-nuclear Ship Repair (East) Ship repair (including overhauls and conversions) performed on non-nuclear propelled and nonpropelled ships east of the 108th meridian. Taking place in FL. Signed on 2002-11-25. Completion date: 2003-09-16.
METRO MACHINE CORP (200 LIGON STREET; small business) 750 employees, $0 revenue. : $834,449,222 in 854 contractsfrom 1999 to 2006
Contracts for Non-nuclear Ship Repair (East) Ship repair (including overhauls and conversions) performed on non-nuclear propelled and nonpropelled ships east of the 108th meridian, Other Defense -- Applied Research and Exploratory Development (R&D), Salvage Vessels, Construction of Structures and Facilities -- Ship Construction and Repair Facilities, and moreby Navy Signed by year:2000: $137,793,218; 2001: $75,055,325; 2002: $116,915,422; 2003: $150,295,048; 2004: $143,576,421; 2005: $156,102,314; 2006: $4,821,074.
Biggest contracts:
$67,151,794 with Navy for Non-nuclear Ship Repair (East) Ship repair (including overhauls and conversions) performed on non-nuclear propelled and nonpropelled ships east of the 108th meridian. Signed on 2005-11-01. Completion date: 2005-11-01.
$42,842,231, same as above.Signed on 2004-01-28. Completion date: 2004-10-15.
$36,912,471, same as above.Signed on 1999-11-05. Completion date: 2000-03-31.
$25,000,000, same as above.Signed on 2003-08-04. Completion date: 2004-06-30.
MARINE HYDRAULICS INTERNATIONA (543 EAST INDIAN RIVER ROAD; small business) 1000 employees, $0 revenue. Veteran Owned Business: $175,514,204 in 722 contractsfrom 1999 to 2006
Contracts for Non-nuclear Ship Repair (East) Ship repair (including overhauls and conversions) performed on non-nuclear propelled and nonpropelled ships east of the 108th meridian, Non-nuclear Ship Repair (West) Ship repair (including overhauls and conversions) performed on. non-nuclear propelled and nonpropelled ships west of the 108th meridian, Fueling and Other Petroleum Services - Excluding Storage, Vessel Towing Service, and moreby Navy, Maritime Administration, Army Signed by year:2000: $20,217,808; 2001: $33,116,349; 2002: $15,554,478; 2003: $34,511,455; 2004: $18,421,828; 2005: $23,216,421; 2006: $22,414,067.
Biggest contracts:
$17,900,436 with Navy for Non-nuclear Ship Repair (East) Ship repair (including overhauls and conversions) performed on non-nuclear propelled and nonpropelled ships east of the 108th meridian. Signed on 2003-05-23. Completion date: 2004-02-24.
$5,055,034, same as above.Signed on 2006-01-13. Completion date: 2010-09-29.
$4,750,943, same as above.Signed on 2001-08-27. Completion date: 2002-01-30.
$4,466,859, same as above.Signed on 2001-06-08. Completion date: 2001-10-05.
COLONNAS SHIPYARD, INC (400 E INDIAN RIVER ROAD; small business) 500 employees, $0 revenue: $83,546,144 in 276 contractsfrom 1999 to 2006
Contracts for Non-nuclear Ship Repair (East) Ship repair (including overhauls and conversions) performed on non-nuclear propelled and nonpropelled ships east of the 108th meridian, Ship and Boat Propulsion Components, Maintenance, Repair and Rebuilding of Equipment -- Miscellaneous, Maintenance, Repair and Rebuilding of Equipment -- Plumbing, Heating, and Waste Disposal Equipment, and moreby Navy, Army, U.S. Coast Guard, United States Coast Guard (disused code: now 7008), and others Signed by year:2000: $8,155,403; 2001: $671,923; 2002: $16,879,740; 2003: $21,081,535; 2004: $8,043,265; 2005: $17,700,402; 2006: $8,392,687.
Biggest contracts:
$7,679,722 with Navy for Non-nuclear Ship Repair (East) Ship repair (including overhauls and conversions) performed on non-nuclear propelled and nonpropelled ships east of the 108th meridian. Signed on 2003-04-16. Completion date: 2003-10-03.
$5,554,254, same as above.Signed on 2005-01-26. Completion date: 2005-06-16.
$4,979,810, same as above.Signed on 2006-03-29. Completion date: 2006-03-28.
$4,359,604, same as above.Signed on 2000-11-13. Completion date: 2001-02-20.
BAY GULF TRADING COMPANY, LTD (150 SOUTH MAIN STREET; small business) : $4,125,864 in 8 contractsfrom 2000 to 2004
Contracts for Motor Pool Operations, Stevedoring, Barges And Lighters, Cargo, Hazardous Substance Removal, Cleanup, and Disposal Services and Operational Support by Army, Navy Signed by year:2000: $1,274,907; 2001: $1,306,300; 2002: $1,338,457; 2003: $0; 2004: $206,200; 2005: $0; 2006: $0.
Biggest contracts:
$1,338,457 with Army for Motor Pool Operations. Signed on 2002-05-23. Completion date: 2002-06-03.
$1,306,300, same as above.Signed on 2001-04-26. Completion date: 2002-06-03.
$1,274,907 with Army for Stevedoring. Taking place in NJ. Signed on 2000-06-04. Completion date: 2001-06-03.
$102,950 with Army for Barges And Lighters, Cargo. Signed on 2004-02-17. Completion date: 2008-06-03.
PACORD INC (2117 SPRINGFIELD AVE) : $3,738,668 in 199 contractsfrom 2000 to 2006
Contracts for Circuit Breakers, Maintenance, Repair and Rebuilding of Equipment -- Communication, Detection, and Coherent Radiation Equipment, Non-nuclear Ship Repair (West) Ship repair (including overhauls and conversions) performed on. non-nuclear propelled and nonpropelled ships west of the 108th meridian, Technical Representation Services -- Ship and Marine Equipment, and moreby Navy Signed by year:2000: -$33,001; 2001: $28,469; 2002: $51,372; 2003: $291,438; 2004: $1,960,009; 2005: $600,141; 2006: $840,240.
Biggest contracts:
$187,265 with Navy for Circuit Breakers. Taking place in KY. Signed on 2004-11-17. Completion date: 2005-11-17.
$93,616 with Navy for Circuit Breakers. Signed on 2004-02-26. Completion date: 2004-05-26.
$93,118, same as above.Signed on 2003-12-17. Completion date: 2004-04-30.
$88,095, same as above.Signed on 2004-05-19. Completion date: 2004-10-31.
KERNEY SERVICE GROUP INC (1601 S MAIN ST; small business) 50 employees, $0 revenue. : $2,100,378 in 111 contractsfrom 1999 to 2003
Contracts for Non-nuclear Ship Repair (East) Ship repair (including overhauls and conversions) performed on non-nuclear propelled and nonpropelled ships east of the 108th meridian by Navy Signed by year:2000: $1,023,692; 2001: $164,808; 2002: $114,204; 2003: $85,717; 2004: $0; 2005: $0; 2006: $0.
Biggest contracts:
$327,698 with Navy for Non-nuclear Ship Repair (East) Ship repair (including overhauls and conversions) performed on non-nuclear propelled and nonpropelled ships east of the 108th meridian. Signed on 1999-12-02. Completion date: 2000-03-22.
$85,717, same as above.Signed on 2003-03-03. Completion date: 2003-03-05.
$85,000, same as above.Signed on 2000-06-30. Completion date: 2000-07-11.
$66,220, same as above.Signed on 2000-01-20. Completion date: 2000-02-10.
JALBERT ENVIRONMENTAL, INCORPO (150 SOUTH MAIN STREET; small business) : $1,201,140 in 5 contractsfrom 2001 to 2005
Contracts for Maintenance, Repair or Alteration of Real Property -- Waste Treatment and Storage Facilities, Gas Services, Power and Hand Pumps, Water Purification Equipment, and moreby Navy Signed by year:2000: $0; 2001: $216,944; 2002: $0; 2003: $0; 2004: $930,000; 2005: $54,196; 2006: $0.
Biggest contracts:
$930,000 with Navy for Maintenance, Repair or Alteration of Real Property -- Waste Treatment and Storage Facilities. Signed on 2004-06-17. Completion date: 2005-06-30.
$211,944 with Navy for Gas Services. Signed on 2001-05-02. Completion date: 2001-10-27.
$27,526 with Navy for Power and Hand Pumps. Taking place in NY. Signed on 2005-05-13. Completion date: 2005-08-20.
$26,670 with Navy for Water Purification Equipment. Signed on 2005-05-18. Completion date: 2005-07-05.
ALLIANCE DEVELOPMENT CORP (725 C EAST LIBERTY STREE; small business) : $968,377 in 7 contractsfrom 2001 to 2004
Contracts for Maintenance, Repair or Alteration of Real Property -- Other Administrative Facilities and Service Buildings, Hazardous Substance Removal, Cleanup, and Disposal Services and Operational Support, Engineering and Technical Services by Air Force, Defense Logistics Agency, Army, U.S. Army Corps of Engineers - civil program financing only, and others Signed by year:2000: $0; 2001: $400,000; 2002: $536,424; 2003: $627; 2004: $31,326; 2005: $0; 2006: $0.
Biggest contracts:
$400,000 with Air Force for Maintenance, Repair or Alteration of Real Property -- Other Administrative Facilities and Service Buildings. Signed on 2001-09-28. Completion date: 2001-09-29.
$250,000, same as above.Signed on 2002-04-26. Completion date: 2002-09-29.
$240,000, same as above.Signed on 2002-09-30. Completion date: 2003-09-29.
$46,424 with Defense Logistics Agency for Hazardous Substance Removal, Cleanup, and Disposal Services and Operational Support. Signed on 2002-09-13. Completion date: 2002-10-13.
AMERICAN WASTE INDUSTRIES, INC (508 EAST INDIAN RIVER ROAD; small business) : $778,750 in 59 contractsfrom 2001 to 2006
Contracts for Trash/Garbage Collection Services - Including Portable Sanitation Services, Hazardous Substance Removal, Cleanup, and Disposal Services and Operational Support, Facilities Operations Support Services, Other Housekeeping Services, and moreby Department of Veterans Affairs, Navy, Air Force, Army, and others Signed by year:2000: $0; 2001: $32,400; 2002: $298,451; 2003: $292,947; 2004: -$50,628; 2005: $169,580; 2006: $36,000.
Biggest contracts:
$103,248 with Department of Veterans Affairs for Trash/Garbage Collection Services - Including Portable Sanitation Services. Signed on 2003-10-01. Completion date: 2004-09-30.
$83,731 with Department of Veterans Affairs for Hazardous Substance Removal, Cleanup, and Disposal Services and Operational Support. Signed on 2005-10-01. Completion date: 2006-09-30.
$83,731, same as above.Signed on 2003-11-01. Completion date: 2004-09-30.
$72,000 with Navy for Trash/Garbage Collection Services - Including Portable Sanitation Services. Signed on 2004-06-01. Completion date: 2005-05-31.
Top industries in this zip code by the number of employees in 2005:
Administrative and Support and Waste Management and Remediation Services: Temporary Help Services (50-99 employees: 1 establishment, 20-49 employees: 1 establishment, 1-4 employees: 1 establishment)
Accommodation and Food Services: Limited-Service Restaurants (20-49: 2, 10-19: 1)
Construction: Electrical Contractors (50-99: 1)
Other Services (except Public Administration): Labor Unions and Similar Labor Organizations (50-99: 1)
People in group quarters in 2010:
18 people in maritime/merchant vessels
17 people in other noninstitutional facilities
7 people in workers' group living quarters and job corps centers
5 people in group homes for juveniles (non-correctional)
People in group quarters in 2000:
10 people in other noninstitutional group quarters
Fatal accident statistics in 2014:
Fatal accident count: 1
Vehicles involved in fatal accidents: 1
Fatal accidents caused by drunken drivers: 0
Fatalities: 1
Persons involved in fatal accidents: 1
Pedestrians involved in fatal accidents: 0
Fatal accident statistics in 2013:
Fatal accident count: 1
Vehicles involved in fatal accidents: 1
Fatal accidents caused by drunken drivers: 0
Fatalities: 1
Persons involved in fatal accidents: 1
Pedestrians involved in fatal accidents: 1
Home Mortgage Disclosure Act Aggregated Statistics For Year 2009 (Based on 4 full and 4 partial tracts)
A) FHA, FSA/RHS & VA Home Purchase Loans
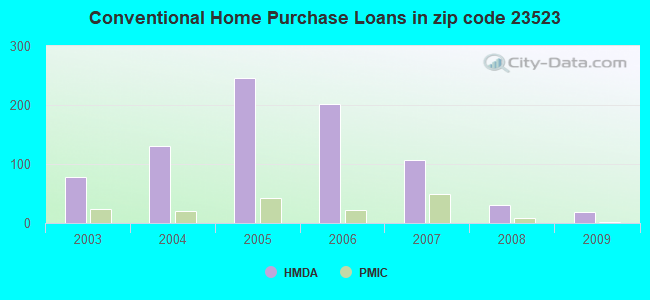
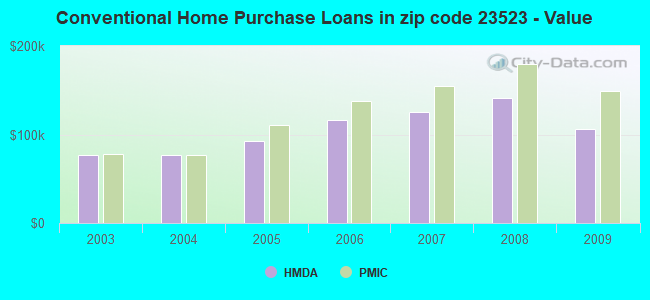
B) Conventional Home Purchase Loans
C) Refinancings
D) Home Improvement Loans
F) Non-occupant Loans on < 5 Family Dwellings (A B C & D)
Number
Average Value
Number
Average Value
Number
Average Value
Number
Average Value
Number
Average Value
LOANS ORIGINATED
31
$140,356
18
$106,481
115
$151,072
5
$44,966
19
$80,625
APPLICATIONS APPROVED, NOT ACCEPTED
5
$154,086
0
$0
14
$146,527
0
$0
0
$0
APPLICATIONS DENIED
12
$128,207
5
$124,946
78
$114,329
18
$31,733
8
$78,849
APPLICATIONS WITHDRAWN
3
$131,450
4
$173,050
32
$175,580
7
$42,486
10
$89,288
FILES CLOSED FOR INCOMPLETENESS
0
$0
0
$0
4
$176,060
0
$0
0
$0
Aggregated Statistics For Year 2008 (Based on 4 full and 4 partial tracts)
A) FHA, FSA/RHS & VA Home Purchase Loans
B) Conventional Home Purchase Loans
C) Refinancings
D) Home Improvement Loans
E) Loans on Dwellings For 5+ Families
F) Non-occupant Loans on < 5 Family Dwellings (A B C & D)
Number
Average Value
Number
Average Value
Number
Average Value
Number
Average Value
Number
Average Value
Number
Average Value
LOANS ORIGINATED
35
$177,865
30
$141,612
160
$140,228
21
$77,490
0
$0
37
$117,800
APPLICATIONS APPROVED, NOT ACCEPTED
2
$126,685
3
$103,230
34
$104,325
9
$87,904
0
$0
3
$62,747
APPLICATIONS DENIED
8
$157,955
14
$134,273
207
$145,743
37
$98,166
0
$0
24
$122,962
APPLICATIONS WITHDRAWN
1
$224,760
5
$224,974
97
$153,126
4
$104,482
2
$306,235
11
$120,415
FILES CLOSED FOR INCOMPLETENESS
0
$0
4
$194,875
23
$143,253
0
$0
0
$0
5
$151,666
Aggregated Statistics For Year 2007 (Based on 4 full and 4 partial tracts)
A) FHA, FSA/RHS & VA Home Purchase Loans
B) Conventional Home Purchase Loans
C) Refinancings
D) Home Improvement Loans
E) Loans on Dwellings For 5+ Families
F) Non-occupant Loans on < 5 Family Dwellings (A B C & D)
Number
Average Value
Number
Average Value
Number
Average Value
Number
Average Value
Number
Average Value
Number
Average Value
LOANS ORIGINATED
44
$182,817
106
$125,912
253
$123,245
39
$46,319
5
$319,166
84
$110,087
APPLICATIONS APPROVED, NOT ACCEPTED
3
$154,027
13
$154,118
58
$108,531
16
$56,938
3
$329,103
10
$120,052
APPLICATIONS DENIED
5
$158,156
58
$127,291
267
$136,292
60
$81,024
0
$0
69
$112,119
APPLICATIONS WITHDRAWN
2
$208,480
13
$163,336
130
$128,910
11
$116,240
2
$147,240
16
$126,588
FILES CLOSED FOR INCOMPLETENESS
2
$157,605
7
$122,707
68
$137,086
2
$13,965
0
$0
5
$131,644
Aggregated Statistics For Year 2006 (Based on 4 full and 4 partial tracts)
A) FHA, FSA/RHS & VA Home Purchase Loans
B) Conventional Home Purchase Loans
C) Refinancings
D) Home Improvement Loans
E) Loans on Dwellings For 5+ Families
F) Non-occupant Loans on < 5 Family Dwellings (A B C & D)
G) Loans On Manufactured Home Dwelling (A B C & D)
Number
Average Value
Number
Average Value
Number
Average Value
Number
Average Value
Number
Average Value
Number
Average Value
Number
Average Value
LOANS ORIGINATED
45
$174,324
202
$116,085
341
$114,389
62
$85,455
3
$249,350
149
$96,603
0
$0
APPLICATIONS APPROVED, NOT ACCEPTED
4
$175,560
31
$97,295
64
$109,390
3
$13,903
0
$0
19
$78,031
0
$0
APPLICATIONS DENIED
8
$144,052
82
$98,430
254
$114,210
73
$75,884
2
$197,505
48
$86,160
8
$57,495
APPLICATIONS WITHDRAWN
2
$175,975
30
$99,320
185
$116,899
24
$93,732
2
$177,555
25
$94,076
2
$81,475
FILES CLOSED FOR INCOMPLETENESS
0
$0
6
$75,145
42
$120,839
3
$108,847
0
$0
1
$69,800
2
$127,680
Aggregated Statistics For Year 2005 (Based on 4 full and 4 partial tracts)
A) FHA, FSA/RHS & VA Home Purchase Loans
B) Conventional Home Purchase Loans
C) Refinancings
D) Home Improvement Loans
E) Loans on Dwellings For 5+ Families
F) Non-occupant Loans on < 5 Family Dwellings (A B C & D)
Number
Average Value
Number
Average Value
Number
Average Value
Number
Average Value
Number
Average Value
Number
Average Value
LOANS ORIGINATED
28
$138,390
246
$92,430
312
$97,146
48
$66,948
6
$326,743
175
$91,092
APPLICATIONS APPROVED, NOT ACCEPTED
3
$131,120
36
$109,551
59
$93,151
12
$38,961
0
$0
16
$100,069
APPLICATIONS DENIED
11
$152,615
100
$85,636
225
$94,790
73
$51,439
0
$0
48
$77,768
APPLICATIONS WITHDRAWN
0
$0
48
$96,692
124
$93,561
25
$106,258
0
$0
24
$103,357
FILES CLOSED FOR INCOMPLETENESS
0
$0
7
$79,193
28
$117,566
1
$62,820
0
$0
5
$103,544
Aggregated Statistics For Year 2004 (Based on 4 full and 4 partial tracts)
A) FHA, FSA/RHS & VA Home Purchase Loans
B) Conventional Home Purchase Loans
C) Refinancings
D) Home Improvement Loans
E) Loans on Dwellings For 5+ Families
F) Non-occupant Loans on < 5 Family Dwellings (A B C & D)
Number
Average Value
Number
Average Value
Number
Average Value
Number
Average Value
Number
Average Value
Number
Average Value
LOANS ORIGINATED
27
$109,466
130
$76,745
233
$79,329
37
$38,426
3
$666,267
93
$70,151
APPLICATIONS APPROVED, NOT ACCEPTED
4
$90,420
26
$71,480
45
$75,470
3
$61,747
0
$0
21
$66,116
APPLICATIONS DENIED
2
$75,810
63
$80,237
202
$79,340
38
$42,831
2
$214,230
40
$73,796
APPLICATIONS WITHDRAWN
4
$81,415
47
$85,848
176
$79,705
11
$29,186
0
$0
21
$67,447
FILES CLOSED FOR INCOMPLETENESS
0
$0
12
$83,138
12
$75,352
0
$0
0
$0
4
$60,212
Aggregated Statistics For Year 2003 (Based on 4 full and 4 partial tracts)
A) FHA, FSA/RHS & VA Home Purchase Loans
B) Conventional Home Purchase Loans
C) Refinancings
D) Home Improvement Loans
E) Loans on Dwellings For 5+ Families
F) Non-occupant Loans on < 5 Family Dwellings (A B C & D)
2002 - 2018 National Fire Incident Reporting System (NFIRS) incidents
Based on the data from the years 2002 - 2018 the average number of fire incidents per year is 27. The highest number of reported fire incidents - 59 took place in 2014, and the least - 0 in 2009. The data has a decreasing trend.
When looking into fire subcategories, the most reports belonged to: Structure Fires (31.7%), and Outside Fires (29.5%).
Fire incident types reported to NFIRS in Zip Code 23523


 Nearest zip codes: 23504, 23510, 23324, 23708, 23325, 23709.


 Based on the data from the years 2002 - 2018 the average number of fire incidents per year is 27. The highest number of reported fire incidents - 59 took place in 2014, and the least - 0 in 2009. The data has a decreasing trend.
 When looking into fire subcategories, the most reports belonged to: Structure Fires (31.7%), and Outside Fires (29.5%).