Estimated zip code population in 2022: 1,500 Zip code population in 2010: 1,355 Zip code population in 2000: 1,316
Houses and condos: 835 Renter-occupied apartments: 92
% of renters here:
13%
State:
33%
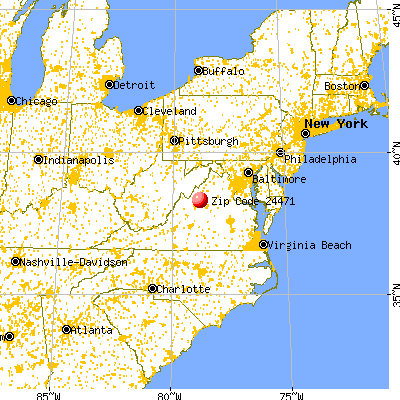
March 2022 cost of living index in zip code 24471: 82.9 (low, U.S. average is 100)
Land area: 16.2 sq. mi. Water area: 0.3 sq. mi.
Population density: 93 people per square mile
(very low).
OSM Map
General Map
Google Map
MSN Map
OSM Map
General Map
Google Map
MSN Map
OSM Map
General Map
Google Map
MSN Map
OSM Map
General Map
Google Map
MSN Map
Please wait while loading the map...
Real estate property taxes paid for housing units in 2022:
This zip code:
0.7% ($1,772)
Virginia:
0.7% ($2,617)
Median real estate property taxes paid for housing units with mortgages in 2022: $1,632 (0.6%) Median real estate property taxes paid for housing units with no mortgage in 2022: $2,171 (0.9%)
Business Search- 14 Million verified businesses
Males: 825
(55.0%)
Females: 674
(45.0%)
For population 25 years and over in 24471:
High school or higher: 90.1%
Bachelor's degree or higher: 38.8%
Graduate or professional degree: 23.1%
Mean travel time to work (commute): 19.7 minutes
For population 15 years and over in 24471:
Never married: 27.6%
Now married: 59.0%
Separated: 0.0%
Widowed: 5.4%
Divorced: 8.0%
Zip code 24471 compared to state average:
Unemployed percentage significantly below state average.
Black race population percentage significantly below state average.
Hispanic race population percentage below state average.
Median age significantly above state average.
Foreign-born population percentage significantly below state average.
Renting percentage significantly below state average.
Length of stay since moving in significantly above state average.
Estimated median house/condo value in 2022: $246,670
24471:
$246,670
Virginia:
$365,700
According to our research of Virginia and other state lists, there were 3 registered sex offenders living in 24471 zip code as of June 16, 2024. The ratio of all residents to sex offenders in zip code 24471 is 461 to 1. The ratio of registered sex offenders to all residents in this zip code is lower than the state average.
Median resident age:
This zip code:
47.8 years
Virginia median age:
39.0 years
Average household size:
This zip code:
2.1 people
Virginia:
2.5 people
Averages for the 2020 tax year for zip code 24471, filed in 2021:
Average Adjusted Gross Income (AGI) in 2020: $70,881 (Individual Income Tax Returns)
Here:
$70,881
State:
$86,446
Salary/wage: $62,147 (reported on 78.1% of returns)
Here:
$62,147
State:
$71,185
(% of AGI for various income ranges: 1131.3% for AGIs below $25k, 3630.0% for AGIs $25k-50k, 7621.7% for AGIs $50k-75k, 8722.0% for AGIs $75k-100k, 17758.6% for AGIs $100k-200k)
Taxable interest for individuals: $1,169 (reported on 39.7% of returns)
This zip code:
$1,169
Virginia:
$1,805
(% of AGI for various income ranges: 44.0% for AGIs below $25k, 42.0% for AGIs $25k-50k, 35.0% for AGIs $50k-75k, 56.0% for AGIs $75k-100k, 205.7% for AGIs $100k-200k)
Ordinary dividends: $4,872 (reported on 24.7% of returns)
Here:
$4,872
State:
$8,327
(% of AGI for various income ranges: 56.0% for AGIs below $25k, 63.0% for AGIs $25k-50k, 65.0% for AGIs $50k-75k, 110.0% for AGIs $75k-100k, 618.6% for AGIs $100k-200k)
Net capital gain/loss in AGI: +$13,141 (reported on 23.3% of returns)
Here:
+$13,141
State:
+$24,644
(% of AGI for various income ranges: 74.0% for AGIs below $25k, 9.0% for AGIs $25k-50k, 60.0% for AGIs $50k-75k, 350.0% for AGIs $75k-100k, 2718.6% for AGIs $100k-200k)
Profit/loss from business: +$8,117 (reported on 16.4% of returns)
Here:
+$8,117
State:
+$12,836
(% of AGI for various income ranges: 87.3% for AGIs below $25k, 242.0% for AGIs $25k-50k, 546.7% for AGIs $50k-75k, 390.0% for AGIs $100k-200k)
Taxable individual retirement arrangement distribution: $18,667 (reported on 12.3% of returns)
24471:
$18,667
Virginia:
$21,535
(% of AGI for various income ranges: 224.0% for AGIs below $25k, 866.7% for AGIs $50k-75k, 1177.1% for AGIs $100k-200k)
Total itemized deductions: $39,900 (reported on 8.2% of returns)
Here:
$39,900
State:
$33,287
(% of AGI for various income ranges: 1704.3% for AGIs $100k-200k)
Charity contributions: $11,133 (reported on 8.2% of returns)
Here:
$11,133
State:
$10,381
(% of AGI for various income ranges: 954.3% for AGIs $100k-200k)
Taxes paid: $9,000 (reported on 8.2% of returns)
24471:
$9,000
State:
$8,284
(% of AGI for various income ranges: 457.1% for AGIs $100k-200k)
Earned income credit: $1,867 (reported on 12.3% of returns)
Here:
$1,867
State:
$2,214
(% of AGI for various income ranges: 77.3% for AGIs below $25k, 52.0% for AGIs $25k-50k)
Percentage of individuals using paid preparers for their 2020 taxes: 91.8%
Here:
92%
State:
92%
(% for various income ranges: 87.0% for AGIs below $25k, 93.3% for AGIs $25k-50k, 90.0% for AGIs $50k-75k, 100.0% for AGIs $75k-100k, 92.3% for AGIs $100k-200k, 100.0% for AGIs over 200k)
Averages for the 2012 tax year for zip code 24471, filed in 2013:
Average Adjusted Gross Income (AGI) in 2012: $55,109 (Individual Income Tax Returns)
Here:
$55,109
State:
$71,192
Salary/wage: $49,338 (reported on 79.1% of returns)
Here:
$49,338
State:
$59,229
(% of AGI for various income ranges: 64.0% for AGIs below $25k, 72.5% for AGIs $25k-50k, 67.3% for AGIs $50k-75k, 75.5% for AGIs $75k-100k, 71.3% for AGIs $100k-200k)
Taxable interest for individuals: $1,393 (reported on 44.8% of returns)
This zip code:
$1,393
Virginia:
$1,600
(% of AGI for various income ranges: 1.8% for AGIs below $25k, 2.2% for AGIs $25k-50k, 1.8% for AGIs $50k-75k, 0.6% for AGIs $75k-100k, 0.4% for AGIs $100k-200k)
Ordinary dividends: $3,268 (reported on 28.4% of returns)
Here:
$3,268
State:
$6,959
(% of AGI for various income ranges: 1.8% for AGIs below $25k, 1.1% for AGIs $25k-50k, 1.6% for AGIs $50k-75k, 1.5% for AGIs $75k-100k, 2.1% for AGIs $100k-200k)
Net capital gain/loss in AGI: +$2,694 (reported on 23.9% of returns)
Here:
+$2,694
State:
+$16,672
(% of AGI for various income ranges: 0.3% for AGIs $25k-50k, 1.7% for AGIs $50k-75k, 1.1% for AGIs $75k-100k, 1.6% for AGIs $100k-200k)
Profit/loss from business: +$7,470 (reported on 14.9% of returns)
Here:
+$7,470
State:
+$14,116
(% of AGI for various income ranges: 10.8% for AGIs below $25k, 2.2% for AGIs $25k-50k, 3.2% for AGIs $50k-75k, 0.4% for AGIs $100k-200k)
Taxable individual retirement arrangement distribution: $16,071 (reported on 10.4% of returns)
24471:
$16,071
Virginia:
$16,667
Total itemized deductions: $23,142 (24% of AGI, reported on 35.8% of returns)
Here:
$23,142
State:
$26,596
Here:
24.5% of AGI
State:
20.1% of AGI
(% of AGI for various income ranges: 14.1% for AGIs $25k-50k, 17.7% for AGIs $50k-75k, 15.9% for AGIs $75k-100k, 16.7% for AGIs $100k-200k)
Charity contributions: $6,383 (reported on 26.9% of returns)
Here:
$6,383
State:
$4,443
(% of AGI for various income ranges: 1.8% for AGIs $25k-50k, 1.9% for AGIs $50k-75k, 3.2% for AGIs $75k-100k, 4.9% for AGIs $100k-200k)
Taxes paid: $6,108 (reported on 35.8% of returns)
24471:
$6,108
State:
$9,951
(% of AGI for various income ranges: 2.2% for AGIs $25k-50k, 3.5% for AGIs $50k-75k, 4.3% for AGIs $75k-100k, 5.7% for AGIs $100k-200k)
Earned income credit: $2,010 (reported on 14.9% of returns)
Here:
$2,010
State:
$2,211
(% of AGI for various income ranges: 5.4% for AGIs below $25k, 0.8% for AGIs $25k-50k)
Percentage of individuals using paid preparers for their 2012 taxes: 62.7%
Here:
63%
State:
46%
(% for various income ranges: 54.5% for AGIs below $25k, 57.9% for AGIs $25k-50k, 75.0% for AGIs $50k-75k, 66.7% for AGIs $75k-100k, 75.0% for AGIs $100k-200k)
Averages for the 2004 tax year for zip code 24471, filed in 2005:
Average Adjusted Gross Income (AGI) in 2004: $48,679 (Individual Income Tax Returns)
Here:
$48,679
State:
$56,704
Salary/wage: $40,904 (reported on 83.5% of returns)
Here:
$40,904
State:
$48,441
(% of AGI for various income ranges: 82.0% for AGIs below $10k, 68.2% for AGIs $10k-25k, 77.0% for AGIs $25k-50k, 82.4% for AGIs $50k-75k, 85.7% for AGIs $75k-100k, 54.9% for AGIs over 100k)
Taxable interest for individuals: $1,333 (reported on 50.8% of returns)
This zip code:
$1,333
Virginia:
$1,688
(% of AGI for various income ranges: 6.1% for AGIs below $10k, 1.9% for AGIs $10k-25k, 1.8% for AGIs $25k-50k, 0.4% for AGIs $50k-75k, 0.7% for AGIs $75k-100k, 1.5% for AGIs over 100k)
Taxable dividends: $2,102 (reported on 33.4% of returns)
Here:
$2,102
State:
$4,028
(% of AGI for various income ranges: 6.8% for AGIs below $10k, 2.9% for AGIs $10k-25k, 1.6% for AGIs $25k-50k, 1.5% for AGIs $50k-75k, 0.7% for AGIs $75k-100k, 1.0% for AGIs over 100k)
Net capital gain/loss: +$3,500 (reported on 28.2% of returns)
Here:
+$3,500
State:
+$14,375
(% of AGI for various income ranges: -2.5% for AGIs below $10k, 1.0% for AGIs $10k-25k, 1.1% for AGIs $25k-50k, 0.3% for AGIs $50k-75k, -0.4% for AGIs $75k-100k, 4.6% for AGIs over 100k)
Profit/loss from business: +$7,557 (reported on 15.8% of returns)
Here:
+$7,557
State:
+$13,342
(% of AGI for various income ranges: 6.5% for AGIs below $10k, 6.4% for AGIs $10k-25k, 4.4% for AGIs $25k-50k, 0.9% for AGIs $50k-75k, -0.6% for AGIs $75k-100k, 2.2% for AGIs over 100k)
IRA payment deduction: $2,625 (reported on 2.4% of returns)
24471:
$2,625
Virginia:
$2,943
Total itemized deductions: $17,775 (18% of AGI, reported on 30.3% of returns)
Here:
$17,775
State:
$21,492
Here:
18.2% of AGI
State:
21.0% of AGI
(% of AGI for various income ranges: 5.8% for AGIs $10k-25k, 8.9% for AGIs $25k-50k, 13.5% for AGIs $50k-75k, 12.8% for AGIs $75k-100k, 12.1% for AGIs over 100k)
Charity contributions deductions: $4,646 (5% of AGI, reported on 26.0% of returns)
Here:
$4,646
State:
$3,794
Here:
4.7% of AGI
State:
3.5% of AGI
(% of AGI for various income ranges: 3.1% for AGIs below $10k, 1.6% for AGIs $25k-50k, 2.5% for AGIs $50k-75k, 2.8% for AGIs $75k-100k, 3.4% for AGIs over 100k)
Total tax: $6,943 (reported on 81.3% of returns)
24471:
$6,943
State:
$9,537
(% of AGI for various income ranges: 3.4% for AGIs below $10k, 5.4% for AGIs $10k-25k, 7.3% for AGIs $25k-50k, 8.2% for AGIs $50k-75k, 10.8% for AGIs $75k-100k, 17.6% for AGIs over 100k)
Earned income credit: $1,667 (reported on 9.8% of returns)
Here:
$1,667
State:
$1,734
Percentage of individuals using paid preparers for their 2004 taxes: 63.3%
Here:
63%
State:
52%
(% for various income ranges: 58.9% for AGIs below $10k, 58.9% for AGIs $10k-25k, 65.4% for AGIs $25k-50k, 67.6% for AGIs $50k-75k, 60.4% for AGIs $75k-100k, 71.0% for AGIs over 100k)
Household received Food Stamps/SNAP in the past 12 months: 45 Household did not receive Food Stamps/SNAP in the past 12 months: 652
Women who had a birth in the past 12 months: 12 (12 now married, 0 unmarried) Women who did not have a birth in the past 12 months: 279 (159 now married, 118 unmarried)
Housing units in zip code 24471 with a mortgage: 266 (78 second mortgage, 77 both second mortgage and home equity loan) Houses without a mortgage: 18
Median monthly owner costs for units with a mortgage: $1,695 Median monthly owner costs for units without a mortgage: $440
Residents with income below the poverty level in 2022:
This zip code:
4.6%
Whole state:
10.6%
Residents with income below 50% of the poverty level in 2022:
This zip code:
4.6%
Whole state:
5.2%
Median number of rooms in houses and condos:
Here:
5.9
State:
7.0
Median number of rooms in apartments:
Here:
3.9
State:
4.3
Notable locations in this zip code not listed on our city pages
Streams, rivers, and creeks: Miller Run (A), Mill Creek (B), Madison Run (C), Lower Lewis Run (D), South River (E), Deep Run (F), North River (G), Duck Run (H). Display/hide their locations on the map
Size of family households: 240 2-persons, 49 3-persons, 48 4-persons, 47 5-persons, 22 6-persons
Size of nonfamily households: 245 1-person, 50 2-persons
202 married couples with children.
0 single-parent households ().
98.5% of residents of 24471 zip code speak English at home.
0.8% of residents speak Spanish at home (100% very well).
0.3% of residents speak other Indo-European language at home (100% very well).
Foreign born population: 21 (1.4%) (73.6% of them are naturalized citizens)
This zip code:
1.4%
Whole state:
12.7%
52%Germany
24%France
31%German
19%Dutch
9%Scottish
8%Irish
5%English
4%Eastern European
4%Danish
Year of entry for the foreign-born population
02010 or later
02000 to 2009
141990 to 1999
20Before 1990
Housing units lacking complete kitchen facilities: 1.6%
54.3%Electricity
22.9%Fuel oil, kerosene, etc.
14.2%Wood
8.8%Bottled, tank, or LP gas
Population in 1990: 1,196. Population change in the 1990s: +120 (+10.0%).
Place of birth for U.S.-born residents:
This state: 1,042
Northeast: 137
Midwest: 48
South: 171
West: 57
67% of the 24471 zip code residents lived in the same house 5 years ago. Out of people who lived in different houses, 59% lived in this county. Out of people who lived in different counties, 50% lived in Virginia.
94% of the 24471 zip code residents lived in the same house 1 year ago. Out of people who lived in different houses, 63% moved from this county. Out of people who lived in different houses, 37% moved from different county within same state.
Private vs. public school enrollment:
Students in private schools in grades 1 to 8 (elementary and middle school): 60
Here:
72.1%
Virginia:
13.2%
Students in private schools in grades 9 to 12 (high school): 53
Here:
58.8%
Virginia:
10.2%
Students in private undergraduate colleges:
Here:
0.0%
Virginia:
18.7%
Occupation by median earnings in the past 12 months ($)
131,718Computer and mathematical occupations
85,158Health diagnosing and treating practitioners and other technical occupations
67,319Installation, maintenance, and repair occupations
35,919Management occupations
17,681Office and administrative support occupations
Top industries in this zip code by the number of employees in 2005:
Administrative and Support and Waste Management and Remediation Services: Landscaping Services (10-19 employees: 1 establishment)
Other Services (except Public Administration): Religious Organizations (5-9: 1, 1-4: 2)
Construction: All Other Specialty Trade Contractors (5-9: 1)
Construction: New Single-Family Housing Construction (except Operative Builders) (1-4: 3)
Construction: Roofing Contractors (1-4: 1)
Real Estate and Rental and Leasing: Recreational Goods Rental (1-4: 1)
Construction: Tile and Terrazzo Contractors (1-4: 1)
Health Care and Social Assistance: Community Food Services (1-4: 1)
Real Estate and Rental and Leasing: Lessors of Nonresidential Buildings (except Miniwarehouses) (1-4: 1)
Fatal accident statistics in 2010:
Fatal accident count: 1
Vehicles involved in fatal accidents: 1
Fatal accidents caused by drunken drivers: 1
Fatalities: 1
Persons involved in fatal accidents: 1
Pedestrians involved in fatal accidents: 0
Home Mortgage Disclosure Act Aggregated Statistics For Year 2009 (Based on 4 partial tracts)
A) FHA, FSA/RHS & VA Home Purchase Loans
B) Conventional Home Purchase Loans
C) Refinancings
D) Home Improvement Loans
F) Non-occupant Loans on < 5 Family Dwellings (A B C & D)
G) Loans On Manufactured Home Dwelling (A B C & D)
Number
Average Value
Number
Average Value
Number
Average Value
Number
Average Value
Number
Average Value
Number
Average Value
LOANS ORIGINATED
15
$181,745
41
$230,716
173
$209,379
8
$118,410
10
$172,789
2
$150,800
APPLICATIONS APPROVED, NOT ACCEPTED
0
$0
1
$147,240
6
$179,618
1
$47,960
1
$61,290
0
$0
APPLICATIONS DENIED
3
$164,377
6
$247,328
38
$228,387
3
$103,877
2
$117,690
1
$55,700
APPLICATIONS WITHDRAWN
1
$213,160
4
$270,525
30
$249,431
1
$111,640
1
$170,890
0
$0
FILES CLOSED FOR INCOMPLETENESS
1
$143,230
2
$120,890
5
$195,910
1
$23,350
0
$0
1
$74,950
Aggregated Statistics For Year 2008 (Based on 4 partial tracts)
A) FHA, FSA/RHS & VA Home Purchase Loans
B) Conventional Home Purchase Loans
C) Refinancings
D) Home Improvement Loans
F) Non-occupant Loans on < 5 Family Dwellings (A B C & D)
G) Loans On Manufactured Home Dwelling (A B C & D)
Number
Average Value
Number
Average Value
Number
Average Value
Number
Average Value
Number
Average Value
Number
Average Value
LOANS ORIGINATED
10
$166,823
41
$250,195
87
$198,695
14
$169,235
7
$197,963
4
$80,920
APPLICATIONS APPROVED, NOT ACCEPTED
0
$0
7
$198,651
11
$188,568
1
$23,830
2
$131,675
1
$76,430
APPLICATIONS DENIED
2
$195,335
9
$143,566
51
$207,923
4
$138,412
4
$153,260
5
$91,268
APPLICATIONS WITHDRAWN
3
$155,577
8
$147,425
26
$215,171
1
$93,890
0
$0
1
$172,600
FILES CLOSED FOR INCOMPLETENESS
0
$0
2
$280,775
4
$293,212
0
$0
0
$0
0
$0
Aggregated Statistics For Year 2007 (Based on 4 partial tracts)
A) FHA, FSA/RHS & VA Home Purchase Loans
B) Conventional Home Purchase Loans
C) Refinancings
D) Home Improvement Loans
F) Non-occupant Loans on < 5 Family Dwellings (A B C & D)
G) Loans On Manufactured Home Dwelling (A B C & D)
Number
Average Value
Number
Average Value
Number
Average Value
Number
Average Value
Number
Average Value
Number
Average Value
LOANS ORIGINATED
4
$159,132
78
$227,376
87
$174,092
13
$76,724
9
$245,806
6
$90,540
APPLICATIONS APPROVED, NOT ACCEPTED
0
$0
6
$179,617
18
$137,565
2
$44,615
0
$0
1
$72,890
APPLICATIONS DENIED
1
$147,370
7
$150,350
53
$215,137
6
$64,722
0
$0
4
$55,005
APPLICATIONS WITHDRAWN
0
$0
5
$175,584
24
$171,004
1
$172,350
1
$315,500
1
$22,230
FILES CLOSED FOR INCOMPLETENESS
0
$0
2
$175,090
5
$199,868
1
$36,310
0
$0
0
$0
Aggregated Statistics For Year 2006 (Based on 4 partial tracts)
A) FHA, FSA/RHS & VA Home Purchase Loans
B) Conventional Home Purchase Loans
C) Refinancings
D) Home Improvement Loans
F) Non-occupant Loans on < 5 Family Dwellings (A B C & D)
G) Loans On Manufactured Home Dwelling (A B C & D)
Number
Average Value
Number
Average Value
Number
Average Value
Number
Average Value
Number
Average Value
Number
Average Value
LOANS ORIGINATED
3
$182,837
91
$196,052
97
$172,856
13
$96,436
16
$161,256
5
$83,480
APPLICATIONS APPROVED, NOT ACCEPTED
0
$0
8
$152,356
14
$184,575
3
$63,660
3
$204,673
1
$119,640
APPLICATIONS DENIED
0
$0
10
$143,378
51
$170,649
7
$45,807
4
$123,182
5
$54,148
APPLICATIONS WITHDRAWN
0
$0
10
$183,977
41
$156,586
2
$87,670
4
$174,780
1
$79,420
FILES CLOSED FOR INCOMPLETENESS
0
$0
0
$0
7
$236,539
0
$0
0
$0
0
$0
Aggregated Statistics For Year 2005 (Based on 4 partial tracts)
A) FHA, FSA/RHS & VA Home Purchase Loans
B) Conventional Home Purchase Loans
C) Refinancings
D) Home Improvement Loans
F) Non-occupant Loans on < 5 Family Dwellings (A B C & D)
G) Loans On Manufactured Home Dwelling (A B C & D)
Number
Average Value
Number
Average Value
Number
Average Value
Number
Average Value
Number
Average Value
Number
Average Value
LOANS ORIGINATED
6
$158,672
90
$189,904
107
$161,909
18
$76,556
14
$153,771
4
$69,590
APPLICATIONS APPROVED, NOT ACCEPTED
0
$0
7
$193,133
19
$116,370
2
$89,685
1
$116,980
2
$50,190
APPLICATIONS DENIED
1
$178,130
13
$132,964
54
$126,052
9
$59,720
4
$139,912
7
$63,864
APPLICATIONS WITHDRAWN
1
$105,200
10
$208,057
32
$161,078
4
$94,562
3
$187,333
1
$86,760
FILES CLOSED FOR INCOMPLETENESS
0
$0
2
$323,665
5
$148,904
0
$0
0
$0
0
$0
Aggregated Statistics For Year 2004 (Based on 4 partial tracts)
A) FHA, FSA/RHS & VA Home Purchase Loans
B) Conventional Home Purchase Loans
C) Refinancings
D) Home Improvement Loans
F) Non-occupant Loans on < 5 Family Dwellings (A B C & D)
G) Loans On Manufactured Home Dwelling (A B C & D)


 Nearest zip codes: 22846, 24441, 22841, 22801, 22840, 24486.


