Estimated zip code population in 2022: 7,541 Zip code population in 2010: 8,074 Zip code population in 2000: 6,839
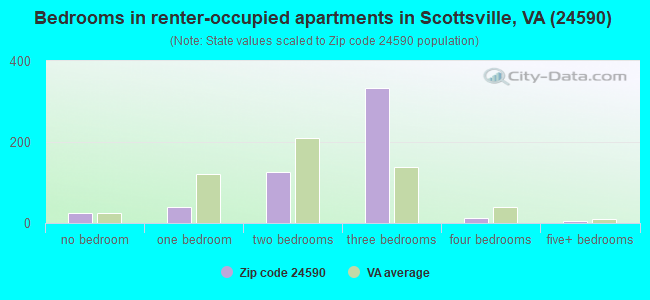
Houses and condos: 3,305 Renter-occupied apartments: 544
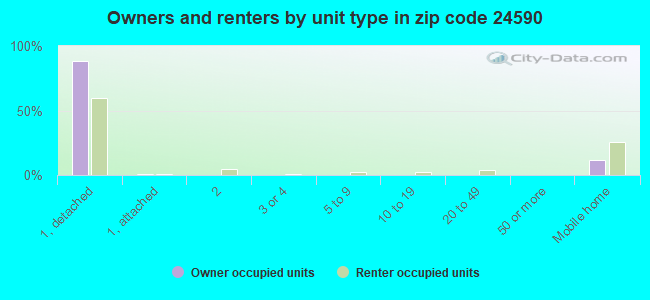
% of renters here:
18%
State:
33%
March 2022 cost of living index in zip code 24590: 84.8 (less than average, U.S. average is 100)
Land area: 166.6 sq. mi. Water area: 2.6 sq. mi.
Population density: 45 people per square mile
(very low).
OSM Map
General Map
Google Map
MSN Map
OSM Map
General Map
Google Map
MSN Map
OSM Map
General Map
Google Map
MSN Map
OSM Map
General Map
Google Map
MSN Map
Please wait while loading the map...
Real estate property taxes paid for housing units in 2022:
This zip code:
0.6% ($1,550)
Virginia:
0.7% ($2,617)
Median real estate property taxes paid for housing units with mortgages in 2022: $1,535 (0.6%) Median real estate property taxes paid for housing units with no mortgage in 2022: $1,603 (0.6%)
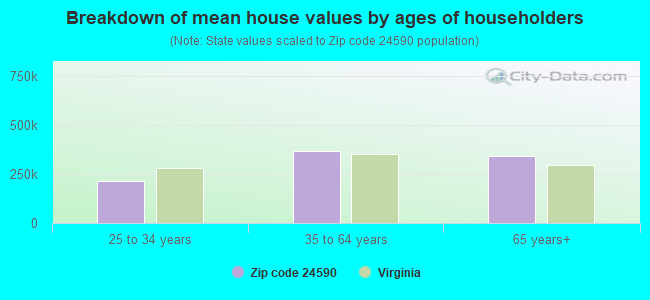
Estimated median house/condo value in 2022: $259,154
24590:
$259,154
Virginia:
$365,700
According to our research of Virginia and other state lists, there were 21 registered sex offenders living in 24590 zip code as of June 20, 2024. The ratio of all residents to sex offenders in zip code 24590 is 386 to 1. The ratio of registered sex offenders to all residents in this zip code is near the state average.
Median resident age:
This zip code:
45.7 years
Virginia median age:
39.0 years
Average household size:
This zip code:
2.5 people
Virginia:
2.5 people
Averages for the 2020 tax year for zip code 24590, filed in 2021:
Average Adjusted Gross Income (AGI) in 2020: $61,875 (Individual Income Tax Returns)
Here:
$61,875
State:
$86,446
Salary/wage: $51,234 (reported on 82.6% of returns)
Here:
$51,234
State:
$71,185
(% of AGI for various income ranges: 1155.6% for AGIs below $25k, 3663.9% for AGIs $25k-50k, 6692.7% for AGIs $50k-75k, 9718.8% for AGIs $75k-100k, 18031.4% for AGIs $100k-200k, 61343.3% for AGIs over 200k)
Taxable interest for individuals: $1,843 (reported on 24.2% of returns)
This zip code:
$1,843
Virginia:
$1,805
(% of AGI for various income ranges: 14.8% for AGIs below $25k, 32.2% for AGIs $25k-50k, 38.2% for AGIs $50k-75k, 69.2% for AGIs $75k-100k, 114.5% for AGIs $100k-200k, 2180.0% for AGIs over 200k)
Ordinary dividends: $6,789 (reported on 15.0% of returns)
Here:
$6,789
State:
$8,327
(% of AGI for various income ranges: 16.5% for AGIs below $25k, 39.2% for AGIs $25k-50k, 75.0% for AGIs $50k-75k, 134.4% for AGIs $75k-100k, 231.0% for AGIs $100k-200k, 7030.0% for AGIs over 200k)
Net capital gain/loss in AGI: +$31,545 (reported on 12.4% of returns)
Here:
+$31,545
State:
+$24,644
(% of AGI for various income ranges: 12.8% for AGIs below $25k, 23.8% for AGIs $25k-50k, 48.0% for AGIs $50k-75k, 306.4% for AGIs $75k-100k, 424.8% for AGIs $100k-200k, 41116.7% for AGIs over 200k)
Profit/loss from business: +$14,843 (reported on 16.1% of returns)
Here:
+$14,843
State:
+$12,836
(% of AGI for various income ranges: 148.2% for AGIs below $25k, 143.8% for AGIs $25k-50k, 347.5% for AGIs $50k-75k, 272.8% for AGIs $75k-100k, 839.0% for AGIs $100k-200k, 7030.0% for AGIs over 200k)
Taxable individual retirement arrangement distribution: $13,731 (reported on 7.6% of returns)
24590:
$13,731
Virginia:
$21,535
(% of AGI for various income ranges: 42.0% for AGIs below $25k, 83.8% for AGIs $25k-50k, 174.5% for AGIs $50k-75k, 140.0% for AGIs $75k-100k, 655.9% for AGIs $100k-200k)
Total itemized deductions: $33,929 (reported on 6.3% of returns)
Here:
$33,929
State:
$33,287
(% of AGI for various income ranges: 107.8% for AGIs $25k-50k, 254.2% for AGIs $50k-75k, 362.4% for AGIs $75k-100k, 875.2% for AGIs $100k-200k, 9433.3% for AGIs over 200k)
Charity contributions: $10,089 (reported on 4.7% of returns)
Here:
$10,089
State:
$10,381
(% of AGI for various income ranges: 5.5% for AGIs below $25k, 60.0% for AGIs $50k-75k, 175.2% for AGIs $100k-200k, 3400.0% for AGIs over 200k)
Taxes paid: $7,262 (reported on 6.3% of returns)
24590:
$7,262
State:
$8,284
(% of AGI for various income ranges: 16.2% for AGIs $25k-50k, 62.7% for AGIs $50k-75k, 91.6% for AGIs $75k-100k, 252.8% for AGIs $100k-200k, 1340.0% for AGIs over 200k)
Earned income credit: $2,124 (reported on 15.5% of returns)
Here:
$2,124
State:
$2,214
(% of AGI for various income ranges: 87.3% for AGIs below $25k, 61.4% for AGIs $25k-50k)
Percentage of individuals using paid preparers for their 2020 taxes: 92.6%
Here:
93%
State:
92%
(% for various income ranges: 91.7% for AGIs below $25k, 94.1% for AGIs $25k-50k, 93.1% for AGIs $50k-75k, 94.6% for AGIs $75k-100k, 90.4% for AGIs $100k-200k, 90.0% for AGIs over 200k)
Averages for the 2012 tax year for zip code 24590, filed in 2013:
Average Adjusted Gross Income (AGI) in 2012: $48,325 (Individual Income Tax Returns)
Here:
$48,325
State:
$71,192
Salary/wage: $41,768 (reported on 87.0% of returns)
Here:
$41,768
State:
$59,229
(% of AGI for various income ranges: 76.6% for AGIs below $25k, 84.1% for AGIs $25k-50k, 79.0% for AGIs $50k-75k, 79.0% for AGIs $75k-100k, 74.9% for AGIs $100k-200k, 44.8% for AGIs over 200k)
Taxable interest for individuals: $1,536 (reported on 27.8% of returns)
This zip code:
$1,536
Virginia:
$1,600
(% of AGI for various income ranges: 0.9% for AGIs below $25k, 0.7% for AGIs $25k-50k, 1.0% for AGIs $50k-75k, 1.0% for AGIs $75k-100k, 0.7% for AGIs $100k-200k, 1.0% for AGIs over 200k)
Ordinary dividends: $4,836 (reported on 16.3% of returns)
Here:
$4,836
State:
$6,959
(% of AGI for various income ranges: 1.4% for AGIs below $25k, 0.6% for AGIs $25k-50k, 0.8% for AGIs $50k-75k, 1.5% for AGIs $75k-100k, 2.2% for AGIs $100k-200k, 4.2% for AGIs over 200k)
Net capital gain/loss in AGI: +$5,286 (reported on 10.7% of returns)
Here:
+$5,286
State:
+$16,672
(% of AGI for various income ranges: 0.8% for AGIs below $25k, 0.4% for AGIs $25k-50k, 0.5% for AGIs $50k-75k, 0.5% for AGIs $75k-100k, 1.4% for AGIs $100k-200k, 4.8% for AGIs over 200k)
Profit/loss from business: +$11,898 (reported on 16.9% of returns)
Here:
+$11,898
State:
+$14,116
(% of AGI for various income ranges: 9.7% for AGIs below $25k, 3.6% for AGIs $25k-50k, 3.5% for AGIs $50k-75k, 1.9% for AGIs $75k-100k, 6.4% for AGIs $100k-200k)
Taxable individual retirement arrangement distribution: $10,910 (reported on 8.6% of returns)
24590:
$10,910
Virginia:
$16,667
(% of AGI for various income ranges: 2.1% for AGIs below $25k, 1.8% for AGIs $25k-50k, 1.5% for AGIs $50k-75k, 1.6% for AGIs $75k-100k, 3.5% for AGIs $100k-200k)
Total itemized deductions: $19,519 (23% of AGI, reported on 31.1% of returns)
Here:
$19,519
State:
$26,596
Here:
22.7% of AGI
State:
20.1% of AGI
(% of AGI for various income ranges: 8.1% for AGIs below $25k, 10.0% for AGIs $25k-50k, 13.5% for AGIs $50k-75k, 13.6% for AGIs $75k-100k, 14.4% for AGIs $100k-200k, 14.2% for AGIs over 200k)
Charity contributions: $3,062 (reported on 21.9% of returns)
Here:
$3,062
State:
$4,443
(% of AGI for various income ranges: 0.4% for AGIs below $25k, 0.9% for AGIs $25k-50k, 1.1% for AGIs $50k-75k, 1.7% for AGIs $75k-100k, 2.1% for AGIs $100k-200k, 1.9% for AGIs over 200k)
Taxes paid: $6,414 (reported on 31.1% of returns)
24590:
$6,414
State:
$9,951
(% of AGI for various income ranges: 1.4% for AGIs below $25k, 2.2% for AGIs $25k-50k, 3.9% for AGIs $50k-75k, 4.7% for AGIs $75k-100k, 5.6% for AGIs $100k-200k, 6.5% for AGIs over 200k)
Earned income credit: $2,194 (reported on 19.8% of returns)
Here:
$2,194
State:
$2,211
(% of AGI for various income ranges: 7.0% for AGIs below $25k, 1.0% for AGIs $25k-50k)
Percentage of individuals using paid preparers for their 2012 taxes: 39.9%
Here:
40%
State:
46%
(% for various income ranges: 36.9% for AGIs below $25k, 39.1% for AGIs $25k-50k, 42.3% for AGIs $50k-75k, 38.7% for AGIs $75k-100k, 48.3% for AGIs $100k-200k, 75.0% for AGIs over 200k)
Averages for the 2004 tax year for zip code 24590, filed in 2005:
Average Adjusted Gross Income (AGI) in 2004: $49,449 (Individual Income Tax Returns)
Here:
$49,449
State:
$56,704
Salary/wage: $38,056 (reported on 85.4% of returns)
Here:
$38,056
State:
$48,441
(% of AGI for various income ranges: 101.3% for AGIs below $10k, 77.9% for AGIs $10k-25k, 85.5% for AGIs $25k-50k, 81.0% for AGIs $50k-75k, 80.3% for AGIs $75k-100k, 37.0% for AGIs over 100k)
Taxable interest for individuals: $1,833 (reported on 37.9% of returns)
This zip code:
$1,833
Virginia:
$1,688
(% of AGI for various income ranges: 6.1% for AGIs below $10k, 1.8% for AGIs $10k-25k, 1.2% for AGIs $25k-50k, 1.5% for AGIs $50k-75k, 1.1% for AGIs $75k-100k, 1.4% for AGIs over 100k)
Taxable dividends: $3,374 (reported on 17.2% of returns)
Here:
$3,374
State:
$4,028
(% of AGI for various income ranges: 4.3% for AGIs below $10k, 1.1% for AGIs $10k-25k, 0.6% for AGIs $25k-50k, 1.1% for AGIs $50k-75k, 0.9% for AGIs $75k-100k, 1.6% for AGIs over 100k)
Net capital gain/loss: +$18,483 (reported on 13.9% of returns)
Here:
+$18,483
State:
+$14,375
(% of AGI for various income ranges: -0.2% for AGIs below $10k, 0.5% for AGIs $10k-25k, 0.9% for AGIs $25k-50k, 2.0% for AGIs $50k-75k, 2.5% for AGIs $75k-100k, 11.7% for AGIs over 100k)
Profit/loss from business: +$10,950 (reported on 17.5% of returns)
Here:
+$10,950
State:
+$13,342
(% of AGI for various income ranges: 12.2% for AGIs below $10k, 7.4% for AGIs $10k-25k, 4.0% for AGIs $25k-50k, 3.9% for AGIs $50k-75k, 4.0% for AGIs $75k-100k, 2.6% for AGIs over 100k)
IRA payment deduction: $3,140 (reported on 3.2% of returns)
24590:
$3,140
Virginia:
$2,943
(% of AGI for various income ranges: 0.5% for AGIs $10k-25k, 0.2% for AGIs $25k-50k, 0.2% for AGIs $50k-75k, 0.2% for AGIs $75k-100k, 0.1% for AGIs over 100k)
Self-employed pension: $2,533 (reported on 0.5% of returns)
Here:
$2,533
Virginia:
$17,430
Total itemized deductions: $17,531 (17% of AGI, reported on 29.1% of returns)
Here:
$17,531
State:
$21,492
Here:
17.4% of AGI
State:
21.0% of AGI
(% of AGI for various income ranges: 13.9% for AGIs below $10k, 7.8% for AGIs $10k-25k, 9.7% for AGIs $25k-50k, 12.3% for AGIs $50k-75k, 12.9% for AGIs $75k-100k, 9.3% for AGIs over 100k)
Charity contributions deductions: $3,417 (3% of AGI, reported on 21.8% of returns)
Here:
$3,417
State:
$3,794
Here:
3.5% of AGI
State:
3.5% of AGI
(% of AGI for various income ranges: 0.5% for AGIs below $10k, 0.8% for AGIs $10k-25k, 0.9% for AGIs $25k-50k, 1.3% for AGIs $50k-75k, 1.9% for AGIs $75k-100k, 2.1% for AGIs over 100k)
Total tax: $7,652 (reported on 77.3% of returns)
24590:
$7,652
State:
$9,537
(% of AGI for various income ranges: 4.8% for AGIs below $10k, 4.5% for AGIs $10k-25k, 6.9% for AGIs $25k-50k, 8.7% for AGIs $50k-75k, 10.6% for AGIs $75k-100k, 19.2% for AGIs over 100k)
Earned income credit: $1,747 (reported on 16.7% of returns)
Here:
$1,747
State:
$1,734
Percentage of individuals using paid preparers for their 2004 taxes: 48.0%
Here:
48%
State:
52%
(% for various income ranges: 42.8% for AGIs below $10k, 48.8% for AGIs $10k-25k, 47.1% for AGIs $25k-50k, 48.8% for AGIs $50k-75k, 46.6% for AGIs $75k-100k, 66.7% for AGIs over 100k)
Likely homosexual households (counted as self-reported same-sex unmarried-partner households)
Lesbian couples: 0.1% of all households
Gay men: 0.4% of all households
Household received Food Stamps/SNAP in the past 12 months: 197 Household did not receive Food Stamps/SNAP in the past 12 months: 2,851
Women who had a birth in the past 12 months: 64 (58 now married, 6 unmarried) Women who did not have a birth in the past 12 months: 1,625 (671 now married, 954 unmarried)
Housing units in zip code 24590 with a mortgage: 1,497 (131 second mortgage, 47 both second mortgage and home equity loan) Houses without a mortgage: 49
Median monthly owner costs for units with a mortgage: $1,443 Median monthly owner costs for units without a mortgage: $436
Residents with income below the poverty level in 2022:
This zip code:
9.3%
Whole state:
10.6%
Residents with income below 50% of the poverty level in 2022:
This zip code:
4.6%
Whole state:
5.2%
Median number of rooms in houses and condos:
Here:
6.8
State:
7.0
Median number of rooms in apartments:
Here:
4.8
State:
4.3
Notable locations in this zip code not listed on our city pages
Notable locations in zip code 24590: Jefferson Mill (A), Johnson Store (B), Totier Creek Farm (C), Plain Dealing (D), Pine Knot (E), Fair View (F), Valmont (G), Scotland Farm (H), Blenheim Estate (I), Warren Mill (J), Scottsville Town Hall (K), Scottsville Museum (L), Scottsville Library (M), Scottsville Company 7 Fire Station (N), Donegal (O), Cliffside (P), Scottsville Volunteer Rescue Squad Rescue (Q), Scottsville Volunteer Fire Department (R). Display/hide their locations on the map
Churches in zip code 24590 include: Ridgeway Church (A), Berea Chapel (B), Saint Johns Church (C), Slate Hill Church (D), Christ Church (E), Wake Forest Church (F), Fox Memorial Church (G), Wesley Chapel (H), Goshen Church (I). Display/hide their locations on the map
Cemeteries: Saint Georges Cemetery (1), Antioch Cemetery (2), Wake Forest Cemetery (3), Slate Hill Cemetery (4), New Bethel Cemetery (5), Christ Church Cemetery (6), Scottsville Cemetery (7). Display/hide their locations on the map
Reservoirs: Stillfried Pond (A), Mink Creek (B), Stillfreds Pond (C), Allmans Pond (D), Totier Creek Reservoir (E), Paynes Millpond (F), Fluvanna Ruritan Lake (G). Display/hide their locations on the map
Streams, rivers, and creeks: Woodson Creek (A), Turkey Run (B), Totier Creek (C), Thomas Creek (D), Shepherd Creek (E), Rock Island Creek (F), Rock Castle Creek (G), Quarry Creek (H), Miller Creek (I). Display/hide their locations on the map
Parks in zip code 24590 include: Scottsville Historic District (1), Scottsville Recreation Center (2), Hardware River State Wildlife Management Are (3), Totier Creek Reservoir Park (4). Display/hide their locations on the map
In group quarters: 4 (-1 institutionalized population)
Size of family households: 1,055 2-persons, 517 3-persons, 441 4-persons, 148 5-persons, 61 6-persons
Size of nonfamily households: 689 1-person, 142 2-persons
862 married couples with children.
441 single-parent households (139 men, 302 women).
93.2% of residents of 24590 zip code speak English at home.
3.3% of residents speak Spanish at home (65% very well, 21% well, 5% not well, 9% not at all).
1.3% of residents speak other Indo-European language at home (100% very well).
0.3% of residents speak Asian or Pacific Island language at home (100% very well).
1.7% of residents speak other language at home (42% very well, 58% well).
Foreign born population: 403 (5.4%) (66.0% of them are naturalized citizens)
This zip code:
5.4%
Whole state:
12.7%
22%Congo
16%France
10%Morocco
8%Guatemala
6%El Salvador
5%Malaysia
5%Honduras
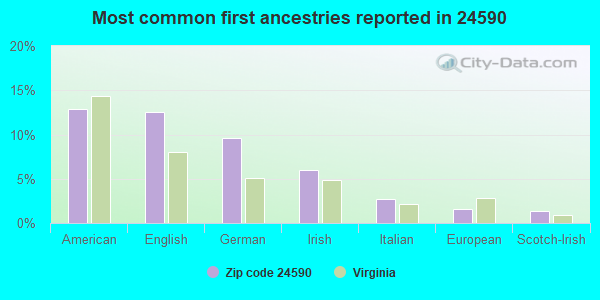
13%American
13%English
10%German
6%Irish
3%Italian
2%European
1%Scotch-Irish
Year of entry for the foreign-born population
492010 or later
2002000 to 2009
731990 to 1999
177Before 1990
Facilities with environmental interests located in this zip code:
CENTRAL VIRGINIA SALVAGE (ROUTE 3 BOX 81J in SCOTTSVILLE, VA)
(Integrated Compliance Information System) - ICIS-03-2000-0207, FORMAL ENFORCEMENT ACTION National Pollutant Discharge Elimination System NON-MAJOR (Tracking pollutant discharge elimination systems) - permit Business SIC classification: MOTOR VEHICLE PARTS, USED
AIR MINOR (AIRS/AFS) Business SIC classification: REFRIGERATION AND AIR-CONDITIONING SERVICE AND REPAIR SHOPS
Housing units lacking complete plumbing facilities: 1.0% Housing units lacking complete kitchen facilities: 1.6%
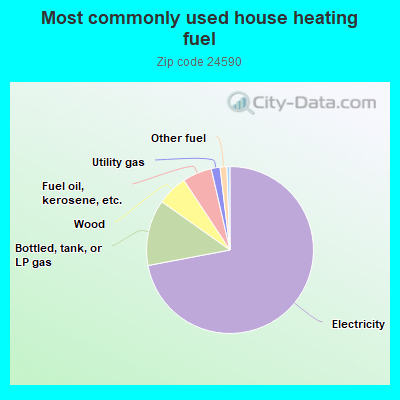
72.1%Electricity
12.8%Bottled, tank, or LP gas
5.9%Wood
5.7%Fuel oil, kerosene, etc.
1.7%Utility gas
1.3%Other fuel
Population in 1990: 5,769. Population change in the 1990s: +1,070 (+18.5%).
Place of birth for U.S.-born residents:
This state: 5,186
Northeast: 768
Midwest: 213
South: 592
West: 231
63% of the 24590 zip code residents lived in the same house 5 years ago. Out of people who lived in different houses, 39% lived in this county. Out of people who lived in different counties, 50% lived in Virginia.
96% of the 24590 zip code residents lived in the same house 1 year ago. Out of people who lived in different houses, 12% moved from this county. Out of people who lived in different houses, 59% moved from different county within same state. Out of people who lived in different houses, 2% moved from different state. Out of people who lived in different houses, 44% moved from abroad.
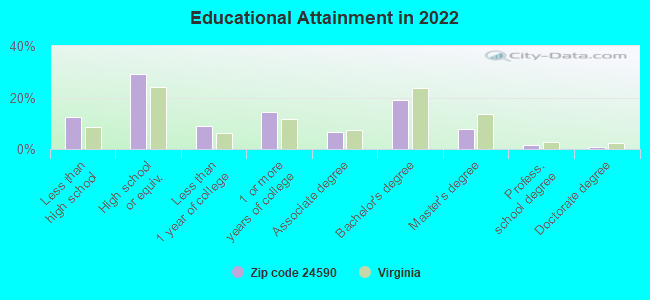
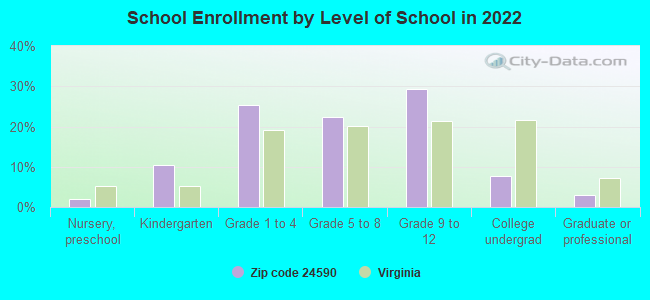
Private vs. public school enrollment:
Students in private schools in grades 1 to 8 (elementary and middle school): 93
Here:
13.8%
Virginia:
13.2%
Students in private schools in grades 9 to 12 (high school): 51
Here:
12.4%
Virginia:
10.2%
Students in private undergraduate colleges:
Here:
0.0%
Virginia:
18.7%
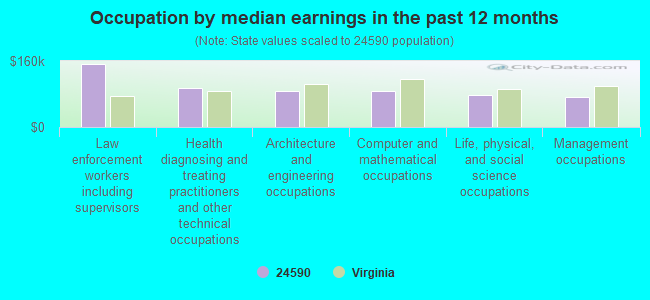
Occupation by median earnings in the past 12 months ($)
152,347Law enforcement workers including supervisors
93,997Health diagnosing and treating practitioners and other technical occupations
87,842Architecture and engineering occupations
86,878Computer and mathematical occupations
78,068Life, physical, and social science occupations
73,560Management occupations
Companies with federal contracts located in this zip code:
ADVANCED TOOLING CORPORATION (5199 WEST RIVER RD in SCOTTSVILLE, VA; small business) : $247,178 in 6 contractsfrom 2005 to 2006
Contracts for Engineering and Technical Services, Metal Finishing Equipment, Maintenance, Repair and Rebuilding of Equipment -- Miscellaneous, Bars and Rods by Army, Air Force Signed by year:2000: $0; 2001: $0; 2002: $0; 2003: $0; 2004: $0; 2005: $177,178; 2006: $70,000.
Biggest contracts:
$87,692 with Army for Engineering and Technical Services. Taking place in TX. Signed on 2005-11-14. Completion date: 2006-11-14.
$60,000 with Army for Metal Finishing Equipment. Signed on 2006-02-08. Completion date: 2006-03-31.
$42,200 with Air Force for Maintenance, Repair and Rebuilding of Equipment -- Miscellaneous. Taking place in GA. Signed on 2005-09-06. Completion date: 2006-09-05.
$37,200 with Air Force for Metal Finishing Equipment. Signed on 2005-06-28. Completion date: 2005-07-29.
LIBERTY CORPORATION (3290 ROLLING ROAD in SCOTTSVILLE, VA; small business) : $10,455 in 2 contractsfrom 1999 to 2001
$6,880 with Navy for Maintenance, Repair or Alteration of Real Property -- Government-Owned Government-Operated (GOGO) R&D Facilities. Signed on 2001-12-19. Completion date: 2002-02-28.
$3,575 with Navy for Maintenance, Repair or Alteration of Real Property -- Recreational Buildings. Signed on 1999-10-01. Completion date: 1999-05-31.
Top industries in this zip code by the number of employees in 2005:
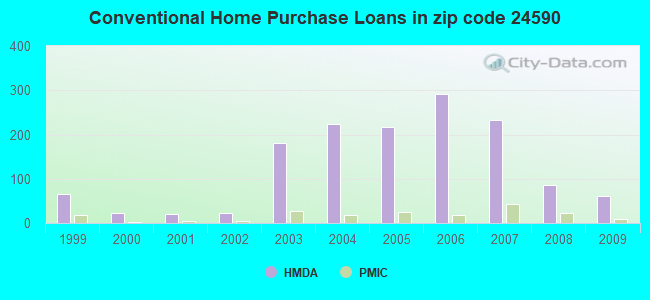
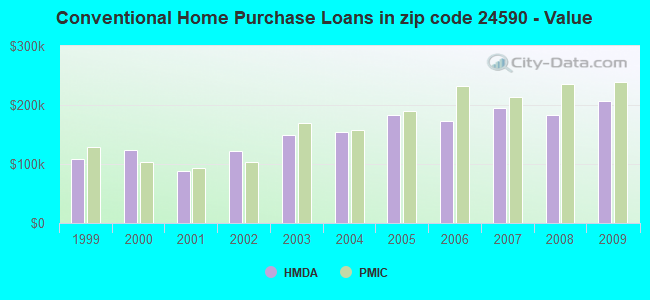
Detailed PMIC statistics for the following Tracts:0113.00
, 0114.00
2004 - 2018 National Fire Incident Reporting System (NFIRS) incidents
According to the data from the years 2004 - 2018 the average number of fires per year is 31. The highest number of fire incidents - 66 took place in 2007, and the least - 9 in 2015. The data has an increasing trend.
When looking into fire subcategories, the most incidents belonged to: Outside Fires (42.4%), and Structure Fires (38.7%).
Fire incident types reported to NFIRS in Zip Code 24590


 Nearest zip codes: 22946, 22902, 22937, 23004, 24562, 22963.


 According to the data from the years 2004 - 2018 the average number of fires per year is 31. The highest number of fire incidents - 66 took place in 2007, and the least - 9 in 2015. The data has an increasing trend.
 When looking into fire subcategories, the most incidents belonged to: Outside Fires (42.4%), and Structure Fires (38.7%).