Estimated zip code population in 2022: 4,753 Zip code population in 2010: 4,024 Zip code population in 2000: 3,565
Houses and condos: 2,121 Renter-occupied apartments: 491
% of renters here:
23%
State:
26%
March 2022 cost of living index in zip code 25420: 129.7 (high, U.S. average is 100)
Land area: 28.0 sq. mi. Water area: 0.0 sq. mi.
Population density: 170 people per square mile
(very low).
OSM Map
General Map
Google Map
MSN Map
OSM Map
General Map
Google Map
MSN Map
OSM Map
General Map
Google Map
MSN Map
OSM Map
General Map
Google Map
MSN Map
Please wait while loading the map...
Real estate property taxes paid for housing units in 2022:
This zip code:
0.4% ($1,164)
West Virginia:
0.5% ($821)
Median real estate property taxes paid for housing units with mortgages in 2022: $1,283 (0.4%) Median real estate property taxes paid for housing units with no mortgage in 2022: $894 (0.8%)
Averages for the 2020 tax year for zip code 25420, filed in 2021:
Average Adjusted Gross Income (AGI) in 2020: $63,412 (Individual Income Tax Returns)
Here:
$63,412
State:
$56,292
Salary/wage: $58,580 (reported on 86.7% of returns)
Here:
$58,580
State:
$49,093
(% of AGI for various income ranges: 1252.4% for AGIs below $25k, 3746.3% for AGIs $25k-50k, 6543.6% for AGIs $50k-75k, 9595.3% for AGIs $75k-100k, 16786.0% for AGIs $100k-200k, 56010.0% for AGIs over 200k)
Taxable interest for individuals: $763 (reported on 22.5% of returns)
This zip code:
$763
West Virginia:
$1,141
(% of AGI for various income ranges: 12.0% for AGIs below $25k, 14.6% for AGIs $25k-50k, 14.6% for AGIs $50k-75k, 21.1% for AGIs $75k-100k, 48.4% for AGIs $100k-200k, 290.0% for AGIs over 200k)
Ordinary dividends: $1,682 (reported on 10.1% of returns)
Here:
$1,682
State:
$5,456
(% of AGI for various income ranges: 6.7% for AGIs below $25k, 4.4% for AGIs $25k-50k, 40.4% for AGIs $50k-75k, 22.1% for AGIs $75k-100k, 66.8% for AGIs $100k-200k)
Net capital gain/loss in AGI: +$8,986 (reported on 10.1% of returns)
Here:
+$8,986
State:
+$11,656
(% of AGI for various income ranges: 4.9% for AGIs below $25k, 17.6% for AGIs $25k-50k, 23.6% for AGIs $50k-75k, 158.4% for AGIs $75k-100k, 344.4% for AGIs $100k-200k, 3275.0% for AGIs over 200k)
Profit/loss from business: +$10,330 (reported on 10.6% of returns)
Here:
+$10,330
State:
+$12,084
(% of AGI for various income ranges: 88.9% for AGIs below $25k, 116.6% for AGIs $25k-50k, 114.6% for AGIs $50k-75k, 169.5% for AGIs $75k-100k, 342.0% for AGIs $100k-200k)
Taxable individual retirement arrangement distribution: $15,062 (reported on 7.3% of returns)
25420:
$15,062
West Virginia:
$15,311
(% of AGI for various income ranges: 47.3% for AGIs below $25k, 35.9% for AGIs $25k-50k, 93.2% for AGIs $50k-75k, 234.7% for AGIs $75k-100k, 537.2% for AGIs $100k-200k)
Total itemized deductions: $25,669 (reported on 7.3% of returns)
Here:
$25,669
State:
$31,950
(% of AGI for various income ranges: 247.1% for AGIs $50k-75k, 317.4% for AGIs $75k-100k, 1124.8% for AGIs $100k-200k)
Charity contributions: $7,091 (reported on 5.0% of returns)
Here:
$7,091
State:
$12,364
(% of AGI for various income ranges: 40.4% for AGIs $50k-75k, 43.2% for AGIs $75k-100k, 234.0% for AGIs $100k-200k)
Taxes paid: $6,906 (reported on 7.3% of returns)
25420:
$6,906
State:
$7,665
(% of AGI for various income ranges: 53.2% for AGIs $50k-75k, 96.8% for AGIs $75k-100k, 308.8% for AGIs $100k-200k)
Earned income credit: $2,107 (reported on 13.8% of returns)
Here:
$2,107
State:
$2,258
(% of AGI for various income ranges: 86.4% for AGIs below $25k, 59.3% for AGIs $25k-50k)
Percentage of individuals using paid preparers for their 2020 taxes: 93.1%
Here:
93%
State:
93%
(% for various income ranges: 93.5% for AGIs below $25k, 96.0% for AGIs $25k-50k, 91.9% for AGIs $50k-75k, 88.5% for AGIs $75k-100k, 92.1% for AGIs $100k-200k, 100.0% for AGIs over 200k)
Averages for the 2012 tax year for zip code 25420, filed in 2013:
Average Adjusted Gross Income (AGI) in 2012: $50,750 (Individual Income Tax Returns)
Here:
$50,750
State:
$48,628
Salary/wage: $45,960 (reported on 87.2% of returns)
Here:
$45,960
State:
$42,328
(% of AGI for various income ranges: 75.5% for AGIs below $25k, 83.0% for AGIs $25k-50k, 82.7% for AGIs $50k-75k, 86.8% for AGIs $75k-100k, 79.5% for AGIs $100k-200k, 53.4% for AGIs over 200k)
Taxable interest for individuals: $698 (reported on 24.0% of returns)
This zip code:
$698
West Virginia:
$1,211
(% of AGI for various income ranges: 0.4% for AGIs below $25k, 0.2% for AGIs $25k-50k, 0.6% for AGIs $50k-75k, 0.1% for AGIs $75k-100k, 0.5% for AGIs $100k-200k)
Ordinary dividends: $1,740 (reported on 11.2% of returns)
Here:
$1,740
State:
$4,262
(% of AGI for various income ranges: 0.8% for AGIs below $25k, 0.4% for AGIs $25k-50k, 0.2% for AGIs $50k-75k, 0.2% for AGIs $75k-100k, 0.7% for AGIs $100k-200k)
Net capital gain/loss in AGI: +$6,857 (reported on 7.8% of returns)
Here:
+$6,857
State:
+$8,875
(% of AGI for various income ranges: 0.1% for AGIs $25k-50k, 0.3% for AGIs $50k-75k, 4.5% for AGIs $100k-200k)
Profit/loss from business: +$6,904 (reported on 14.0% of returns)
Here:
+$6,904
State:
+$13,636
(% of AGI for various income ranges: 10.0% for AGIs below $25k, 2.4% for AGIs $25k-50k, 0.8% for AGIs $50k-75k, 2.2% for AGIs $75k-100k)
Taxable individual retirement arrangement distribution: $11,515 (reported on 7.3% of returns)
25420:
$11,515
West Virginia:
$11,787
(% of AGI for various income ranges: 1.6% for AGIs below $25k, 1.4% for AGIs $25k-50k, 2.3% for AGIs $50k-75k, 1.7% for AGIs $75k-100k, 2.0% for AGIs $100k-200k)
Total itemized deductions: $19,871 (22% of AGI, reported on 33.0% of returns)
Here:
$19,871
State:
$21,148
Here:
22.2% of AGI
State:
18.1% of AGI
(% of AGI for various income ranges: 8.8% for AGIs below $25k, 8.5% for AGIs $25k-50k, 13.7% for AGIs $50k-75k, 14.3% for AGIs $75k-100k, 16.9% for AGIs $100k-200k, 11.4% for AGIs over 200k)
Charity contributions: $2,979 (reported on 21.8% of returns)
Here:
$2,979
State:
$4,508
(% of AGI for various income ranges: 0.6% for AGIs below $25k, 0.6% for AGIs $25k-50k, 1.2% for AGIs $50k-75k, 1.4% for AGIs $75k-100k, 2.7% for AGIs $100k-200k)
Taxes paid: $6,263 (reported on 33.0% of returns)
25420:
$6,263
State:
$8,103
(% of AGI for various income ranges: 1.2% for AGIs below $25k, 1.7% for AGIs $25k-50k, 3.3% for AGIs $50k-75k, 4.4% for AGIs $75k-100k, 6.3% for AGIs $100k-200k, 6.4% for AGIs over 200k)
Earned income credit: $2,217 (reported on 20.1% of returns)
Here:
$2,217
State:
$2,140
(% of AGI for various income ranges: 7.4% for AGIs below $25k, 1.3% for AGIs $25k-50k)
Percentage of individuals using paid preparers for their 2012 taxes: 45.3%
Here:
45%
State:
49%
(% for various income ranges: 41.5% for AGIs below $25k, 47.7% for AGIs $25k-50k, 48.4% for AGIs $50k-75k, 45.0% for AGIs $75k-100k, 56.2% for AGIs $100k-200k)
Averages for the 2004 tax year for zip code 25420, filed in 2005:
Average Adjusted Gross Income (AGI) in 2004: $38,482 (Individual Income Tax Returns)
Here:
$38,482
State:
$37,498
Salary/wage: $36,175 (reported on 89.5% of returns)
Here:
$36,175
State:
$33,645
(% of AGI for various income ranges: 111.6% for AGIs below $10k, 82.3% for AGIs $10k-25k, 86.2% for AGIs $25k-50k, 87.5% for AGIs $50k-75k, 80.8% for AGIs $75k-100k, 75.6% for AGIs over 100k)
Taxable interest for individuals: $750 (reported on 28.7% of returns)
This zip code:
$750
West Virginia:
$1,465
(% of AGI for various income ranges: 1.7% for AGIs below $10k, 0.5% for AGIs $10k-25k, 0.5% for AGIs $25k-50k, 0.4% for AGIs $50k-75k, 1.0% for AGIs $75k-100k, 0.4% for AGIs over 100k)
Taxable dividends: $1,110 (reported on 11.1% of returns)
Here:
$1,110
State:
$2,913
(% of AGI for various income ranges: 1.6% for AGIs below $10k, 0.2% for AGIs $10k-25k, 0.2% for AGIs $25k-50k, 0.3% for AGIs $50k-75k, 0.6% for AGIs $75k-100k, 0.2% for AGIs over 100k)
Net capital gain/loss: +$7,106 (reported on 8.6% of returns)
Here:
+$7,106
State:
+$6,331
(% of AGI for various income ranges: -0.1% for AGIs $10k-25k, 0.1% for AGIs $25k-50k, 1.0% for AGIs $50k-75k, 3.9% for AGIs $75k-100k, 4.6% for AGIs over 100k)
Profit/loss from business: +$8,746 (reported on 13.9% of returns)
Here:
+$8,746
State:
+$11,074
(% of AGI for various income ranges: -3.7% for AGIs below $10k, 5.8% for AGIs $10k-25k, 3.8% for AGIs $25k-50k, 2.1% for AGIs $50k-75k, 0.1% for AGIs $75k-100k, 6.1% for AGIs over 100k)
IRA payment deduction: $1,833 (reported on 0.7% of returns)
25420:
$1,833
West Virginia:
$2,796
Total itemized deductions: $15,212 (24% of AGI, reported on 30.1% of returns)
Here:
$15,212
State:
$16,976
Here:
23.9% of AGI
State:
19.0% of AGI
(% of AGI for various income ranges: 7.8% for AGIs $10k-25k, 9.8% for AGIs $25k-50k, 13.3% for AGIs $50k-75k, 13.2% for AGIs $75k-100k, 16.0% for AGIs over 100k)
Charity contributions deductions: $2,359 (4% of AGI, reported on 23.7% of returns)
Here:
$2,359
State:
$3,529
Here:
3.5% of AGI
State:
3.7% of AGI
(% of AGI for various income ranges: 1.2% for AGIs $10k-25k, 1.2% for AGIs $25k-50k, 1.7% for AGIs $50k-75k, 1.8% for AGIs $75k-100k, 1.5% for AGIs over 100k)
Total tax: $4,503 (reported on 75.2% of returns)
25420:
$4,503
State:
$5,372
(% of AGI for various income ranges: 2.6% for AGIs below $10k, 4.2% for AGIs $10k-25k, 6.8% for AGIs $25k-50k, 8.4% for AGIs $50k-75k, 10.6% for AGIs $75k-100k, 15.1% for AGIs over 100k)
Earned income credit: $1,590 (reported on 17.9% of returns)
Here:
$1,590
State:
$1,662
Percentage of individuals using paid preparers for their 2004 taxes: 54.4%
Here:
54%
State:
55%
(% for various income ranges: 47.3% for AGIs below $10k, 58.1% for AGIs $10k-25k, 55.7% for AGIs $25k-50k, 54.6% for AGIs $50k-75k, 52.2% for AGIs $75k-100k, 59.2% for AGIs over 100k)
Household received Food Stamps/SNAP in the past 12 months: 328 Household did not receive Food Stamps/SNAP in the past 12 months: 1,763
Women who had a birth in the past 12 months: 98 (62 now married, 35 unmarried) Women who did not have a birth in the past 12 months: 743 (452 now married, 290 unmarried)
Housing units in zip code 25420 with a mortgage: 1,178 (118 second mortgage, 77 both second mortgage and home equity loan) Houses without a mortgage: 25
Median monthly owner costs for units with a mortgage: $1,381 Median monthly owner costs for units without a mortgage: $351
Residents with income below the poverty level in 2022:
This zip code:
9.4%
Whole state:
17.9%
Residents with income below 50% of the poverty level in 2022:
This zip code:
4.7%
Whole state:
9.7%
Median number of rooms in houses and condos:
Here:
6.3
State:
6.5
Median number of rooms in apartments:
Here:
5.6
State:
4.7
Notable locations in this zip code not listed on our city pages
Churches in zip code 25420 include: Gerrardstown Presbyterian Church (A), Ganotown Methodist Church (B), Buck Hill Church (C), Mount Olive Church (D), Mount Pleasant Church (E), Mountain Chapel (F), Faith Tabernacle (G). Display/hide their locations on the map
GERRARDSTOWN ELEMENTARY SCHOOL (Location: 15 DOMINION ROAD, Grades: PK-2)
MOUNTAIN RIDGE MIDDLE SCHOOL (Location: 2771 GERRARDSTOWN ROAD, Grades: 6-8)
Facilities with environmental interests located in this zip code:
GERRARDSTOWN ELEMENTARY SCHOOL (15 DOMINION ROAD in GERRARDSTOWN, WV)
(Geographic Names Information System) (National Center for Education Statistics) - STATE ID-04206 Organizations: BERKELEY COUNTY SCHOOL DIST (SCHOOL DISTRICT)
63.8%Electricity
13.2%Fuel oil, kerosene, etc.
8.2%Bottled, tank, or LP gas
7.3%Wood
3.3%Other fuel
2.6%Utility gas
1.7%No fuel used
Population in 1990: 2,481. Population change in the 1990s: +1,084 (+43.7%).
Place of birth for U.S.-born residents:
This state: 1,718
Northeast: 477
Midwest: 231
South: 2,224
West: 148
57% of the 25420 zip code residents lived in the same house 5 years ago. Out of people who lived in different houses, 51% lived in this county. Out of people who lived in different counties, 50% lived in West Virginia.
92% of the 25420 zip code residents lived in the same house 1 year ago. Out of people who lived in different houses, 31% moved from this county. Out of people who lived in different houses, 39% moved from different county within same state. Out of people who lived in different houses, 32% moved from different state.
Private vs. public school enrollment:
Students in private schools in grades 1 to 8 (elementary and middle school): 15
Here:
3.5%
West Virginia:
12.2%
Students in private schools in grades 9 to 12 (high school): 12
Here:
5.1%
West Virginia:
8.8%
Students in private undergraduate colleges: 32
Here:
50.2%
West Virginia:
17.3%
Occupation by median earnings in the past 12 months ($)
112,802Construction and extraction occupations
89,192Management occupations
89,080Health diagnosing and treating practitioners and other technical occupations
75,674Computer and mathematical occupations
66,479Installation, maintenance, and repair occupations
61,313Education, training, and library occupations
Companies with federal contracts located in this zip code:
UNIVERSAL CLEANING (7164 APPLE HARVEST DR in GERRARDSTOWN, WV; small business) : $76,800 in 4 contractsfrom 2002 to 2005
$20,160 with Army for Food Services. Signed on 2005-10-01. Completion date: 2006-09-30.
$18,960, same as above.Signed on 2004-10-26. Completion date: 2005-09-30.
$18,960, same as above.Signed on 2003-10-31. Completion date: 2004-09-30.
$18,720, same as above.Signed on 2002-11-03. Completion date: 2003-09-30.
DAVE WRIGHT WELDING (1387 HORNER SAWMILL RD in GERRARDSTOWN, WV; small business)
$2,750 with Army for Maintenance, Repair and Rebuilding of Equipment -- Electrical and Electronic Equipment Components. Signed on 2005-02-16. Completion date: 2004-11-30.
Top industries in this zip code by the number of employees in 2005:
Other Services (except Public Administration): Religious Organizations (5-9 employees: 1 establishment, 1-4 employees: 2 establishments)
Construction: New Single-Family Housing Construction (except Operative Builders) (1-4: 3)
Administrative and Support and Waste Management and Remediation Services: Landscaping Services (1-4: 2)
Administrative and Support and Waste Management and Remediation Services: Janitorial Services (1-4: 2)
Other Services (except Public Administration): Pet Care (except Veterinary) Services (1-4: 1)
Other Services (except Public Administration): General Automotive Repair (1-4: 1)
Construction: Residential Remodelers (1-4: 1)
Construction: Masonry Contractors (1-4: 1)
Construction: Site Preparation Contractors (1-4: 1)
Professional, Scientific, and Technical Services: Engineering Services (1-4: 1)
Fatal accident statistics in 2013:
Fatal accident count: 3
Vehicles involved in fatal accidents: 4
Fatal accidents caused by drunken drivers: 2
Fatalities: 3
Persons involved in fatal accidents: 5
Pedestrians involved in fatal accidents: 1
Fatal accident statistics in 2010:
Fatal accident count: 2
Vehicles involved in fatal accidents: 4
Fatal accidents caused by drunken drivers: 1
Fatalities: 2
Persons involved in fatal accidents: 4
Pedestrians involved in fatal accidents: 0
Home Mortgage Disclosure Act Aggregated Statistics For Year 2009 (Based on 2 partial tracts)
A) FHA, FSA/RHS & VA Home Purchase Loans
B) Conventional Home Purchase Loans
C) Refinancings
D) Home Improvement Loans
F) Non-occupant Loans on < 5 Family Dwellings (A B C & D)
G) Loans On Manufactured Home Dwelling (A B C & D)
Number
Average Value
Number
Average Value
Number
Average Value
Number
Average Value
Number
Average Value
Number
Average Value
LOANS ORIGINATED
23
$168,730
23
$144,349
110
$179,993
15
$57,134
11
$117,365
5
$77,486
APPLICATIONS APPROVED, NOT ACCEPTED
1
$148,760
5
$142,814
10
$180,134
1
$188,220
3
$122,677
0
$0
APPLICATIONS DENIED
4
$175,282
8
$110,199
79
$184,551
8
$110,765
3
$142,080
6
$134,103
APPLICATIONS WITHDRAWN
4
$128,875
3
$176,577
45
$198,611
2
$93,465
2
$160,085
3
$102,410
FILES CLOSED FOR INCOMPLETENESS
0
$0
0
$0
7
$225,641
0
$0
1
$133,890
1
$69,850
Aggregated Statistics For Year 2008 (Based on 2 partial tracts)
A) FHA, FSA/RHS & VA Home Purchase Loans
B) Conventional Home Purchase Loans
C) Refinancings
D) Home Improvement Loans
F) Non-occupant Loans on < 5 Family Dwellings (A B C & D)
G) Loans On Manufactured Home Dwelling (A B C & D)
Number
Average Value
Number
Average Value
Number
Average Value
Number
Average Value
Number
Average Value
Number
Average Value
LOANS ORIGINATED
24
$187,383
36
$177,798
100
$177,521
23
$64,399
14
$133,472
11
$103,958
APPLICATIONS APPROVED, NOT ACCEPTED
1
$25,230
5
$166,356
12
$157,334
3
$30,617
1
$93,790
1
$25,230
APPLICATIONS DENIED
7
$151,351
6
$141,865
74
$194,818
12
$45,060
3
$85,593
6
$78,478
APPLICATIONS WITHDRAWN
3
$173,557
5
$181,622
32
$194,667
1
$54,980
1
$235,440
1
$47,220
FILES CLOSED FOR INCOMPLETENESS
1
$183,040
4
$210,695
6
$221,098
1
$86,670
0
$0
0
$0
Aggregated Statistics For Year 2007 (Based on 2 partial tracts)
A) FHA, FSA/RHS & VA Home Purchase Loans
B) Conventional Home Purchase Loans
C) Refinancings
D) Home Improvement Loans
E) Loans on Dwellings For 5+ Families
F) Non-occupant Loans on < 5 Family Dwellings (A B C & D)
G) Loans On Manufactured Home Dwelling (A B C & D)
Number
Average Value
Number
Average Value
Number
Average Value
Number
Average Value
Number
Average Value
Number
Average Value
Number
Average Value
LOANS ORIGINATED
10
$186,796
60
$186,257
165
$151,841
38
$49,974
1
$119,660
10
$110,603
24
$107,665
APPLICATIONS APPROVED, NOT ACCEPTED
1
$52,390
9
$134,893
26
$188,418
2
$45,275
0
$0
1
$555,600
3
$97,667
APPLICATIONS DENIED
3
$163,640
21
$161,885
99
$175,969
23
$62,683
0
$0
6
$169,138
13
$91,945
APPLICATIONS WITHDRAWN
0
$0
14
$203,927
34
$194,592
5
$95,080
0
$0
3
$216,463
1
$100,250
FILES CLOSED FOR INCOMPLETENESS
0
$0
2
$231,880
16
$208,957
0
$0
0
$0
1
$62,090
0
$0
Aggregated Statistics For Year 2006 (Based on 2 partial tracts)
A) FHA, FSA/RHS & VA Home Purchase Loans
B) Conventional Home Purchase Loans
C) Refinancings
D) Home Improvement Loans
F) Non-occupant Loans on < 5 Family Dwellings (A B C & D)
G) Loans On Manufactured Home Dwelling (A B C & D)
Number
Average Value
Number
Average Value
Number
Average Value
Number
Average Value
Number
Average Value
Number
Average Value
LOANS ORIGINATED
12
$172,965
97
$184,325
194
$151,208
49
$51,520
13
$126,175
21
$89,874
APPLICATIONS APPROVED, NOT ACCEPTED
1
$69,850
9
$198,856
21
$139,678
9
$82,000
1
$74,380
4
$89,098
APPLICATIONS DENIED
3
$105,430
13
$165,879
61
$168,560
18
$74,238
3
$98,097
5
$88,612
APPLICATIONS WITHDRAWN
1
$104,130
6
$105,105
41
$165,218
7
$135,551
1
$139,710
1
$11,000
FILES CLOSED FOR INCOMPLETENESS
0
$0
4
$189,350
10
$128,196
1
$65,330
1
$60,800
0
$0
Aggregated Statistics For Year 2005 (Based on 2 partial tracts)
A) FHA, FSA/RHS & VA Home Purchase Loans
B) Conventional Home Purchase Loans
C) Refinancings
D) Home Improvement Loans
F) Non-occupant Loans on < 5 Family Dwellings (A B C & D)
G) Loans On Manufactured Home Dwelling (A B C & D)
Number
Average Value
Number
Average Value
Number
Average Value
Number
Average Value
Number
Average Value
Number
Average Value
LOANS ORIGINATED
12
$155,447
144
$163,748
193
$142,262
43
$50,586
26
$142,022
19
$97,224
APPLICATIONS APPROVED, NOT ACCEPTED
1
$157,170
16
$141,407
19
$140,492
5
$53,814
0
$0
6
$96,482
APPLICATIONS DENIED
1
$201,150
32
$119,254
72
$146,581
30
$53,318
5
$88,740
14
$62,231
APPLICATIONS WITHDRAWN
2
$166,550
10
$181,815
34
$129,170
6
$295,912
1
$139,710
3
$115,130
FILES CLOSED FOR INCOMPLETENESS
1
$61,450
5
$164,158
8
$125,964
0
$0
0
$0
2
$80,205
Aggregated Statistics For Year 2004 (Based on 2 partial tracts)
A) FHA, FSA/RHS & VA Home Purchase Loans
B) Conventional Home Purchase Loans
C) Refinancings
D) Home Improvement Loans
F) Non-occupant Loans on < 5 Family Dwellings (A B C & D)
G) Loans On Manufactured Home Dwelling (A B C & D)
Number
Average Value
Number
Average Value
Number
Average Value
Number
Average Value
Number
Average Value
Number
Average Value
LOANS ORIGINATED
23
$149,551
113
$137,683
143
$131,418
25
$43,956
19
$103,488
14
$83,437
APPLICATIONS APPROVED, NOT ACCEPTED
1
$142,940
15
$124,185
21
$116,147
5
$41,266
3
$73,737
3
$53,683
APPLICATIONS DENIED
4
$98,312
26
$101,498
55
$105,087
25
$15,756
3
$70,500
14
$37,422
APPLICATIONS WITHDRAWN
1
$153,940
13
$158,615
25
$124,703
5
$62,352
3
$65,543
2
$66,295
FILES CLOSED FOR INCOMPLETENESS
0
$0
6
$145,962
3
$125,263
0
$0
0
$0
0
$0
Aggregated Statistics For Year 2003 (Based on 2 partial tracts)
A) FHA, FSA/RHS & VA Home Purchase Loans
B) Conventional Home Purchase Loans
C) Refinancings
D) Home Improvement Loans
F) Non-occupant Loans on < 5 Family Dwellings (A B C & D)
Number
Average Value
Number
Average Value
Number
Average Value
Number
Average Value
Number
Average Value
LOANS ORIGINATED
11
$141,766
81
$128,418
217
$112,403
22
$32,428
19
$112,135
APPLICATIONS APPROVED, NOT ACCEPTED
1
$161,700
10
$80,268
22
$112,249
3
$40,533
1
$73,740
APPLICATIONS DENIED
3
$109,523
18
$87,642
70
$90,016
17
$15,447
3
$73,950
APPLICATIONS WITHDRAWN
2
$95,725
10
$86,348
46
$100,099
2
$14,875
2
$61,770
FILES CLOSED FOR INCOMPLETENESS
0
$0
4
$123,540
14
$116,747
1
$4,530
1
$43,980
Aggregated Statistics For Year 2002 (Based on 2 partial tracts)
A) FHA, FSA/RHS & VA Home Purchase Loans
B) Conventional Home Purchase Loans
C) Refinancings
D) Home Improvement Loans
F) Non-occupant Loans on < 5 Family Dwellings (A B C & D)
Number
Average Value
Number
Average Value
Number
Average Value
Number
Average Value
Number
Average Value
LOANS ORIGINATED
18
$107,836
55
$111,414
122
$102,555
14
$28,967
10
$98,702
APPLICATIONS APPROVED, NOT ACCEPTED
1
$64,030
6
$89,258
16
$88,450
4
$18,435
1
$160,410
APPLICATIONS DENIED
2
$79,235
12
$103,057
50
$108,261
11
$43,159
3
$19,403
APPLICATIONS WITHDRAWN
1
$89,910
3
$121,813
21
$103,919
3
$18,327
1
$25,870
FILES CLOSED FOR INCOMPLETENESS
0
$0
3
$132,163
8
$88,208
0
$0
1
$71,150
Aggregated Statistics For Year 2001 (Based on 2 partial tracts)
A) FHA, FSA/RHS & VA Home Purchase Loans
B) Conventional Home Purchase Loans
C) Refinancings
D) Home Improvement Loans
F) Non-occupant Loans on < 5 Family Dwellings (A B C & D)
Number
Average Value
Number
Average Value
Number
Average Value
Number
Average Value
Number
Average Value
LOANS ORIGINATED
12
$83,060
29
$85,288
88
$88,310
12
$11,750
5
$70,890
APPLICATIONS APPROVED, NOT ACCEPTED
1
$87,960
6
$65,218
8
$69,935
1
$5,820
0
$0
APPLICATIONS DENIED
1
$88,610
14
$57,149
44
$72,971
8
$9,136
1
$34,930
APPLICATIONS WITHDRAWN
1
$186,930
6
$75,028
10
$59,053
3
$19,403
2
$72,120
FILES CLOSED FOR INCOMPLETENESS
0
$0
1
$51,740
4
$89,420
0
$0
0
$0
Aggregated Statistics For Year 2000 (Based on 2 partial tracts)
A) FHA, FSA/RHS & VA Home Purchase Loans
B) Conventional Home Purchase Loans
C) Refinancings
D) Home Improvement Loans
F) Non-occupant Loans on < 5 Family Dwellings (A B C & D)
Number
Average Value
Number
Average Value
Number
Average Value
Number
Average Value
Number
Average Value
LOANS ORIGINATED
16
$88,976
45
$88,612
35
$80,000
7
$22,730
7
$81,034
APPLICATIONS APPROVED, NOT ACCEPTED
1
$102,840
3
$36,220
10
$72,506
2
$15,845
0
$0
APPLICATIONS DENIED
2
$82,465
23
$55,625
37
$53,632
6
$17,032
0
$0
APPLICATIONS WITHDRAWN
1
$64,680
3
$114,053
14
$83,946
4
$19,890
1
$44,630
FILES CLOSED FOR INCOMPLETENESS
0
$0
0
$0
5
$81,108
0
$0
0
$0
Aggregated Statistics For Year 1999 (Based on 1 partial tract)
A) FHA, FSA/RHS & VA Home Purchase Loans
B) Conventional Home Purchase Loans
C) Refinancings
D) Home Improvement Loans
F) Non-occupant Loans on < 5 Family Dwellings (A B C & D)
Detailed PMIC statistics for the following Tracts:9718.00
2003 - 2018 National Fire Incident Reporting System (NFIRS) incidents
According to the data from the years 2003 - 2018 the average number of fires per year is 20. The highest number of fire incidents - 30 took place in 2011, and the least - 3 in 2003. The data has a growing trend.
When looking into fire subcategories, the most incidents belonged to: Structure Fires (46.3%), and Outside Fires (40.6%).
Fire incident types reported to NFIRS in Zip Code 25420

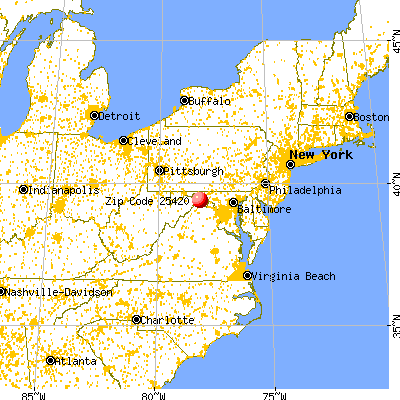


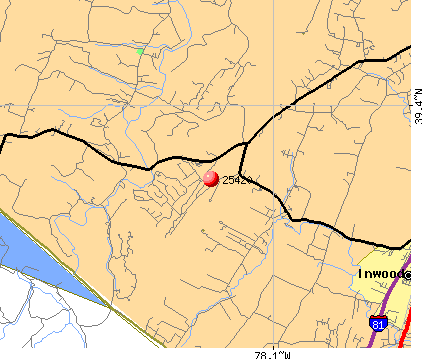 Nearest zip codes: 25413, 25428, 22624, 22603, 25403, 25427.


 (Students: 383, Location: 2691 GERRARDSTOWN ROAD, Grades: 3-5)


 According to the data from the years 2003 - 2018 the average number of fires per year is 20. The highest number of fire incidents - 30 took place in 2011, and the least - 3 in 2003. The data has a growing trend.
 When looking into fire subcategories, the most incidents belonged to: Structure Fires (46.3%), and Outside Fires (40.6%).