Estimated zip code population in 2022: 1,566 Zip code population in 2010: 3,044 Zip code population in 2000: 3,417
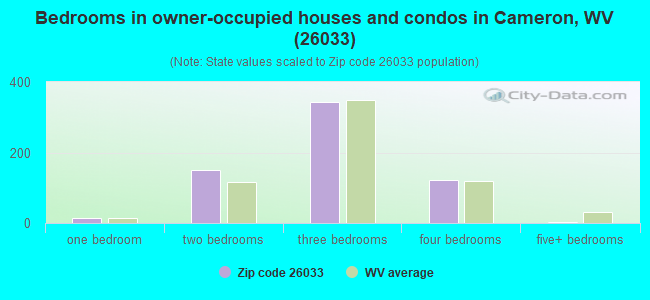
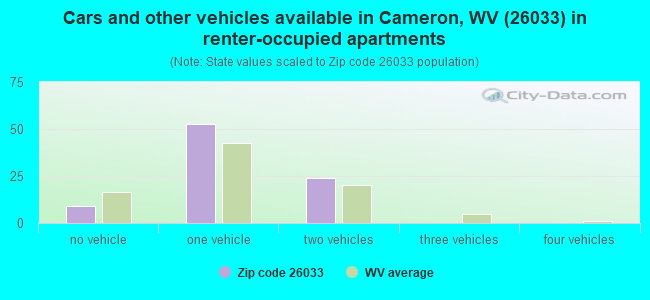
Houses and condos: 1,320 Renter-occupied apartments: 85
% of renters here:
12%
State:
26%
March 2022 cost of living index in zip code 26033: 81.9 (low, U.S. average is 100)
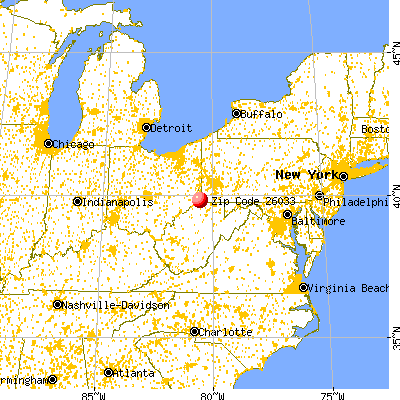
Land area: 93.0 sq. mi. Water area: 0.3 sq. mi.
Population density: 17 people per square mile
(very low).
OSM Map
General Map
Google Map
MSN Map
OSM Map
General Map
Google Map
MSN Map
OSM Map
General Map
Google Map
MSN Map
OSM Map
General Map
Google Map
MSN Map
Please wait while loading the map...
Real estate property taxes paid for housing units in 2022:
This zip code:
0.4% ($604)
West Virginia:
0.5% ($821)
Median real estate property taxes paid for housing units with mortgages in 2022: $843 (0.5%) Median real estate property taxes paid for housing units with no mortgage in 2022: $488 (0.4%)
Business Search- 14 Million verified businesses
Males: 798
(51.0%)
Females: 767
(49.0%)
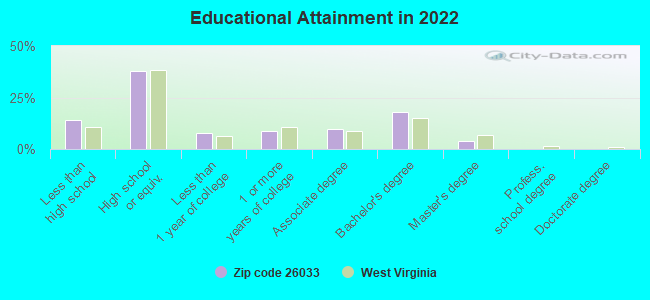
For population 25 years and over in 26033:
High school or higher: 86.1%
Bachelor's degree or higher: 21.8%
Graduate or professional degree: 3.9%
Unemployed: 2.6%
Mean travel time to work (commute): 30.9 minutes
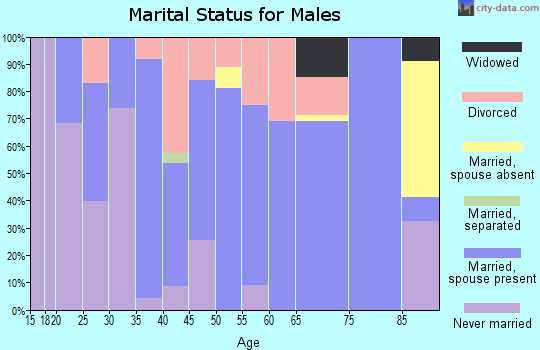
For population 15 years and over in 26033:
Never married: 19.0%
Now married: 60.8%
Separated: 0.4%
Widowed: 11.6%
Divorced: 8.2%
Zip code 26033 compared to state average:
Unemployed percentage below state average.
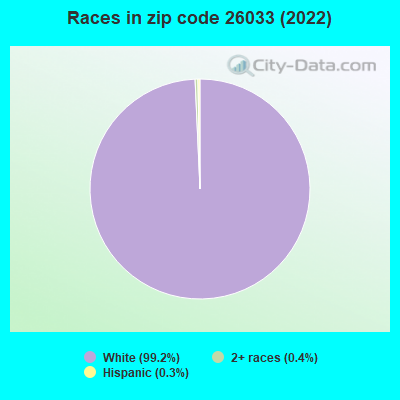
Black race population percentage significantly below state average.
Hispanic race population percentage significantly below state average.
Median age significantly above state average.
Foreign-born population percentage significantly below state average.
Renting percentage below state average.
Length of stay since moving in below state average.
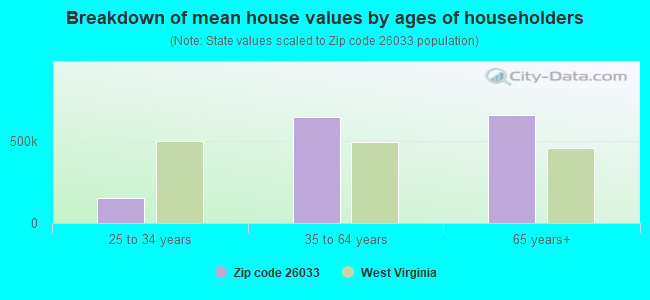
Estimated median house/condo value in 2022: $145,951
26033:
$145,951
West Virginia:
$155,100
According to our research of West Virginia and other state lists, there were 7 registered sex offenders living in 26033 zip code as of June 16, 2024. The ratio of all residents to sex offenders in zip code 26033 is 388 to 1. The ratio of registered sex offenders to all residents in this zip code is near the state average.
Median resident age:
This zip code:
57.4 years
West Virginia median age:
42.9 years
Average household size:
This zip code:
2.2 people
West Virginia:
2.3 people
Averages for the 2020 tax year for zip code 26033, filed in 2021:
Average Adjusted Gross Income (AGI) in 2020: $56,540 (Individual Income Tax Returns)
Here:
$56,540
State:
$56,292
Salary/wage: $49,532 (reported on 72.1% of returns)
Here:
$49,532
State:
$49,093
(% of AGI for various income ranges: 885.7% for AGIs below $25k, 3071.0% for AGIs $25k-50k, 5726.7% for AGIs $50k-75k, 7721.1% for AGIs $75k-100k, 12219.1% for AGIs $100k-200k)
Taxable interest for individuals: $975 (reported on 28.8% of returns)
This zip code:
$975
West Virginia:
$1,141
(% of AGI for various income ranges: 23.0% for AGIs below $25k, 18.5% for AGIs $25k-50k, 50.0% for AGIs $50k-75k, 46.7% for AGIs $75k-100k, 33.6% for AGIs $100k-200k)
Ordinary dividends: $2,640 (reported on 13.5% of returns)
Here:
$2,640
State:
$5,456
(% of AGI for various income ranges: 5.3% for AGIs below $25k, 36.5% for AGIs $25k-50k, 108.3% for AGIs $50k-75k, 48.9% for AGIs $75k-100k, 120.9% for AGIs $100k-200k)
Net capital gain/loss in AGI: +$13,221 (reported on 12.6% of returns)
Here:
+$13,221
State:
+$11,656
(% of AGI for various income ranges: 9.7% for AGIs below $25k, 42.0% for AGIs $25k-50k, 122.5% for AGIs $50k-75k, 1446.4% for AGIs $100k-200k)
Profit/loss from business: +$3,911 (reported on 8.1% of returns)
Here:
+$3,911
State:
+$12,084
(% of AGI for various income ranges: 57.0% for AGIs below $25k, 66.5% for AGIs $25k-50k, 53.3% for AGIs $75k-100k)
Taxable individual retirement arrangement distribution: $19,227 (reported on 9.9% of returns)
26033:
$19,227
West Virginia:
$15,311
(% of AGI for various income ranges: 51.3% for AGIs below $25k, 154.5% for AGIs $25k-50k, 566.7% for AGIs $50k-75k, 883.6% for AGIs $100k-200k)
Total itemized deductions: $27,550 (reported on 1.8% of returns)
Here:
$27,550
State:
$31,950
(% of AGI for various income ranges: 183.7% for AGIs below $25k)
Taxes paid: $6,200 (reported on 1.8% of returns)
26033:
$6,200
State:
$7,665
(% of AGI for various income ranges: 41.3% for AGIs below $25k)
Earned income credit: $2,181 (reported on 14.4% of returns)
Here:
$2,181
State:
$2,258
(% of AGI for various income ranges: 76.3% for AGIs below $25k, 60.0% for AGIs $25k-50k)
Percentage of individuals using paid preparers for their 2020 taxes: 93.7%
Here:
94%
State:
93%
(% for various income ranges: 92.5% for AGIs below $25k, 96.2% for AGIs $25k-50k, 93.8% for AGIs $50k-75k, 90.9% for AGIs $75k-100k, 93.3% for AGIs $100k-200k, 100.0% for AGIs over 200k)
Averages for the 2012 tax year for zip code 26033, filed in 2013:
Average Adjusted Gross Income (AGI) in 2012: $58,387 (Individual Income Tax Returns)
Here:
$58,387
State:
$48,628
Salary/wage: $43,216 (reported on 79.7% of returns)
Here:
$43,216
State:
$42,328
(% of AGI for various income ranges: 63.7% for AGIs below $25k, 72.5% for AGIs $25k-50k, 78.4% for AGIs $50k-75k, 72.8% for AGIs $75k-100k, 73.4% for AGIs $100k-200k, 13.0% for AGIs over 200k)
Taxable interest for individuals: $812 (reported on 33.9% of returns)
This zip code:
$812
West Virginia:
$1,211
(% of AGI for various income ranges: 1.4% for AGIs below $25k, 1.1% for AGIs $25k-50k, 0.2% for AGIs $50k-75k, 0.3% for AGIs $75k-100k, 0.3% for AGIs $100k-200k, 0.2% for AGIs over 200k)
Ordinary dividends: $1,912 (reported on 13.6% of returns)
Here:
$1,912
State:
$4,262
(% of AGI for various income ranges: 0.9% for AGIs below $25k, 0.4% for AGIs $25k-50k, 0.4% for AGIs $50k-75k, 0.5% for AGIs $75k-100k, 0.9% for AGIs $100k-200k)
Net capital gain/loss in AGI: +$44,950 (reported on 10.2% of returns)
Here:
+$44,950
State:
+$8,875
(% of AGI for various income ranges: 0.1% for AGIs below $25k, 3.1% for AGIs $50k-75k, 3.5% for AGIs $100k-200k, 27.1% for AGIs over 200k)
Profit/loss from business: +$2,992 (reported on 11.0% of returns)
Here:
+$2,992
State:
+$13,636
(% of AGI for various income ranges: 4.2% for AGIs below $25k, 1.4% for AGIs $25k-50k, 0.5% for AGIs $50k-75k)
Taxable individual retirement arrangement distribution: $10,540 (reported on 8.5% of returns)
26033:
$10,540
West Virginia:
$11,787
(% of AGI for various income ranges: 2.6% for AGIs below $25k, 2.4% for AGIs $25k-50k, 1.7% for AGIs $50k-75k, 4.7% for AGIs $75k-100k)
Total itemized deductions: $21,447 (15% of AGI, reported on 16.1% of returns)
Here:
$21,447
State:
$21,148
Here:
15.0% of AGI
State:
18.1% of AGI
(% of AGI for various income ranges: 6.2% for AGIs below $25k, 6.3% for AGIs $50k-75k, 5.7% for AGIs $75k-100k, 9.4% for AGIs $100k-200k, 5.8% for AGIs over 200k)
Charity contributions: $3,073 (reported on 9.3% of returns)
Here:
$3,073
State:
$4,508
(% of AGI for various income ranges: 0.7% for AGIs $50k-75k, 0.6% for AGIs $75k-100k, 1.3% for AGIs $100k-200k)
Taxes paid: $9,016 (reported on 16.1% of returns)
26033:
$9,016
State:
$8,103
(% of AGI for various income ranges: 1.0% for AGIs below $25k, 1.4% for AGIs $50k-75k, 1.7% for AGIs $75k-100k, 4.1% for AGIs $100k-200k, 4.2% for AGIs over 200k)
Earned income credit: $2,076 (reported on 17.8% of returns)
Here:
$2,076
State:
$2,140
(% of AGI for various income ranges: 5.8% for AGIs below $25k, 1.3% for AGIs $25k-50k)
Percentage of individuals using paid preparers for their 2012 taxes: 62.7%
Here:
63%
State:
49%
(% for various income ranges: 55.6% for AGIs below $25k, 60.0% for AGIs $25k-50k, 66.7% for AGIs $50k-75k, 66.7% for AGIs $75k-100k, 81.8% for AGIs $100k-200k, 75.0% for AGIs over 200k)
Averages for the 2004 tax year for zip code 26033, filed in 2005:
Average Adjusted Gross Income (AGI) in 2004: $30,846 (Individual Income Tax Returns)
Here:
$30,846
State:
$37,498
Salary/wage: $29,952 (reported on 84.2% of returns)
Here:
$29,952
State:
$33,645
(% of AGI for various income ranges: 86.4% for AGIs below $10k, 74.3% for AGIs $10k-25k, 83.3% for AGIs $25k-50k, 85.1% for AGIs $50k-75k, 87.2% for AGIs $75k-100k, 64.8% for AGIs over 100k)
Taxable interest for individuals: $1,161 (reported on 34.8% of returns)
This zip code:
$1,161
West Virginia:
$1,465
(% of AGI for various income ranges: 6.6% for AGIs below $10k, 2.4% for AGIs $10k-25k, 1.3% for AGIs $25k-50k, 0.6% for AGIs $50k-75k, 0.4% for AGIs $75k-100k, 0.9% for AGIs over 100k)
Taxable dividends: $1,523 (reported on 14.8% of returns)
Here:
$1,523
State:
$2,913
(% of AGI for various income ranges: 2.4% for AGIs below $10k, 0.8% for AGIs $10k-25k, 0.6% for AGIs $25k-50k, 0.8% for AGIs $50k-75k, 0.5% for AGIs $75k-100k, 0.6% for AGIs over 100k)
Net capital gain/loss: +$942 (reported on 10.5% of returns)
Here:
+$942
State:
+$6,331
(% of AGI for various income ranges: 0.6% for AGIs below $10k, 0.7% for AGIs $10k-25k, 0.1% for AGIs $25k-50k, -0.3% for AGIs $50k-75k, 0.1% for AGIs $75k-100k, 2.8% for AGIs over 100k)
Profit/loss from business: +$3,247 (reported on 11.2% of returns)
Here:
+$3,247
State:
+$11,074
(% of AGI for various income ranges: 5.2% for AGIs below $10k, 3.9% for AGIs $10k-25k, 1.5% for AGIs $25k-50k, -0.3% for AGIs $50k-75k)
IRA payment deduction: $2,696 (reported on 1.8% of returns)
26033:
$2,696
West Virginia:
$2,796
Total itemized deductions: $14,736 (25% of AGI, reported on 11.4% of returns)
Here:
$14,736
State:
$16,976
Here:
25.2% of AGI
State:
19.0% of AGI
(% of AGI for various income ranges: 2.0% for AGIs $10k-25k, 5.1% for AGIs $25k-50k, 6.8% for AGIs $50k-75k, 11.0% for AGIs $75k-100k)
Charity contributions deductions: $1,777 (3% of AGI, reported on 7.2% of returns)
Here:
$1,777
State:
$3,529
Here:
3.0% of AGI
State:
3.7% of AGI
Total tax: $3,474 (reported on 68.0% of returns)
26033:
$3,474
State:
$5,372
(% of AGI for various income ranges: 2.6% for AGIs below $10k, 3.7% for AGIs $10k-25k, 5.8% for AGIs $25k-50k, 8.5% for AGIs $50k-75k, 10.9% for AGIs $75k-100k, 16.9% for AGIs over 100k)
Earned income credit: $1,616 (reported on 21.6% of returns)
Here:
$1,616
State:
$1,662
Percentage of individuals using paid preparers for their 2004 taxes: 63.0%
Here:
63%
State:
55%
(% for various income ranges: 58.0% for AGIs below $10k, 63.3% for AGIs $10k-25k, 60.9% for AGIs $25k-50k, 71.8% for AGIs $50k-75k, 67.1% for AGIs $75k-100k, 77.3% for AGIs over 100k)
Likely homosexual households (counted as self-reported same-sex unmarried-partner households)
Lesbian couples: 0.0% of all households
Gay men: 0.4% of all households
Household received Food Stamps/SNAP in the past 12 months: 105 Household did not receive Food Stamps/SNAP in the past 12 months: 611
Women who had a birth in the past 12 months: 6 (0 now married, 5 unmarried) Women who did not have a birth in the past 12 months: 179 (114 now married, 64 unmarried)
Housing units in zip code 26033 with a mortgage: 226 (11 second mortgage, 7 both second mortgage and home equity loan) Houses without a mortgage: 13
Median monthly owner costs for units with a mortgage: $934 Median monthly owner costs for units without a mortgage: $373
Residents with income below the poverty level in 2022:
This zip code:
13.1%
Whole state:
17.9%
Residents with income below 50% of the poverty level in 2022:
This zip code:
5.8%
Whole state:
9.7%
Median number of rooms in houses and condos:
Here:
6.4
State:
6.5
Median number of rooms in apartments:
Here:
5.1
State:
4.7
Notable locations in this zip code not listed on our city pages
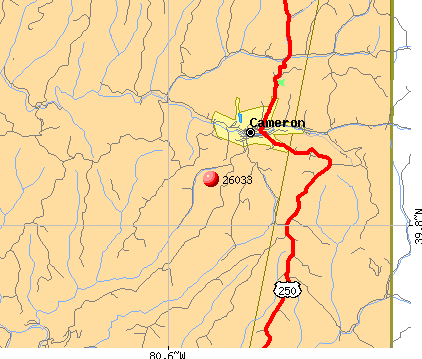
Notable locations in zip code 26033: Welling Tunnel (A), Harshs Sugar Camp (B), Beelers Station (C), Board Tree (D), Cameron Volunteer Emergency Squad Incorporated (E), Cameron City Hall (F), Big Run Community Center (G), Adaline Community Center (H), Pleasant Valley Community Center (I), Mount Hope Community Center (J), Cameron Volunteer Fire Department (K). Display/hide their locations on the map
Churches in zip code 26033 include: Upper Wolf Run Presbyterian Church (A), Shepherd United Methodist Church (B), McCabe Church (C), Mount Joy Church (D), Mount Zion Church (E), Rock Lick Church (F), Saint Martins Catholic Church (G), House of Prayer Church (H), First United Methodist Church (I). Display/hide their locations on the map
Cemeteries: Highland Cemetery (1), Fall Run Cemetery (2), Hall-Doty-Lewis-Bruhn-Chambers Cemetery (3), Yoho Cemetery (4), White Cemetery (5), Strope Cemetery (6), Shepherd Cemetery (7). Display/hide their locations on the map
Streams, rivers, and creeks: Straight Run (A), North Fork Grave Creek (B), Left Fork Maggoty Run (C), Laurel Run (D), Howard Run (E), Granny Run (F), Fourmile Run (G), Burch Run (H), Browns Run (I). Display/hide their locations on the map
In group quarters: 9 (-1 institutionalized population)
Size of family households: 350 2-persons, 87 3-persons, 10 4-persons, 17 5-persons, 3 7-or-more-persons
Size of nonfamily households: 211 1-person, 39 2-persons
111 married couples with children.
50 single-parent households (4 men, 46 women).
99.6% of residents of 26033 zip code speak English at home.
0.9% of residents speak other language at home (100% very well).
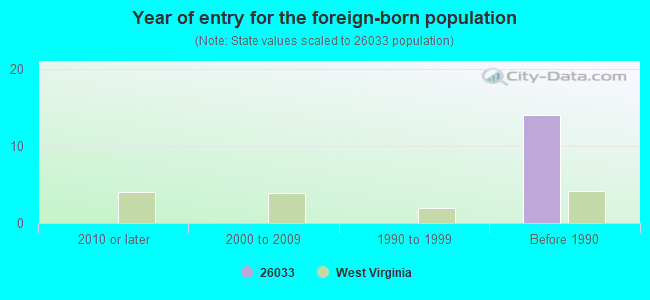
Foreign born population: 0 (0.0%)
:
0.0%
Whole state:
1.8%
23%American
23%German
22%English
6%Norwegian
5%European
4%Irish
2%Polish
Year of entry for the foreign-born population
02010 or later
02000 to 2009
01990 to 1999
14Before 1990
Facilities with environmental interests located in this zip code:
COLUMBIA GAS TRANSMISSION CORPORATION (RD #5 BOX 100 in CAMERON, WV)
AIR MAJOR (AIRS/AFS) - ICIS-, ENFORCEMENT/COMPLIANCE ACTIVITY CRITERIA AND HAZARDOUS AIR POLLUTANT INVENTORY (Inventory of air pollution sources) HAZARDOUS WASTE BIENNIAL REPORTER (Resource Conservation and Recovery Act (tracking hazardous waste)) Large Quantity Generators, more that 1000 kg of hazardous waste/month (Resource Conservation and Recovery Act (tracking hazardous waste)) - notification (Resource Conservation and Recovery Act (tracking hazardous waste)) Business SIC classification: CRUDE PETROLEUM AND NATURAL GAS; NATURAL GAS TRANSMISSION Business NAICS classification: PIPELINE TRANSPORTATION OF NATURAL GAS. Organizations: OPERNAME (CONTACT/OPERATOR)
Alternative names: CGST-ADALINE COMPRESSOR STATION, COLUMBIA GAS ADALINE COMPRESSOR STA, COLUMBIA GAS - ADALINE CS, COLUMBIA GAS - ADALINE CS/DH, TCO-ADALINE COMPR STA & OPS CT
E LITE DIV OF CRAFTLITE (958 PENNSYLVANIA AVE in CAMERON, WV)
(Resource Conservation and Recovery Act (tracking hazardous waste)) Organizations: OPERNAME (CONTACT/OPERATOR)
, GENLYTE (CONTACT/OWNER)
Alternative names: CRAFT LITE
National Pollutant Discharge Elimination System NON-MAJOR (Tracking pollutant discharge elimination systems) - permit Business SIC classification: COIN-OPERATED LAUNDRIES AND DRYCLEANING Organizations: DERROWS MOUNTAINEER MART LLC (CONTACT/OWNER)
Alternative names: HAMMEL'S LAUNDROMAT
CLOUSTON FOOTBALL FIELD (2700 E. 4TH STREET in CAMERON, WV)
National Pollutant Discharge Elimination System NON-MAJOR (Tracking pollutant discharge elimination systems) - permit Business SIC classification: SEWERAGE SYSTEMS Alternative names: MARSHALL CNTY BD OF ED
COLUMBIA GAS - CAMERON FIELD OFFICE (113 PENNSYLVANIA AVENUE in CAMERON, WV)
(Resource Conservation and Recovery Act (tracking hazardous waste))
Housing units lacking complete plumbing facilities: 26.3% Housing units lacking complete kitchen facilities: 23.7%
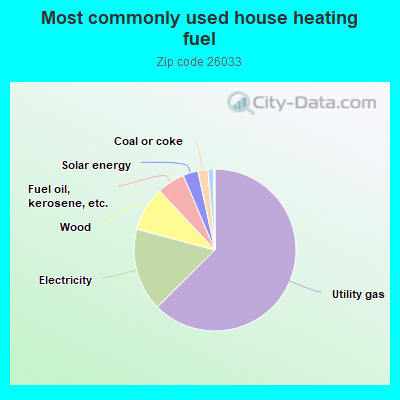
62.8%Utility gas
16.6%Electricity
8.9%Wood
5.6%Fuel oil, kerosene, etc.
3.0%Solar energy
2.0%Coal or coke
1.1%Bottled, tank, or LP gas
Population in 1990: 2,743. Population change in the 1990s: +674 (+24.6%).
Place of birth for U.S.-born residents:
This state: 1,262
Northeast: 108
Midwest: 91
South: 34
West: 34
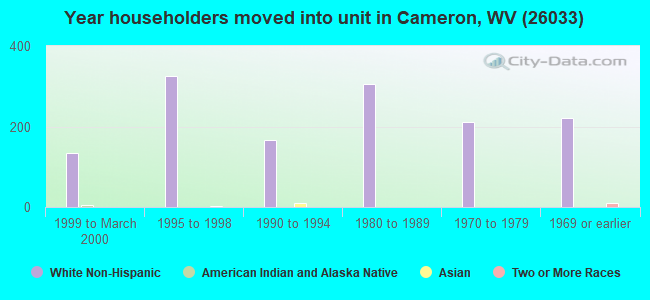
68% of the 26033 zip code residents lived in the same house 5 years ago. Out of people who lived in different houses, 52% lived in this county. Out of people who lived in different counties, 50% lived in West Virginia.
91% of the 26033 zip code residents lived in the same house 1 year ago. Out of people who lived in different houses, 70% moved from this county. Out of people who lived in different houses, 26% moved from different county within same state. Out of people who lived in different houses, 1% moved from different state.
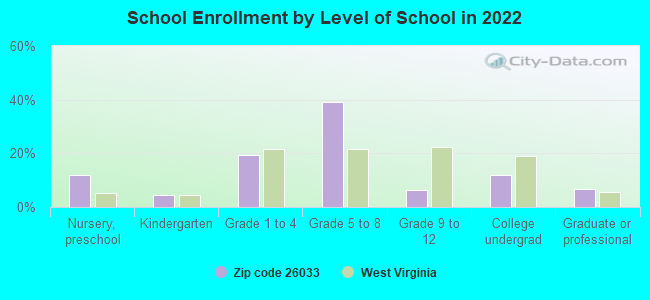
Private vs. public school enrollment:
Students in private schools in grades 1 to 8 (elementary and middle school):
Here:
0.0%
West Virginia:
12.2%
Students in private schools in grades 9 to 12 (high school):
Here:
0.0%
West Virginia:
8.8%
Students in private undergraduate colleges:
Here:
3.5%
West Virginia:
17.3%
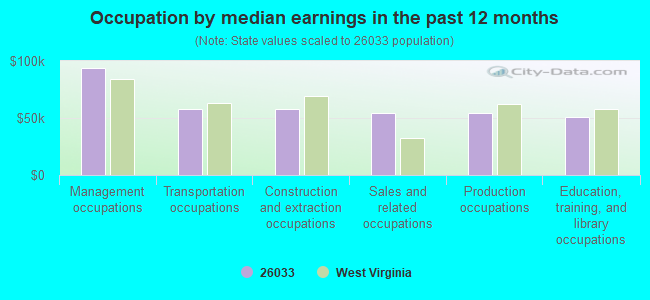
Occupation by median earnings in the past 12 months ($)
93,630Management occupations
58,290Transportation occupations
57,997Construction and extraction occupations
54,222Sales and related occupations
53,991Production occupations
50,678Education, training, and library occupations
Top industries in this zip code by the number of employees in 2005:
Health Care and Social Assistance: Nursing Care Facilities (50-99 employees: 1 establishment)
Accommodation and Food Services: Full-Service Restaurants (5-9: 1, 1-4: 3)
Other Services (except Public Administration): Religious Organizations (1-4: 5)
People in group quarters in 2000:
59 people in nursing homes
Fatal accident statistics in 2012:
Fatal accident count: 1
Vehicles involved in fatal accidents: 1
Fatal accidents caused by drunken drivers: 1
Fatalities: 1
Persons involved in fatal accidents: 2
Pedestrians involved in fatal accidents: 0
Fatal accident statistics in 2011:
Fatal accident count: 2
Vehicles involved in fatal accidents: 3
Fatal accidents caused by drunken drivers: 1
Fatalities: 2
Persons involved in fatal accidents: 4
Pedestrians involved in fatal accidents: 0
Home Mortgage Disclosure Act Aggregated Statistics For Year 2009 (Based on 6 partial tracts)
A) FHA, FSA/RHS & VA Home Purchase Loans
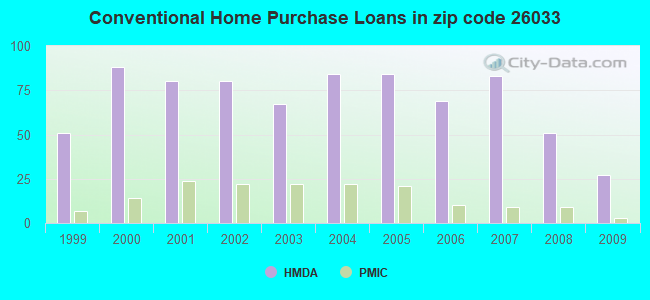
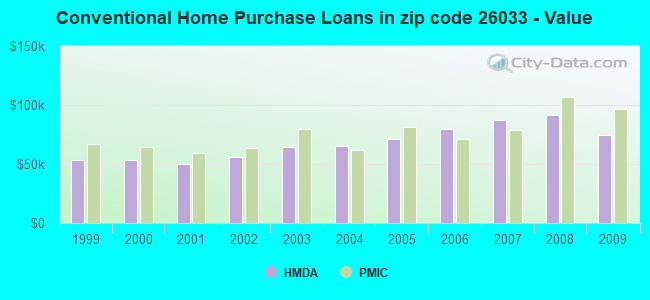
B) Conventional Home Purchase Loans
C) Refinancings
D) Home Improvement Loans
F) Non-occupant Loans on < 5 Family Dwellings (A B C & D)
G) Loans On Manufactured Home Dwelling (A B C & D)
Number
Average Value
Number
Average Value
Number
Average Value
Number
Average Value
Number
Average Value
Number
Average Value
LOANS ORIGINATED
18
$97,128
27
$74,374
93
$91,607
29
$31,442
11
$56,402
10
$44,869
APPLICATIONS APPROVED, NOT ACCEPTED
0
$0
7
$69,196
11
$91,294
3
$48,830
3
$39,367
4
$51,650
APPLICATIONS DENIED
4
$80,485
23
$61,312
60
$73,420
21
$22,053
5
$64,644
10
$66,448
APPLICATIONS WITHDRAWN
2
$154,840
5
$118,600
25
$83,475
3
$20,597
2
$155,085
2
$74,620
FILES CLOSED FOR INCOMPLETENESS
0
$0
2
$217,085
3
$85,507
0
$0
1
$5,970
0
$0
Aggregated Statistics For Year 2008 (Based on 6 partial tracts)
A) FHA, FSA/RHS & VA Home Purchase Loans
B) Conventional Home Purchase Loans
C) Refinancings
D) Home Improvement Loans
F) Non-occupant Loans on < 5 Family Dwellings (A B C & D)
G) Loans On Manufactured Home Dwelling (A B C & D)
Number
Average Value
Number
Average Value
Number
Average Value
Number
Average Value
Number
Average Value
Number
Average Value
LOANS ORIGINATED
21
$82,916
51
$91,228
91
$72,581
42
$32,994
9
$83,998
11
$36,782
APPLICATIONS APPROVED, NOT ACCEPTED
0
$0
4
$101,378
12
$73,851
4
$72,282
1
$59,580
3
$73,123
APPLICATIONS DENIED
9
$73,180
23
$60,270
62
$71,505
40
$29,322
6
$34,713
14
$54,634
APPLICATIONS WITHDRAWN
1
$58,570
11
$103,450
26
$85,453
5
$80,792
3
$88,717
7
$68,174
FILES CLOSED FOR INCOMPLETENESS
0
$0
3
$317,520
0
$0
0
$0
1
$776,230
0
$0
Aggregated Statistics For Year 2007 (Based on 6 partial tracts)
A) FHA, FSA/RHS & VA Home Purchase Loans
B) Conventional Home Purchase Loans
C) Refinancings
D) Home Improvement Loans
F) Non-occupant Loans on < 5 Family Dwellings (A B C & D)
G) Loans On Manufactured Home Dwelling (A B C & D)
Number
Average Value
Number
Average Value
Number
Average Value
Number
Average Value
Number
Average Value
Number
Average Value
LOANS ORIGINATED
14
$69,125
83
$87,606
99
$68,564
54
$24,643
19
$59,505
20
$31,227
APPLICATIONS APPROVED, NOT ACCEPTED
0
$0
9
$52,291
14
$66,908
6
$20,670
0
$0
4
$70,470
APPLICATIONS DENIED
2
$55,025
16
$72,786
92
$60,211
46
$22,890
5
$24,476
12
$58,938
APPLICATIONS WITHDRAWN
0
$0
9
$71,171
32
$69,241
7
$22,270
0
$0
3
$17,787
FILES CLOSED FOR INCOMPLETENESS
1
$65,160
0
$0
6
$71,855
0
$0
0
$0
0
$0
Aggregated Statistics For Year 2006 (Based on 6 partial tracts)
A) FHA, FSA/RHS & VA Home Purchase Loans
B) Conventional Home Purchase Loans
C) Refinancings
D) Home Improvement Loans
F) Non-occupant Loans on < 5 Family Dwellings (A B C & D)
G) Loans On Manufactured Home Dwelling (A B C & D)
Number
Average Value
Number
Average Value
Number
Average Value
Number
Average Value
Number
Average Value
Number
Average Value
LOANS ORIGINATED
12
$80,178
69
$79,651
127
$59,884
61
$29,005
20
$70,714
16
$60,183
APPLICATIONS APPROVED, NOT ACCEPTED
0
$0
8
$62,605
10
$57,344
3
$18,013
2
$46,745
2
$92,550
APPLICATIONS DENIED
3
$75,753
20
$63,305
80
$60,634
36
$30,662
4
$19,248
12
$35,242
APPLICATIONS WITHDRAWN
0
$0
13
$85,281
27
$94,961
5
$56,276
3
$30,710
2
$42,825
FILES CLOSED FOR INCOMPLETENESS
0
$0
3
$56,340
3
$68,780
0
$0
0
$0
0
$0
Aggregated Statistics For Year 2005 (Based on 6 partial tracts)
A) FHA, FSA/RHS & VA Home Purchase Loans
B) Conventional Home Purchase Loans
C) Refinancings
D) Home Improvement Loans
F) Non-occupant Loans on < 5 Family Dwellings (A B C & D)
G) Loans On Manufactured Home Dwelling (A B C & D)
Number
Average Value
Number
Average Value
Number
Average Value
Number
Average Value
Number
Average Value
Number
Average Value
LOANS ORIGINATED
11
$76,517
84
$70,858
104
$69,892
39
$17,856
11
$58,679
19
$46,259
APPLICATIONS APPROVED, NOT ACCEPTED
1
$35,830
9
$55,921
29
$59,244
9
$39,147
1
$54,210
4
$56,888
APPLICATIONS DENIED
3
$82,777
25
$52,789
92
$59,615
34
$19,577
2
$16,620
10
$61,341
APPLICATIONS WITHDRAWN
0
$0
10
$80,130
28
$69,026
7
$26,470
2
$47,205
5
$65,658
FILES CLOSED FOR INCOMPLETENESS
0
$0
1
$129,520
8
$50,381
4
$48,400
0
$0
0
$0
Aggregated Statistics For Year 2004 (Based on 6 partial tracts)
A) FHA, FSA/RHS & VA Home Purchase Loans
B) Conventional Home Purchase Loans
C) Refinancings
D) Home Improvement Loans
F) Non-occupant Loans on < 5 Family Dwellings (A B C & D)
G) Loans On Manufactured Home Dwelling (A B C & D)
Number
Average Value
Number
Average Value
Number
Average Value
Number
Average Value
Number
Average Value
Number
Average Value
LOANS ORIGINATED
9
$73,664
84
$65,151
152
$62,650
45
$21,273
20
$40,846
10
$57,238
APPLICATIONS APPROVED, NOT ACCEPTED
1
$39,200
5
$68,560
19
$57,303
7
$32,317
2
$21,765
1
$80,010
APPLICATIONS DENIED
2
$79,610
22
$43,820
80
$54,926
33
$27,070
0
$0
10
$56,234
APPLICATIONS WITHDRAWN
1
$103,900
11
$76,053
37
$65,037
7
$26,916
1
$23,230
4
$77,620
FILES CLOSED FOR INCOMPLETENESS
2
$76,300
1
$106,280
6
$58,228
1
$25,680
0
$0
0
$0
Aggregated Statistics For Year 2003 (Based on 6 partial tracts)
A) FHA, FSA/RHS & VA Home Purchase Loans
B) Conventional Home Purchase Loans
C) Refinancings
D) Home Improvement Loans
F) Non-occupant Loans on < 5 Family Dwellings (A B C & D)
Number
Average Value
Number
Average Value
Number
Average Value
Number
Average Value
Number
Average Value
LOANS ORIGINATED
6
$64,637
67
$64,191
237
$61,231
36
$15,974
14
$61,567
APPLICATIONS APPROVED, NOT ACCEPTED
0
$0
6
$62,838
24
$66,779
2
$9,955
1
$55,460
APPLICATIONS DENIED
2
$42,140
16
$50,076
83
$59,680
17
$18,784
4
$36,472
APPLICATIONS WITHDRAWN
1
$182,710
11
$52,327
44
$72,984
2
$12,155
3
$41,607
FILES CLOSED FOR INCOMPLETENESS
2
$47,690
4
$108,612
11
$83,865
0
$0
1
$39,540
Aggregated Statistics For Year 2002 (Based on 6 partial tracts)
A) FHA, FSA/RHS & VA Home Purchase Loans
B) Conventional Home Purchase Loans
C) Refinancings
D) Home Improvement Loans
F) Non-occupant Loans on < 5 Family Dwellings (A B C & D)
Number
Average Value
Number
Average Value
Number
Average Value
Number
Average Value
Number
Average Value
LOANS ORIGINATED
5
$63,092
80
$55,603
153
$59,682
34
$11,336
13
$52,432
APPLICATIONS APPROVED, NOT ACCEPTED
0
$0
8
$63,876
18
$53,777
2
$18,945
0
$0
APPLICATIONS DENIED
2
$56,020
32
$48,614
93
$53,840
17
$10,597
7
$42,126
APPLICATIONS WITHDRAWN
0
$0
17
$59,367
34
$53,649
7
$7,399
3
$99,037
FILES CLOSED FOR INCOMPLETENESS
0
$0
3
$42,327
15
$67,523
0
$0
1
$83,230
Aggregated Statistics For Year 2001 (Based on 6 partial tracts)
A) FHA, FSA/RHS & VA Home Purchase Loans
B) Conventional Home Purchase Loans
C) Refinancings
D) Home Improvement Loans
F) Non-occupant Loans on < 5 Family Dwellings (A B C & D)
Number
Average Value
Number
Average Value
Number
Average Value
Number
Average Value
Number
Average Value
LOANS ORIGINATED
10
$62,158
80
$49,825
130
$56,538
54
$11,153
15
$26,270
APPLICATIONS APPROVED, NOT ACCEPTED
1
$17,400
11
$37,143
24
$46,146
7
$17,330
0
$0
APPLICATIONS DENIED
1
$35,830
38
$37,931
92
$44,680
37
$11,265
5
$25,784
APPLICATIONS WITHDRAWN
1
$38,310
11
$47,370
46
$47,096
7
$14,179
0
$0
FILES CLOSED FOR INCOMPLETENESS
0
$0
3
$68,313
8
$54,942
0
$0
0
$0
Aggregated Statistics For Year 2000 (Based on 6 partial tracts)
A) FHA, FSA/RHS & VA Home Purchase Loans
B) Conventional Home Purchase Loans
C) Refinancings
D) Home Improvement Loans
F) Non-occupant Loans on < 5 Family Dwellings (A B C & D)
Number
Average Value
Number
Average Value
Number
Average Value
Number
Average Value
Number
Average Value
LOANS ORIGINATED
1
$70,600
88
$53,508
94
$41,740
63
$8,217
11
$43,149
APPLICATIONS APPROVED, NOT ACCEPTED
0
$0
15
$37,464
15
$46,805
12
$14,081
1
$34,330
APPLICATIONS DENIED
3
$70,480
73
$34,841
79
$41,923
37
$8,869
3
$20,610
APPLICATIONS WITHDRAWN
2
$31,800
16
$43,166
43
$44,553
6
$14,695
3
$25,003
FILES CLOSED FOR INCOMPLETENESS
0
$0
1
$35,460
3
$52,793
0
$0
0
$0
Aggregated Statistics For Year 1999 (Based on 3 partial tracts)
A) FHA, FSA/RHS & VA Home Purchase Loans
B) Conventional Home Purchase Loans
C) Refinancings
D) Home Improvement Loans
F) Non-occupant Loans on < 5 Family Dwellings (A B C & D)
2003 - 2018 National Fire Incident Reporting System (NFIRS) incidents
According to the data from the years 2003 - 2018 the average number of fire incidents per year is 22. The highest number of reported fires - 35 took place in 2014, and the least - 9 in 2006. The data has an increasing trend.
When looking into fire subcategories, the most reports belonged to: Structure Fires (41.4%), and Outside Fires (32.4%).
Fire incident types reported to NFIRS in Zip Code 26033


 Nearest zip codes: 26039, 15310, 15380, 26041, 26036, 26581.


 According to the data from the years 2003 - 2018 the average number of fire incidents per year is 22. The highest number of reported fires - 35 took place in 2014, and the least - 9 in 2006. The data has an increasing trend.
 When looking into fire subcategories, the most reports belonged to: Structure Fires (41.4%), and Outside Fires (32.4%).