Estimated zip code population in 2022: 1,971 Zip code population in 2010: 1,881 Zip code population in 2000: 1,790
Houses and condos: 800 Renter-occupied apartments: 90
% of renters here:
14%
State:
26%
March 2022 cost of living index in zip code 26060: 84.6 (less than average, U.S. average is 100)
Land area: 23.7 sq. mi. Water area: 0.1 sq. mi.
Population density: 83 people per square mile
(very low).
OSM Map
General Map
Google Map
MSN Map
OSM Map
General Map
Google Map
MSN Map
OSM Map
General Map
Google Map
MSN Map
OSM Map
General Map
Google Map
MSN Map
Please wait while loading the map...
Real estate property taxes paid for housing units in 2022:
This zip code:
0.4% ($698)
West Virginia:
0.5% ($821)
Median real estate property taxes paid for housing units with mortgages in 2022: $660 (0.3%) Median real estate property taxes paid for housing units with no mortgage in 2022: $781 (0.6%)
Business Search- 14 Million verified businesses
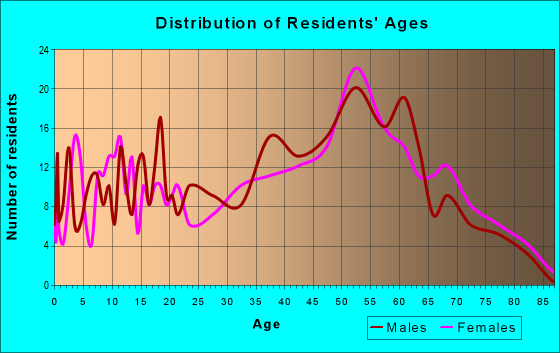
Males: 1,137
(57.8%)
Females: 832
(42.2%)
For population 25 years and over in 26060:
High school or higher: 87.5%
Bachelor's degree or higher: 18.8%
Graduate or professional degree: 7.6%
Unemployed: 1.0%
Mean travel time to work (commute): 25.6 minutes
For population 15 years and over in 26060:
Never married: 32.3%
Now married: 56.0%
Separated: 0.5%
Widowed: 4.4%
Divorced: 6.8%
Zip code 26060 compared to state average:
Unemployed percentage significantly below state average.
Black race population percentage significantly below state average.
Hispanic race population percentage significantly below state average.
Foreign-born population percentage significantly below state average.
Renting percentage below state average.
Length of stay since moving in significantly above state average.
Percentage of population with a bachelor's degree or higher below state average.
Estimated median house/condo value in 2022: $174,674
26060:
$174,674
West Virginia:
$155,100
According to our research of West Virginia and other state lists, there were 7 registered sex offenders living in 26060 zip code as of June 15, 2024. The ratio of all residents to sex offenders in zip code 26060 is 290 to 1. The ratio of registered sex offenders to all residents in this zip code is near the state average.
Median resident age:
This zip code:
41.7 years
West Virginia median age:
42.9 years
Average household size:
This zip code:
3.1 people
West Virginia:
2.3 people
Averages for the 2020 tax year for zip code 26060, filed in 2021:
Average Adjusted Gross Income (AGI) in 2020: $67,354 (Individual Income Tax Returns)
Here:
$67,354
State:
$56,292
Salary/wage: $53,227 (reported on 78.5% of returns)
Here:
$53,227
State:
$49,093
(% of AGI for various income ranges: 1032.2% for AGIs below $25k, 3577.7% for AGIs $25k-50k, 6271.2% for AGIs $50k-75k, 7662.9% for AGIs $75k-100k, 13392.5% for AGIs $100k-200k)
Taxable interest for individuals: $732 (reported on 31.6% of returns)
This zip code:
$732
West Virginia:
$1,141
(% of AGI for various income ranges: 4.4% for AGIs below $25k, 4.6% for AGIs $25k-50k, 17.5% for AGIs $50k-75k, 37.1% for AGIs $75k-100k, 125.0% for AGIs $100k-200k)
Ordinary dividends: $3,157 (reported on 17.7% of returns)
Here:
$3,157
State:
$5,456
(% of AGI for various income ranges: 27.8% for AGIs below $25k, 130.0% for AGIs $50k-75k, 84.3% for AGIs $75k-100k, 286.2% for AGIs $100k-200k)
Net capital gain/loss in AGI: +$8,900 (reported on 13.9% of returns)
Here:
+$8,900
State:
+$11,656
(% of AGI for various income ranges: 163.8% for AGIs $50k-75k, 1060.0% for AGIs $100k-200k)
Profit/loss from business: +$10,012 (reported on 10.1% of returns)
Here:
+$10,012
State:
+$12,084
(% of AGI for various income ranges: 83.3% for AGIs below $25k, 186.9% for AGIs $25k-50k, 582.9% for AGIs $75k-100k)
Taxable individual retirement arrangement distribution: $17,650 (reported on 10.1% of returns)
26060:
$17,650
West Virginia:
$15,311
(% of AGI for various income ranges: 91.1% for AGIs below $25k, 660.0% for AGIs $50k-75k, 900.0% for AGIs $100k-200k)
Total itemized deductions: $36,033 (reported on 3.8% of returns)
Here:
$36,033
State:
$31,950
(% of AGI for various income ranges: 1351.2% for AGIs $100k-200k)
Taxes paid: $8,967 (reported on 3.8% of returns)
26060:
$8,967
State:
$7,665
(% of AGI for various income ranges: 336.2% for AGIs $100k-200k)
Earned income credit: $2,036 (reported on 13.9% of returns)
Here:
$2,036
State:
$2,258
(% of AGI for various income ranges: 84.4% for AGIs below $25k, 55.4% for AGIs $25k-50k)
Percentage of individuals using paid preparers for their 2020 taxes: 93.7%
Here:
94%
State:
93%
(% for various income ranges: 95.8% for AGIs below $25k, 88.9% for AGIs $25k-50k, 100.0% for AGIs $50k-75k, 88.9% for AGIs $75k-100k, 100.0% for AGIs $100k-200k, 75.0% for AGIs over 200k)
Averages for the 2012 tax year for zip code 26060, filed in 2013:
Average Adjusted Gross Income (AGI) in 2012: $52,145 (Individual Income Tax Returns)
Here:
$52,145
State:
$48,628
Salary/wage: $42,091 (reported on 85.1% of returns)
Here:
$42,091
State:
$42,328
(% of AGI for various income ranges: 73.2% for AGIs below $25k, 74.5% for AGIs $25k-50k, 81.6% for AGIs $50k-75k, 74.3% for AGIs $75k-100k, 94.6% for AGIs $100k-200k)
Taxable interest for individuals: $509 (reported on 36.8% of returns)
This zip code:
$509
West Virginia:
$1,211
(% of AGI for various income ranges: 0.8% for AGIs below $25k, 0.9% for AGIs $25k-50k, 0.2% for AGIs $50k-75k, 0.2% for AGIs $75k-100k, 0.1% for AGIs $100k-200k, 0.3% for AGIs over 200k)
Ordinary dividends: $1,673 (reported on 17.2% of returns)
Here:
$1,673
State:
$4,262
(% of AGI for various income ranges: 0.6% for AGIs below $25k, 1.3% for AGIs $25k-50k, 0.4% for AGIs $50k-75k, 0.3% for AGIs $75k-100k, 0.7% for AGIs $100k-200k)
Net capital gain/loss in AGI: +$23,830 (reported on 11.5% of returns)
Here:
+$23,830
State:
+$8,875
(% of AGI for various income ranges: 1.6% for AGIs $25k-50k, 5.1% for AGIs $75k-100k, 17.4% for AGIs $100k-200k)
Profit/loss from business: +$20,010 (reported on 11.5% of returns)
Here:
+$20,010
State:
+$13,636
(% of AGI for various income ranges: 4.3% for AGIs below $25k, 1.3% for AGIs $25k-50k, 1.1% for AGIs $50k-75k, 15.3% for AGIs $100k-200k)
Taxable individual retirement arrangement distribution: $10,912 (reported on 9.2% of returns)
26060:
$10,912
West Virginia:
$11,787
Total itemized deductions: $21,425 (19% of AGI, reported on 18.4% of returns)
Here:
$21,425
State:
$21,148
Here:
19.0% of AGI
State:
18.1% of AGI
(% of AGI for various income ranges: 10.5% for AGIs $25k-50k, 4.9% for AGIs $50k-75k, 7.5% for AGIs $75k-100k, 15.8% for AGIs $100k-200k)
Charity contributions: $3,100 (reported on 11.5% of returns)
Here:
$3,100
State:
$4,508
(% of AGI for various income ranges: 1.5% for AGIs $25k-50k, 0.6% for AGIs $75k-100k, 1.4% for AGIs $100k-200k)
Taxes paid: $8,406 (reported on 18.4% of returns)
26060:
$8,406
State:
$8,103
(% of AGI for various income ranges: 2.3% for AGIs $25k-50k, 1.3% for AGIs $50k-75k, 2.8% for AGIs $75k-100k, 8.0% for AGIs $100k-200k)
Earned income credit: $2,167 (reported on 13.8% of returns)
Here:
$2,167
State:
$2,140
(% of AGI for various income ranges: 4.5% for AGIs below $25k, 0.9% for AGIs $25k-50k)
Percentage of individuals using paid preparers for their 2012 taxes: 50.6%
Here:
51%
State:
49%
(% for various income ranges: 41.2% for AGIs below $25k, 50.0% for AGIs $25k-50k, 53.8% for AGIs $50k-75k, 55.6% for AGIs $75k-100k, 88.9% for AGIs $100k-200k)
Averages for the 2004 tax year for zip code 26060, filed in 2005:
Average Adjusted Gross Income (AGI) in 2004: $36,068 (Individual Income Tax Returns)
Here:
$36,068
State:
$37,498
Salary/wage: $32,856 (reported on 87.5% of returns)
Here:
$32,856
State:
$33,645
(% of AGI for various income ranges: 92.2% for AGIs below $10k, 78.0% for AGIs $10k-25k, 81.2% for AGIs $25k-50k, 86.4% for AGIs $50k-75k, 83.1% for AGIs $75k-100k, 62.2% for AGIs over 100k)
Taxable interest for individuals: $801 (reported on 41.2% of returns)
This zip code:
$801
West Virginia:
$1,465
(% of AGI for various income ranges: 2.8% for AGIs below $10k, 1.3% for AGIs $10k-25k, 1.5% for AGIs $25k-50k, 0.5% for AGIs $50k-75k, 0.4% for AGIs $75k-100k, 0.5% for AGIs over 100k)
Taxable dividends: $1,206 (reported on 18.9% of returns)
Here:
$1,206
State:
$2,913
(% of AGI for various income ranges: 0.5% for AGIs below $10k, 1.0% for AGIs $10k-25k, 0.9% for AGIs $25k-50k, 0.6% for AGIs $50k-75k, 0.4% for AGIs $75k-100k, 0.2% for AGIs over 100k)
Net capital gain/loss: +$445 (reported on 14.5% of returns)
Here:
+$445
State:
+$6,331
(% of AGI for various income ranges: -0.5% for AGIs below $10k, -0.6% for AGIs $10k-25k, 0.3% for AGIs $25k-50k, -0.2% for AGIs $50k-75k, -0.2% for AGIs $75k-100k, 1.7% for AGIs over 100k)
Profit/loss from business: +$7,278 (reported on 11.0% of returns)
Here:
+$7,278
State:
+$11,074
(% of AGI for various income ranges: 6.1% for AGIs below $10k, 3.4% for AGIs $10k-25k, 2.0% for AGIs $25k-50k, 1.1% for AGIs $50k-75k, 5.6% for AGIs $75k-100k)
IRA payment deduction: $2,609 (reported on 2.8% of returns)
26060:
$2,609
West Virginia:
$2,796
Total itemized deductions: $14,881 (19% of AGI, reported on 14.4% of returns)
Here:
$14,881
State:
$16,976
Here:
18.8% of AGI
State:
19.0% of AGI
(% of AGI for various income ranges: 4.7% for AGIs $25k-50k, 5.7% for AGIs $50k-75k, 9.3% for AGIs $75k-100k, 11.1% for AGIs over 100k)
Charity contributions deductions: $1,844 (2% of AGI, reported on 11.7% of returns)
Here:
$1,844
State:
$3,529
Here:
2.3% of AGI
State:
3.7% of AGI
(% of AGI for various income ranges: 0.5% for AGIs $25k-50k, 0.5% for AGIs $50k-75k, 1.3% for AGIs $75k-100k, 0.8% for AGIs over 100k)
Total tax: $4,479 (reported on 76.0% of returns)
26060:
$4,479
State:
$5,372
(% of AGI for various income ranges: 2.8% for AGIs below $10k, 3.8% for AGIs $10k-25k, 6.6% for AGIs $25k-50k, 8.4% for AGIs $50k-75k, 11.3% for AGIs $75k-100k, 19.9% for AGIs over 100k)
Earned income credit: $1,606 (reported on 16.1% of returns)
Here:
$1,606
State:
$1,662
Percentage of individuals using paid preparers for their 2004 taxes: 55.5%
Here:
56%
State:
55%
(% for various income ranges: 45.6% for AGIs below $10k, 57.0% for AGIs $10k-25k, 57.9% for AGIs $25k-50k, 59.1% for AGIs $50k-75k, 52.9% for AGIs $75k-100k, 74.1% for AGIs over 100k)
Household received Food Stamps/SNAP in the past 12 months: 48 Household did not receive Food Stamps/SNAP in the past 12 months: 571
Women who had a birth in the past 12 months: 45 (15 now married, 28 unmarried) Women who did not have a birth in the past 12 months: 382 (182 now married, 199 unmarried)
Housing units in zip code 26060 with a mortgage: 234 (27 second mortgage, 27 both second mortgage and home equity loan) Houses without a mortgage: 1
Median monthly owner costs for units with a mortgage: $1,139 Median monthly owner costs for units without a mortgage: $441
Residents with income below the poverty level in 2022:
This zip code:
4.2%
Whole state:
17.9%
Residents with income below 50% of the poverty level in 2022:
This zip code:
1.6%
Whole state:
9.7%
Median number of rooms in houses and condos:
Here:
6.3
State:
6.5
Median number of rooms in apartments:
Here:
5.4
State:
4.7
Notable locations in this zip code not listed on our city pages
Streams, rivers, and creeks: Todd Run (A), Murray Run (B), McGraw Run (C), Hall Run (D), Garrison Run (E), Curtis Run (F), Coulter Run (G), Blayney Run (H), Battle Run (I). Display/hide their locations on the map
Parks in zip code 26060 include: Bear Rock Lakes Wildlife Management Area (1), Bear Rock Lakes State Recreation Area (2). Display/hide their locations on the map
Size of family households: 197 2-persons, 186 3-persons, 119 4-persons, 3 6-persons, 23 7-or-more-persons
Size of nonfamily households: 88 1-person, 7 2-persons
448 married couples with children.
105 single-parent households (103 men, 2 women).
96.7% of residents of 26060 zip code speak English at home.
0.4% of residents speak Spanish at home (100% very well).
1.4% of residents speak other Indo-European language at home (100% very well).
0.8% of residents speak Asian or Pacific Island language at home (60% very well, 40% well).
Foreign born population: 7 (0.4%) (100.0% of them are naturalized citizens)
This zip code:
0.4%
Whole state:
1.8%
46%English
14%European
11%German
9%American
8%Irish
5%Italian
4%Scotch-Irish
Year of entry for the foreign-born population
02010 or later
82000 to 2009
01990 to 1999
0Before 1990
Facilities with environmental interests located in this zip code:
AMSA 109 G (OLD ROUTE 40 MT ECHO in VALLEY GROVE, WV) . Federal Facility. U.S. ARMY
(Resource Conservation and Recovery Act (tracking hazardous waste)) Organizations: OPERNAME (CONTACT/OPERATOR)
, SUDER INCORPORATED (CONTACT/OWNER)
Alternative names: U S ARMY - A M S A 109 G
DALLAS PIKE DQ / SERV. STA. (I-70 EXIT 11 in VALLEY GROVE, WV)
National Pollutant Discharge Elimination System NON-MAJOR (Tracking pollutant discharge elimination systems) - permit Business SIC classification: OPERATORS OF NONRESIDENTIAL BUILDINGS Organizations: WINDMILL TRUCKERS CENTER INC (CONTACT/OWNER)
Alternative names: WINDMILL TRUCKERS CENTER
DSI (DALLAS PIKE EX 11 OLD W ALEXAN in VALLEY GROVE, WV)
(Resource Conservation and Recovery Act (tracking hazardous waste)) Organizations: WINDMILL TRUCKERS CENTER (CONTACT/OWNER)
CLEAN HARBORS ENVIRONMENTAL SERV INC (ON WINDMILL LA 1/4 MI N in VALLEY GROVE, WV)
Conditionally Exempt Small Quantity Generators, less than 100 kg/month of hazardous waste (Resource Conservation and Recovery Act (tracking hazardous waste)) TRANSPORTER (Resource Conservation and Recovery Act (tracking hazardous waste)) Alternative names: SAFETY KLEEN (TS) INC.
Housing units lacking complete plumbing facilities: 9.1% Housing units lacking complete kitchen facilities: 7.1%
44.2%Utility gas
23.1%Wood
18.0%Electricity
6.4%Fuel oil, kerosene, etc.
5.4%Other fuel
3.3%Bottled, tank, or LP gas
Population in 1990: 1,705. Population change in the 1990s: +85 (+5.0%).
Place of birth for U.S.-born residents:
This state: 1,283
Northeast: 230
Midwest: 72
South: 349
West: 24
73% of the 26060 zip code residents lived in the same house 5 years ago. Out of people who lived in different houses, 68% lived in this county. Out of people who lived in different counties, 50% lived in West Virginia.
100% of the 26060 zip code residents lived in the same house 1 year ago.
Private vs. public school enrollment:
Students in private schools in grades 1 to 8 (elementary and middle school): 76
Here:
29.9%
West Virginia:
12.2%
Students in private schools in grades 9 to 12 (high school): 2
Here:
1.3%
West Virginia:
8.8%
Students in private undergraduate colleges:
Here:
0.0%
West Virginia:
17.3%
Occupation by median earnings in the past 12 months ($)
143,735Construction and extraction occupations
102,070Transportation occupations
76,544Health diagnosing and treating practitioners and other technical occupations
70,638Law enforcement workers including supervisors
65,796Management occupations
58,601Food preparation and serving related occupations
Companies with federal contracts located in this zip code:
WEST POINT PRODUCTS, INC. (SCHOOL HOUSE LN in VALLEY GROVE, WV; small business) 140 employees, $12700000 revenue: $185,645 in 37 contractsfrom 2003 to 2006
Contracts for , Office Supplies, Printing, Duplicating, and Bookbinding Equipment, ADP Supplies, and moreby Office of Personnel Management, Army, Federal Supply Service, U.S. Fish and Wildlife Service, and others Signed by year:2000: $0; 2001: $0; 2002: $0; 2003: $3,388; 2004: $50,699; 2005: $50,060; 2006: $81,498.
Biggest contracts:
$20,475 with Office of Personnel Management for . Signed on 2006-09-29. Completion date: 2006-10-02.
$18,200 with Office of Personnel Management for Office Supplies. Signed on 2006-06-23. Completion date: 2006-07-14.
$14,477 with Army for Printing, Duplicating, and Bookbinding Equipment. Taking place in MD. Signed on 2004-07-14. Completion date: 2004-07-29.
$14,477, same as above.Signed on 2004-06-25. Completion date: 2004-07-10.
Top industries in this zip code by the number of employees in 2005:
Administrative and Support and Waste Management and Remediation Services: Hazardous Waste Collection (10-19 employees: 1 establishment)
Administrative and Support and Waste Management and Remediation Services: Janitorial Services (5-9: 1)
Other Services (except Public Administration): Commercial and Industrial Machinery and Equipment (except Automotive and Electronic) Repair and Maintenance (5-9: 1)
Accommodation and Food Services: Limited-Service Restaurants (5-9: 1)
Accommodation and Food Services: Drinking Places (Alcoholic Beverages) (5-9: 1)
Fatal accident statistics in 2012:
Fatal accident count: 1
Vehicles involved in fatal accidents: 2
Fatal accidents caused by drunken drivers: 0
Fatalities: 2
Persons involved in fatal accidents: 3
Pedestrians involved in fatal accidents: 0
Home Mortgage Disclosure Act Aggregated Statistics For Year 2009 (Based on 4 partial tracts)
A) FHA, FSA/RHS & VA Home Purchase Loans
B) Conventional Home Purchase Loans
C) Refinancings
D) Home Improvement Loans
E) Loans on Dwellings For 5+ Families
F) Non-occupant Loans on < 5 Family Dwellings (A B C & D)
G) Loans On Manufactured Home Dwelling (A B C & D)
Number
Average Value
Number
Average Value
Number
Average Value
Number
Average Value
Number
Average Value
Number
Average Value
Number
Average Value
LOANS ORIGINATED
7
$94,966
9
$150,369
51
$134,940
13
$73,570
1
$96,440
7
$40,803
3
$85,940
APPLICATIONS APPROVED, NOT ACCEPTED
0
$0
1
$97,450
3
$144,210
3
$67,170
0
$0
0
$0
0
$0
APPLICATIONS DENIED
1
$110,270
4
$138,612
26
$140,189
6
$12,687
0
$0
1
$19,660
4
$101,492
APPLICATIONS WITHDRAWN
1
$95,740
3
$265,853
9
$144,898
0
$0
1
$23,080
1
$44,450
0
$0
FILES CLOSED FOR INCOMPLETENESS
0
$0
0
$0
3
$41,030
0
$0
0
$0
0
$0
0
$0
Aggregated Statistics For Year 2008 (Based on 4 partial tracts)
A) FHA, FSA/RHS & VA Home Purchase Loans
B) Conventional Home Purchase Loans
C) Refinancings
D) Home Improvement Loans
F) Non-occupant Loans on < 5 Family Dwellings (A B C & D)
G) Loans On Manufactured Home Dwelling (A B C & D)
Number
Average Value
Number
Average Value
Number
Average Value
Number
Average Value
Number
Average Value
Number
Average Value
LOANS ORIGINATED
3
$84,627
21
$125,095
47
$110,281
17
$31,896
8
$92,881
8
$42,458
APPLICATIONS APPROVED, NOT ACCEPTED
1
$46,160
3
$123,447
3
$44,190
1
$25,640
0
$0
1
$33,540
APPLICATIONS DENIED
0
$0
7
$60,647
24
$145,913
14
$59,717
0
$0
3
$41,627
APPLICATIONS WITHDRAWN
0
$0
2
$47,440
12
$121,705
3
$86,203
1
$61,550
0
$0
FILES CLOSED FOR INCOMPLETENESS
2
$59,720
2
$82,060
3
$83,947
0
$0
0
$0
0
$0
Aggregated Statistics For Year 2007 (Based on 4 partial tracts)
A) FHA, FSA/RHS & VA Home Purchase Loans
B) Conventional Home Purchase Loans
C) Refinancings
D) Home Improvement Loans
E) Loans on Dwellings For 5+ Families
F) Non-occupant Loans on < 5 Family Dwellings (A B C & D)
G) Loans On Manufactured Home Dwelling (A B C & D)
Number
Average Value
Number
Average Value
Number
Average Value
Number
Average Value
Number
Average Value
Number
Average Value
Number
Average Value
LOANS ORIGINATED
1
$53,850
38
$124,311
37
$96,870
15
$99,042
2
$288,060
5
$74,418
8
$45,585
APPLICATIONS APPROVED, NOT ACCEPTED
0
$0
4
$62,948
9
$111,617
1
$42,740
0
$0
0
$0
1
$41,030
APPLICATIONS DENIED
1
$53,000
8
$80,014
28
$108,254
10
$29,106
0
$0
2
$90,180
7
$70,473
APPLICATIONS WITHDRAWN
0
$0
2
$131,185
7
$189,617
2
$23,305
0
$0
1
$25,640
0
$0
FILES CLOSED FOR INCOMPLETENESS
0
$0
0
$0
3
$58,980
1
$196,600
0
$0
0
$0
0
$0
Aggregated Statistics For Year 2006 (Based on 4 partial tracts)
A) FHA, FSA/RHS & VA Home Purchase Loans
B) Conventional Home Purchase Loans
C) Refinancings
D) Home Improvement Loans
F) Non-occupant Loans on < 5 Family Dwellings (A B C & D)
G) Loans On Manufactured Home Dwelling (A B C & D)
Number
Average Value
Number
Average Value
Number
Average Value
Number
Average Value
Number
Average Value
Number
Average Value
LOANS ORIGINATED
2
$97,695
31
$99,154
35
$103,181
13
$28,715
9
$101,813
5
$57,976
APPLICATIONS APPROVED, NOT ACCEPTED
0
$0
2
$55,035
3
$173,050
2
$158,995
0
$0
1
$54,510
APPLICATIONS DENIED
2
$65,830
5
$62,914
26
$87,228
13
$16,373
3
$97,733
6
$49,758
APPLICATIONS WITHDRAWN
1
$51,290
6
$85,183
7
$106,707
2
$125,790
3
$72,373
1
$71,280
FILES CLOSED FOR INCOMPLETENESS
0
$0
1
$49,580
3
$113,057
1
$42,740
0
$0
0
$0
Aggregated Statistics For Year 2005 (Based on 4 partial tracts)
A) FHA, FSA/RHS & VA Home Purchase Loans
B) Conventional Home Purchase Loans
C) Refinancings
D) Home Improvement Loans
E) Loans on Dwellings For 5+ Families
F) Non-occupant Loans on < 5 Family Dwellings (A B C & D)
G) Loans On Manufactured Home Dwelling (A B C & D)
Number
Average Value
Number
Average Value
Number
Average Value
Number
Average Value
Number
Average Value
Number
Average Value
Number
Average Value
LOANS ORIGINATED
4
$91,960
24
$122,480
41
$90,370
30
$47,860
2
$250,455
7
$88,173
3
$31,663
APPLICATIONS APPROVED, NOT ACCEPTED
1
$22,640
5
$73,868
9
$85,606
3
$47,273
0
$0
1
$4,190
4
$47,862
APPLICATIONS DENIED
0
$0
13
$89,564
22
$85,274
12
$37,753
0
$0
0
$0
8
$50,362
APPLICATIONS WITHDRAWN
0
$0
3
$73,623
8
$84,690
5
$97,570
0
$0
0
$0
3
$38,577
FILES CLOSED FOR INCOMPLETENESS
0
$0
0
$0
2
$56,695
0
$0
0
$0
0
$0
0
$0
Aggregated Statistics For Year 2004 (Based on 4 partial tracts)
B) Conventional Home Purchase Loans
C) Refinancings
D) Home Improvement Loans
E) Loans on Dwellings For 5+ Families
F) Non-occupant Loans on < 5 Family Dwellings (A B C & D)
G) Loans On Manufactured Home Dwelling (A B C & D)
Number
Average Value
Number
Average Value
Number
Average Value
Number
Average Value
Number
Average Value
Number
Average Value
LOANS ORIGINATED
31
$128,051
41
$86,808
17
$29,963
1
$58,980
7
$185,456
4
$62,142
APPLICATIONS APPROVED, NOT ACCEPTED
2
$88,890
9
$71,082
0
$0
0
$0
0
$0
3
$44,350
APPLICATIONS DENIED
8
$84,128
27
$86,705
5
$19,708
0
$0
2
$42,740
3
$32,483
APPLICATIONS WITHDRAWN
3
$93,153
7
$87,104
2
$42,740
0
$0
0
$0
1
$51,290
FILES CLOSED FOR INCOMPLETENESS
0
$0
0
$0
1
$25,160
0
$0
0
$0
0
$0
Aggregated Statistics For Year 2003 (Based on 4 partial tracts)
A) FHA, FSA/RHS & VA Home Purchase Loans
B) Conventional Home Purchase Loans
C) Refinancings
D) Home Improvement Loans
F) Non-occupant Loans on < 5 Family Dwellings (A B C & D)
Number
Average Value
Number
Average Value
Number
Average Value
Number
Average Value
Number
Average Value
LOANS ORIGINATED
0
$0
37
$96,108
99
$93,058
18
$24,419
9
$55,987
APPLICATIONS APPROVED, NOT ACCEPTED
0
$0
7
$108,920
14
$78,466
0
$0
1
$63,730
APPLICATIONS DENIED
2
$56,605
6
$77,213
30
$90,113
3
$14,030
3
$25,930
APPLICATIONS WITHDRAWN
0
$0
3
$138,900
8
$88,451
3
$13,460
0
$0
FILES CLOSED FOR INCOMPLETENESS
2
$42,850
0
$0
3
$70,333
0
$0
0
$0
Aggregated Statistics For Year 2002 (Based on 4 partial tracts)
A) FHA, FSA/RHS & VA Home Purchase Loans
B) Conventional Home Purchase Loans
C) Refinancings
D) Home Improvement Loans
F) Non-occupant Loans on < 5 Family Dwellings (A B C & D)
Number
Average Value
Number
Average Value
Number
Average Value
Number
Average Value
Number
Average Value
LOANS ORIGINATED
2
$58,125
20
$71,880
71
$81,940
14
$21,299
4
$50,838
APPLICATIONS APPROVED, NOT ACCEPTED
0
$0
3
$83,080
5
$50,656
0
$0
0
$0
APPLICATIONS DENIED
0
$0
6
$50,585
21
$78,646
10
$11,418
2
$20,015
APPLICATIONS WITHDRAWN
0
$0
1
$104,830
8
$72,449
2
$2,095
0
$0
FILES CLOSED FOR INCOMPLETENESS
0
$0
0
$0
4
$104,620
1
$12,580
1
$12,580
Aggregated Statistics For Year 2001 (Based on 4 partial tracts)
A) FHA, FSA/RHS & VA Home Purchase Loans
B) Conventional Home Purchase Loans
C) Refinancings
D) Home Improvement Loans
F) Non-occupant Loans on < 5 Family Dwellings (A B C & D)
Number
Average Value
Number
Average Value
Number
Average Value
Number
Average Value
Number
Average Value
LOANS ORIGINATED
2
$24,250
37
$75,725
64
$78,588
14
$18,361
8
$66,334
APPLICATIONS APPROVED, NOT ACCEPTED
0
$0
4
$58,282
7
$40,673
2
$18,990
0
$0
APPLICATIONS DENIED
0
$0
9
$75,618
19
$67,432
4
$17,738
3
$28,190
APPLICATIONS WITHDRAWN
0
$0
3
$110,167
5
$55,528
2
$11,445
1
$67,090
FILES CLOSED FOR INCOMPLETENESS
0
$0
0
$0
3
$70,887
0
$0
0
$0
Aggregated Statistics For Year 2000 (Based on 4 partial tracts)
A) FHA, FSA/RHS & VA Home Purchase Loans
B) Conventional Home Purchase Loans
C) Refinancings
D) Home Improvement Loans
F) Non-occupant Loans on < 5 Family Dwellings (A B C & D)
Number
Average Value
Number
Average Value
Number
Average Value
Number
Average Value
Number
Average Value
LOANS ORIGINATED
2
$24,505
34
$68,518
21
$70,583
21
$10,262
8
$44,318
APPLICATIONS APPROVED, NOT ACCEPTED
0
$0
9
$45,668
4
$84,412
3
$12,063
0
$0
APPLICATIONS DENIED
0
$0
18
$42,538
20
$48,418
11
$6,577
1
$13,680
APPLICATIONS WITHDRAWN
0
$0
3
$42,520
4
$51,288
2
$7,695
1
$44,450
FILES CLOSED FOR INCOMPLETENESS
1
$53,850
0
$0
0
$0
0
$0
0
$0
Aggregated Statistics For Year 1999 (Based on 2 partial tracts)
A) FHA, FSA/RHS & VA Home Purchase Loans
B) Conventional Home Purchase Loans
C) Refinancings
D) Home Improvement Loans
F) Non-occupant Loans on < 5 Family Dwellings (A B C & D)
Detailed PMIC statistics for the following Tracts:0021.00
, 0022.00
2003 - 2018 National Fire Incident Reporting System (NFIRS) incidents
According to the data from the years 2003 - 2018 the average number of fire incidents per year is 24. The highest number of reported fires - 57 took place in 2010, and the least - 4 in 2016. The data has a growing trend.
When looking into fire subcategories, the most incidents belonged to: Mobile Property/Vehicle Fires (34.5%), and Structure Fires (32.1%).
Fire incident types reported to NFIRS in Zip Code 26060


 Nearest zip codes: 26074, 26059, 15376, 26032, 26003, 26036.


 . Federal Facility. U.S. ARMY


 According to the data from the years 2003 - 2018 the average number of fire incidents per year is 24. The highest number of reported fires - 57 took place in 2010, and the least - 4 in 2016. The data has a growing trend.
 When looking into fire subcategories, the most incidents belonged to: Mobile Property/Vehicle Fires (34.5%), and Structure Fires (32.1%).