Estimated zip code population in 2022: 7,252 Zip code population in 2010: 6,071 Zip code population in 2000: 5,468
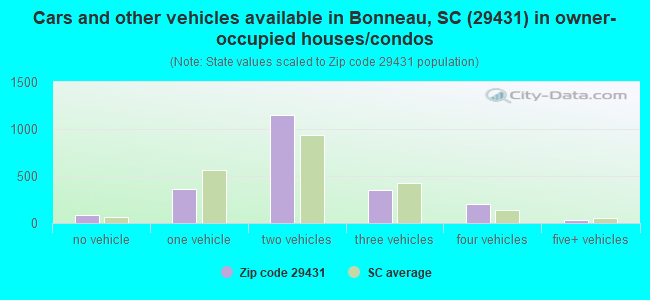
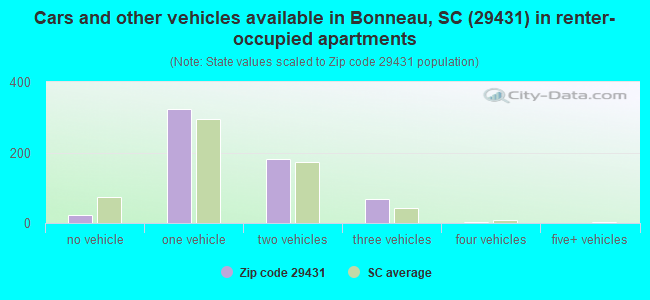
Houses and condos: 3,033 Renter-occupied apartments: 594
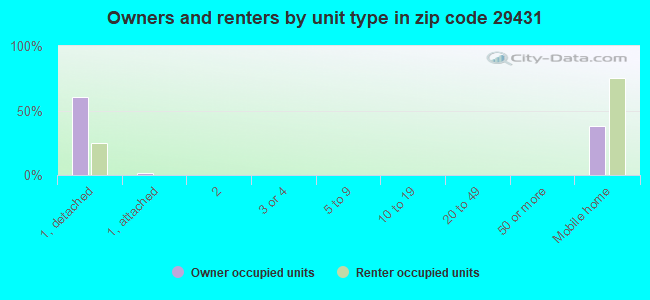
% of renters here:
21%
State:
28%
March 2022 cost of living index in zip code 29431: 81.8 (low, U.S. average is 100)
Land area: 78.7 sq. mi. Water area: 10.3 sq. mi.
Population density: 92 people per square mile
(very low).
OSM Map
General Map
Google Map
MSN Map
OSM Map
General Map
Google Map
MSN Map
OSM Map
General Map
Google Map
MSN Map
OSM Map
General Map
Google Map
MSN Map
Please wait while loading the map...
Real estate property taxes paid for housing units in 2022:
This zip code:
0.4% ($934)
South Carolina:
0.5% ($1,185)
Median real estate property taxes paid for housing units with mortgages in 2022: $1,063 (0.4%) Median real estate property taxes paid for housing units with no mortgage in 2022: $819 (0.4%)
Business Search- 14 Million verified businesses
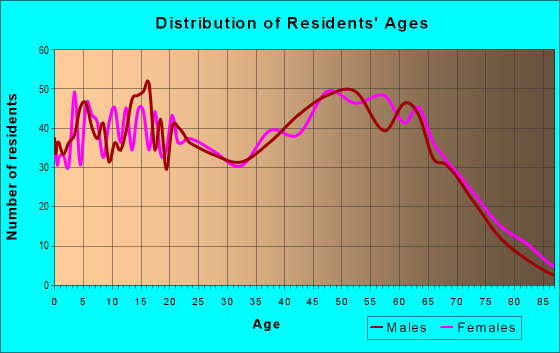
Males: 3,572
(49.3%)
Females: 3,679
(50.7%)
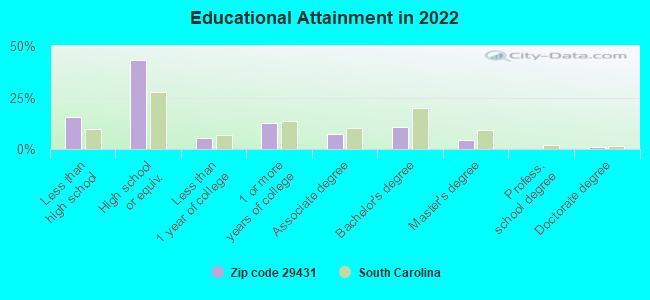
For population 25 years and over in 29431:
High school or higher: 80.7%
Bachelor's degree or higher: 15.4%
Graduate or professional degree: 5.2%
Unemployed: 3.9%
Mean travel time to work (commute): 37.2 minutes
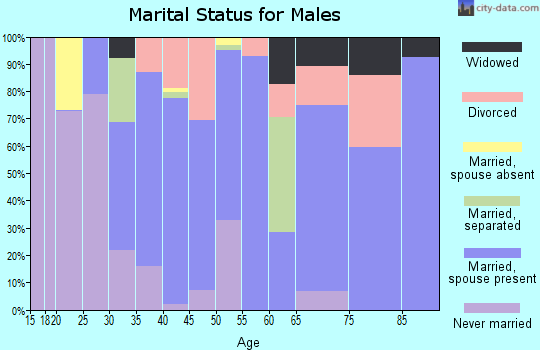
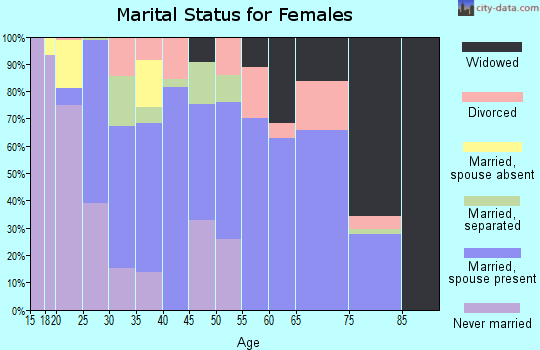
For population 15 years and over in 29431:
Never married: 26.6%
Now married: 53.6%
Separated: 3.9%
Widowed: 8.8%
Divorced: 7.1%
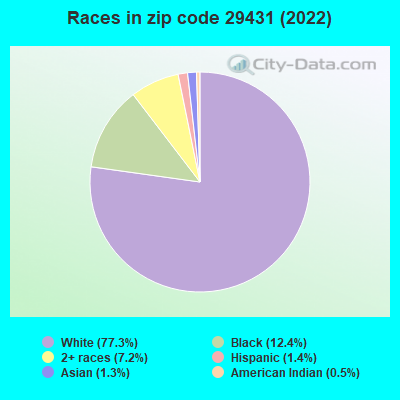
Zip code 29431 compared to state average:
Black race population percentage below state average.
Hispanic race population percentage significantly below state average.
Foreign-born population percentage significantly below state average.
Length of stay since moving in significantly above state average.
Number of college students below state average.
Percentage of population with a bachelor's degree or higher below state average.
Averages for the 2020 tax year for zip code 29431, filed in 2021:
Average Adjusted Gross Income (AGI) in 2020: $52,391 (Individual Income Tax Returns)
Here:
$52,391
State:
$65,754
Salary/wage: $47,896 (reported on 79.2% of returns)
Here:
$47,896
State:
$52,566
(% of AGI for various income ranges: 1129.0% for AGIs below $25k, 3706.9% for AGIs $25k-50k, 6611.7% for AGIs $50k-75k, 10318.8% for AGIs $75k-100k, 18450.0% for AGIs $100k-200k)
Taxable interest for individuals: $1,012 (reported on 18.0% of returns)
This zip code:
$1,012
South Carolina:
$1,749
(% of AGI for various income ranges: 11.9% for AGIs below $25k, 16.9% for AGIs $25k-50k, 14.7% for AGIs $50k-75k, 28.2% for AGIs $75k-100k, 69.5% for AGIs $100k-200k)
Ordinary dividends: $3,017 (reported on 8.1% of returns)
Here:
$3,017
State:
$8,783
(% of AGI for various income ranges: 8.6% for AGIs below $25k, 9.1% for AGIs $25k-50k, 16.3% for AGIs $50k-75k, 65.3% for AGIs $75k-100k, 104.2% for AGIs $100k-200k)
Net capital gain/loss in AGI: +$14,235 (reported on 8.1% of returns)
Here:
+$14,235
State:
+$24,194
(% of AGI for various income ranges: 1.4% for AGIs below $25k, 16.9% for AGIs $25k-50k, 20.0% for AGIs $50k-75k, 27.6% for AGIs $75k-100k, 609.5% for AGIs $100k-200k)
Profit/loss from business: +$6,939 (reported on 15.5% of returns)
Here:
+$6,939
State:
+$11,253
(% of AGI for various income ranges: 142.6% for AGIs below $25k, 158.4% for AGIs $25k-50k, 77.0% for AGIs $50k-75k, 208.8% for AGIs $75k-100k, 266.8% for AGIs $100k-200k)
Taxable individual retirement arrangement distribution: $16,411 (reported on 6.3% of returns)
29431:
$16,411
South Carolina:
$21,604
(% of AGI for various income ranges: 26.2% for AGIs below $25k, 90.0% for AGIs $25k-50k, 154.3% for AGIs $50k-75k, 342.4% for AGIs $75k-100k, 629.5% for AGIs $100k-200k)
Total itemized deductions: $30,062 (reported on 4.6% of returns)
Here:
$30,062
State:
$35,199
(% of AGI for various income ranges: 460.3% for AGIs $50k-75k, 1330.0% for AGIs $100k-200k)
Charity contributions: $10,291 (reported on 3.9% of returns)
Here:
$10,291
State:
$14,319
(% of AGI for various income ranges: 109.3% for AGIs $50k-75k, 423.2% for AGIs $100k-200k)
Taxes paid: $7,300 (reported on 4.6% of returns)
29431:
$7,300
State:
$7,486
(% of AGI for various income ranges: 81.3% for AGIs $50k-75k, 371.1% for AGIs $100k-200k)
Earned income credit: $2,468 (reported on 20.1% of returns)
Here:
$2,468
State:
$2,397
(% of AGI for various income ranges: 126.8% for AGIs below $25k, 82.9% for AGIs $25k-50k)
Percentage of individuals using paid preparers for their 2020 taxes: 91.5%
Here:
92%
State:
93%
(% for various income ranges: 90.8% for AGIs below $25k, 93.4% for AGIs $25k-50k, 90.7% for AGIs $50k-75k, 89.3% for AGIs $75k-100k, 91.4% for AGIs $100k-200k, 100.0% for AGIs over 200k)
Averages for the 2012 tax year for zip code 29431, filed in 2013:
Average Adjusted Gross Income (AGI) in 2012: $41,992 (Individual Income Tax Returns)
Here:
$41,992
State:
$51,133
Salary/wage: $38,461 (reported on 81.1% of returns)
Here:
$38,461
State:
$42,173
(% of AGI for various income ranges: 69.1% for AGIs below $25k, 77.8% for AGIs $25k-50k, 76.6% for AGIs $50k-75k, 74.4% for AGIs $75k-100k, 71.2% for AGIs $100k-200k)
Taxable interest for individuals: $768 (reported on 19.7% of returns)
This zip code:
$768
South Carolina:
$1,468
(% of AGI for various income ranges: 0.4% for AGIs below $25k, 0.3% for AGIs $25k-50k, 0.5% for AGIs $50k-75k, 0.5% for AGIs $75k-100k, 0.2% for AGIs $100k-200k)
Ordinary dividends: $1,796 (reported on 9.1% of returns)
Here:
$1,796
State:
$6,511
(% of AGI for various income ranges: 0.4% for AGIs below $25k, 0.4% for AGIs $25k-50k, 0.4% for AGIs $75k-100k, 0.7% for AGIs $100k-200k)
Net capital gain/loss in AGI: +$2,784 (reported on 7.5% of returns)
Here:
+$2,784
State:
+$13,061
(% of AGI for various income ranges: 0.1% for AGIs below $25k, 0.2% for AGIs $50k-75k, 1.8% for AGIs $100k-200k)
Profit/loss from business: +$5,444 (reported on 16.9% of returns)
Here:
+$5,444
State:
+$10,167
(% of AGI for various income ranges: 12.1% for AGIs below $25k, 1.6% for AGIs $25k-50k, 0.5% for AGIs $50k-75k, 0.9% for AGIs $75k-100k, 2.4% for AGIs $100k-200k)
Taxable individual retirement arrangement distribution: $12,644 (reported on 7.1% of returns)
29431:
$12,644
South Carolina:
$17,019
(% of AGI for various income ranges: 2.0% for AGIs below $25k, 1.6% for AGIs $25k-50k, 2.1% for AGIs $50k-75k, 2.4% for AGIs $75k-100k, 2.6% for AGIs $100k-200k)
Total itemized deductions: $19,038 (25% of AGI, reported on 24.8% of returns)
Here:
$19,038
State:
$22,890
Here:
24.6% of AGI
State:
21.4% of AGI
(% of AGI for various income ranges: 4.7% for AGIs below $25k, 8.4% for AGIs $25k-50k, 11.5% for AGIs $50k-75k, 13.6% for AGIs $75k-100k, 15.5% for AGIs $100k-200k)
Charity contributions: $4,200 (reported on 20.1% of returns)
Here:
$4,200
State:
$5,169
(% of AGI for various income ranges: 0.5% for AGIs below $25k, 1.3% for AGIs $25k-50k, 1.9% for AGIs $50k-75k, 2.6% for AGIs $75k-100k, 3.2% for AGIs $100k-200k)
Taxes paid: $5,385 (reported on 24.4% of returns)
29431:
$5,385
State:
$7,644
(% of AGI for various income ranges: 0.7% for AGIs below $25k, 1.4% for AGIs $25k-50k, 2.7% for AGIs $50k-75k, 4.2% for AGIs $75k-100k, 5.8% for AGIs $100k-200k)
Earned income credit: $2,528 (reported on 25.6% of returns)
Here:
$2,528
State:
$2,418
(% of AGI for various income ranges: 9.8% for AGIs below $25k, 1.3% for AGIs $25k-50k)
Percentage of individuals using paid preparers for their 2012 taxes: 65.0%
Here:
65%
State:
57%
(% for various income ranges: 61.3% for AGIs below $25k, 65.7% for AGIs $25k-50k, 68.3% for AGIs $50k-75k, 72.7% for AGIs $75k-100k, 66.7% for AGIs $100k-200k)
Averages for the 2004 tax year for zip code 29431, filed in 2005:
Average Adjusted Gross Income (AGI) in 2004: $35,691 (Individual Income Tax Returns)
Here:
$35,691
State:
$41,965
Salary/wage: $33,392 (reported on 84.4% of returns)
Here:
$33,392
State:
$35,695
(% of AGI for various income ranges: 92.4% for AGIs below $10k, 75.0% for AGIs $10k-25k, 82.1% for AGIs $25k-50k, 83.0% for AGIs $50k-75k, 81.6% for AGIs $75k-100k, 63.3% for AGIs over 100k)
Taxable interest for individuals: $771 (reported on 30.9% of returns)
This zip code:
$771
South Carolina:
$1,623
(% of AGI for various income ranges: 2.1% for AGIs below $10k, 0.9% for AGIs $10k-25k, 0.6% for AGIs $25k-50k, 0.6% for AGIs $50k-75k, 0.4% for AGIs $75k-100k, 0.8% for AGIs over 100k)
Taxable dividends: $890 (reported on 9.7% of returns)
Here:
$890
State:
$3,999
(% of AGI for various income ranges: 0.7% for AGIs below $10k, 0.5% for AGIs $10k-25k, 0.2% for AGIs $25k-50k, 0.1% for AGIs $50k-75k, 0.3% for AGIs $75k-100k, 0.4% for AGIs over 100k)
Net capital gain/loss: +$2,719 (reported on 7.9% of returns)
Here:
+$2,719
State:
+$13,100
(% of AGI for various income ranges: -0.7% for AGIs below $10k, 0.2% for AGIs $10k-25k, 0.7% for AGIs $25k-50k, 0.0% for AGIs $50k-75k, 0.9% for AGIs $75k-100k, 1.9% for AGIs over 100k)
Profit/loss from business: +$3,674 (reported on 15.5% of returns)
Here:
+$3,674
State:
+$9,144
(% of AGI for various income ranges: 10.2% for AGIs below $10k, 5.3% for AGIs $10k-25k, 1.4% for AGIs $25k-50k, 0.2% for AGIs $50k-75k, 0.9% for AGIs $75k-100k, 0.6% for AGIs over 100k)
IRA payment deduction: $2,545 (reported on 0.9% of returns)
29431:
$2,545
South Carolina:
$2,972
Total itemized deductions: $15,381 (24% of AGI, reported on 28.7% of returns)
Here:
$15,381
State:
$19,039
Here:
24.2% of AGI
State:
22.8% of AGI
(% of AGI for various income ranges: 10.9% for AGIs below $10k, 6.4% for AGIs $10k-25k, 11.3% for AGIs $25k-50k, 14.9% for AGIs $50k-75k, 14.9% for AGIs $75k-100k, 12.9% for AGIs over 100k)
Charity contributions deductions: $3,241 (5% of AGI, reported on 25.0% of returns)
Here:
$3,241
State:
$4,305
Here:
4.9% of AGI
State:
5.0% of AGI
(% of AGI for various income ranges: 0.6% for AGIs below $10k, 0.8% for AGIs $10k-25k, 1.8% for AGIs $25k-50k, 3.0% for AGIs $50k-75k, 2.9% for AGIs $75k-100k, 2.9% for AGIs over 100k)
Total tax: $4,063 (reported on 73.1% of returns)
29431:
$4,063
State:
$6,497
(% of AGI for various income ranges: 2.8% for AGIs below $10k, 3.8% for AGIs $10k-25k, 5.9% for AGIs $25k-50k, 7.9% for AGIs $50k-75k, 10.4% for AGIs $75k-100k, 17.4% for AGIs over 100k)
Earned income credit: $1,898 (reported on 21.7% of returns)
Here:
$1,898
State:
$1,882
Percentage of individuals using paid preparers for their 2004 taxes: 75.2%
Here:
75%
State:
66%
(% for various income ranges: 70.6% for AGIs below $10k, 75.8% for AGIs $10k-25k, 76.0% for AGIs $25k-50k, 76.7% for AGIs $50k-75k, 80.4% for AGIs $75k-100k, 73.1% for AGIs over 100k)
Household received Food Stamps/SNAP in the past 12 months: 398 Household did not receive Food Stamps/SNAP in the past 12 months: 2,375
Women who had a birth in the past 12 months: 36 (33 now married, 4 unmarried) Women who did not have a birth in the past 12 months: 1,466 (752 now married, 719 unmarried)
Housing units in zip code 29431 with a mortgage: 892 (50 second mortgage, 43 both second mortgage and home equity loan) Houses without a mortgage: 16
Median monthly owner costs for units with a mortgage: $1,217 Median monthly owner costs for units without a mortgage: $413
Residents with income below the poverty level in 2022:
This zip code:
12.9%
Whole state:
14.0%
Residents with income below 50% of the poverty level in 2022:
This zip code:
7.9%
Whole state:
7.3%
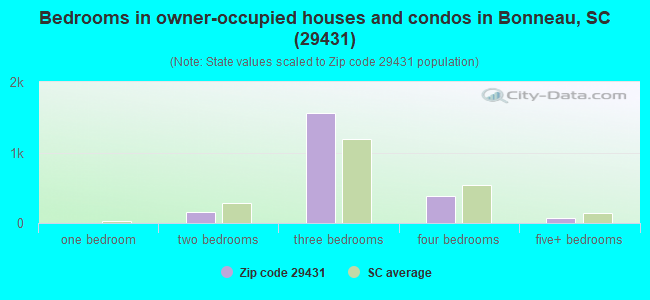
Median number of rooms in houses and condos:
Here:
6.6
State:
6.4
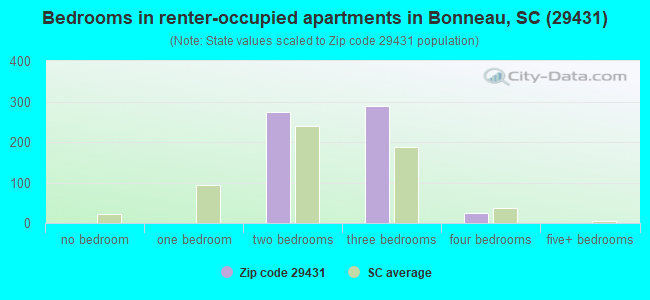
Median number of rooms in apartments:
Here:
5.4
State:
4.5
Notable locations in this zip code not listed on our city pages
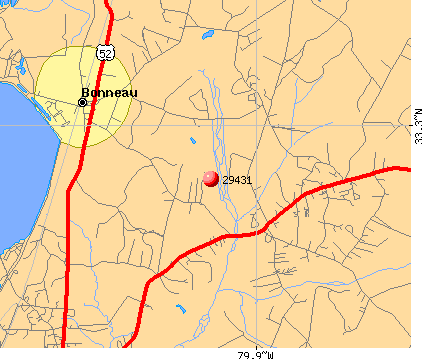
Notable locations in zip code 29431: Canal Picnic Area (A), Spring Grove Plantation (B), Bonneau Rural Volunteer Fire Department (C), Lake Moultrie Rural Volunteer Fire Department (D), Macedonia Rural Fire Department Station 1 (E), South Carolina Law Enforcement Division (F), Bonneau Police Department (G). Display/hide their locations on the map
Churches in zip code 29431 include: Oak Grove Church (A), Church of God (B), Full Gospel Mission Church (C), Hickory Grove Pentecostal Holiness Church (D), Hoods Chapel Methodist Church (E), Hopes Chapel (F), Good Shepherd Church (G), Holy Rock Church (H), Jehovah Church (I). Display/hide their locations on the map
Cemeteries: Black Oak Cemetery (1), Bonneau Cemetery (2), Full Gospel Mission Cemetery (3), Mudlake Cemetery (4), Oak Grove Cemetery (5), Rehobeth Cemetery (6), Hickory Grove Cemetery (7). Display/hide their locations on the map
Swamps: Wallace Swamp (A), Little Ocean Bay (B), Graveyard Bay (C), Boggy Swamp (D), Big Ocean Bay (E), Whitten Bay (F), Walleye Bay (G), Spring Grove Swamp (H). Display/hide their locations on the map
Size of family households: 990 2-persons, 287 3-persons, 405 4-persons, 156 5-persons, 83 6-persons, 24 7-or-more-persons
Size of nonfamily households: 784 1-person, 21 2-persons, 19 4-persons
1,070 married couples with children.
526 single-parent households (150 men, 376 women).
98.9% of residents of 29431 zip code speak English at home.
0.7% of residents speak Spanish at home (66% very well, 34% not well).
0.3% of residents speak Asian or Pacific Island language at home (13% very well, 87% well).
0.1% of residents speak other language at home (100% very well).
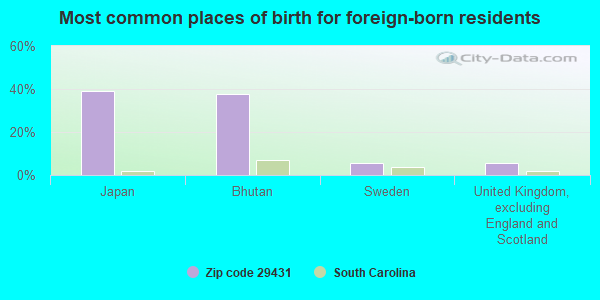
Foreign born population: 78 (1.1%) (94.0% of them are naturalized citizens)
This zip code:
1.1%
Whole state:
5.2%
39%Japan
38%Bhutan
6%Sweden
6%United Kingdom, excluding England and Scotland
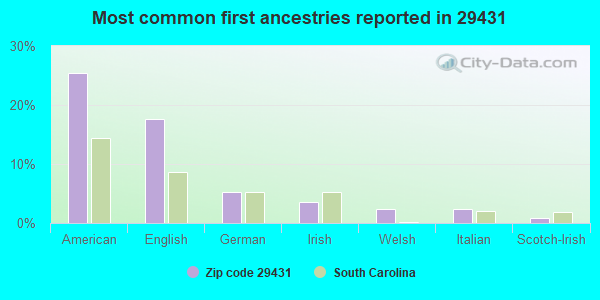
25%American
18%English
5%German
4%Irish
2%Welsh
2%Italian
1%Scotch-Irish
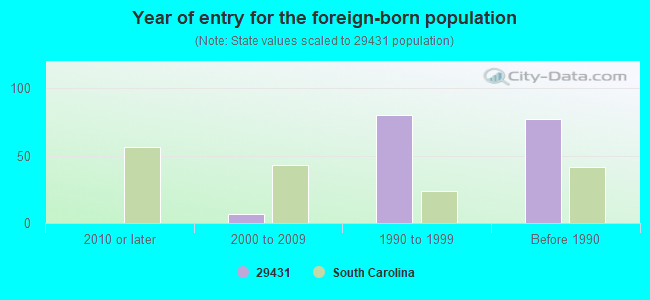
Year of entry for the foreign-born population
02010 or later
72000 to 2009
801990 to 1999
77Before 1990
Housing units lacking complete plumbing facilities: 1.8% Housing units lacking complete kitchen facilities: 2.5%
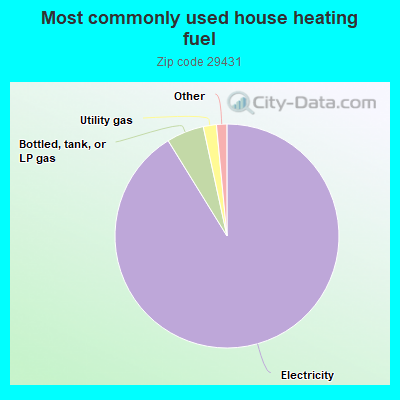
91.3%Electricity
5.4%Bottled, tank, or LP gas
1.9%Utility gas
0.8%No fuel used
0.6%Wood
Population in 1990: 7,431.
Place of birth for U.S.-born residents:
This state: 4,907
Northeast: 630
Midwest: 382
South: 674
West: 437
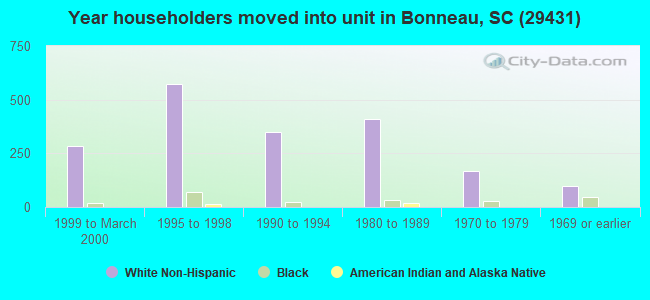
64% of the 29431 zip code residents lived in the same house 5 years ago. Out of people who lived in different houses, 70% lived in this county. Out of people who lived in different counties, 50% lived in South Carolina.
93% of the 29431 zip code residents lived in the same house 1 year ago. Out of people who lived in different houses, 46% moved from this county. Out of people who lived in different houses, 22% moved from different county within same state. Out of people who lived in different houses, 30% moved from different state.
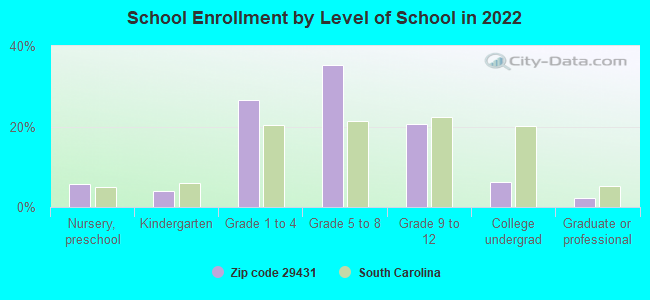
Private vs. public school enrollment:
Students in private schools in grades 1 to 8 (elementary and middle school): 133
Here:
12.3%
South Carolina:
14.4%
Students in private schools in grades 9 to 12 (high school): 21
Here:
6.0%
South Carolina:
11.1%
Students in private undergraduate colleges: 59
Here:
51.7%
South Carolina:
21.9%
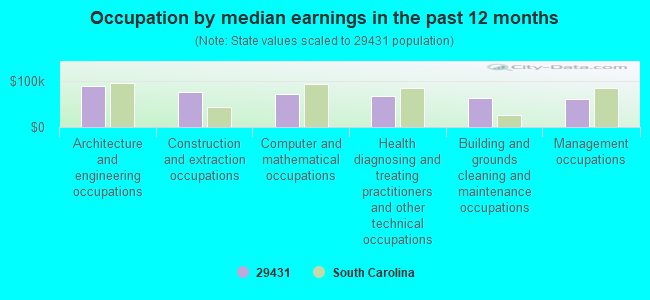
Occupation by median earnings in the past 12 months ($)
88,530Architecture and engineering occupations
76,507Construction and extraction occupations
71,258Computer and mathematical occupations
67,139Health diagnosing and treating practitioners and other technical occupations
63,071Building and grounds cleaning and maintenance occupations
61,744Management occupations
Companies with federal contracts located in this zip code:
ERNEST MERTINS (1175 BETSY HOLE RD in BONNEAU, SC; small business) : $498,734 in 17 contractsfrom 2001 to 2006
Contracts for Maintenance, Repair and Rebuilding of Equipment -- Construction, Mining, Excavating, and Highway Maintenance Equipment, Trash/Garbage Collection Services - Including Portable Sanitation Services, Maintenance, Repair or Alteration of Real Property -- Mine Fire Control Facilities by Air Force Signed by year:2000: $0; 2001: $13,594; 2002: $184,632; 2003: $91,634; 2004: $99,940; 2005: $97,089; 2006: $11,845.
Biggest contracts:
$110,375 with Air Force for Maintenance, Repair and Rebuilding of Equipment -- Construction, Mining, Excavating, and Highway Maintenance Equipment. Signed on 2004-10-01. Completion date: 2005-09-30.
$98,811, same as above.Signed on 2005-10-01. Completion date: 2006-09-30.
$96,501 with Air Force for Trash/Garbage Collection Services - Including Portable Sanitation Services. Signed on 2002-01-31. Completion date: 2006-09-30.
$91,634 with Air Force for Maintenance, Repair and Rebuilding of Equipment -- Construction, Mining, Excavating, and Highway Maintenance Equipment. Signed on 2003-10-01. Completion date: 2006-09-30.
CUMBEE OF BONNEAU INC (1514 MAIN ST in BONNEAU, SC; small business) : $55,164 in 4 contractsfrom 2005 to 2006
$19,889 with Defense Commissary Agency for Maintenance, Repair and Rebuilding of Equipment -- Materials Handling Equipment. Signed on 2006-03-13. Completion date: 2006-03-31.
$15,780 with Defense Commissary Agency for Maintenance, Repair and Rebuilding of Equipment -- Service and Trade Equipment. Signed on 2005-09-02. Completion date: 2006-07-31.
$13,450 with Defense Commissary Agency for Maintenance, Repair and Rebuilding of Equipment -- Materials Handling Equipment. Signed on 2005-03-21. Completion date: 2006-03-31.
$6,045, same as above.Signed on 2005-06-14. Completion date: 2006-03-31.
Top industries in this zip code by the number of employees in 2005:
Other Services (except Public Administration): Religious Organizations (5-9 employees: 1 establishment, 1-4 employees: 6 establishments)
Professional, Scientific, and Technical Services: Testing Laboratories (10-19: 1)
Construction: New Single-Family Housing Construction (except Operative Builders) (10-19: 1)
Wholesale Trade: Tire and Tube Merchant Wholesalers (10-19: 1)
Construction: Other Building Finishing Contractors (10-19: 1)
Administrative and Support and Waste Management and Remediation Services: Landscaping Services (5-9: 1, 1-4: 1)
Accommodation and Food Services: Limited-Service Restaurants (1-4: 3)
Real Estate and Rental and Leasing: Offices of Real Estate Agents and Brokers (1-4: 2)
Fatal accident statistics in 2014:
Fatal accident count: 2
Vehicles involved in fatal accidents: 3
Fatal accidents caused by drunken drivers: 1
Fatalities: 2
Persons involved in fatal accidents: 3
Pedestrians involved in fatal accidents: 0
Fatal accident statistics in 2013:
Fatal accident count: 2
Vehicles involved in fatal accidents: 3
Fatal accidents caused by drunken drivers: 1
Fatalities: 2
Persons involved in fatal accidents: 4
Pedestrians involved in fatal accidents: 0
Home Mortgage Disclosure Act Aggregated Statistics For Year 2009 (Based on 4 partial tracts)
A) FHA, FSA/RHS & VA Home Purchase Loans
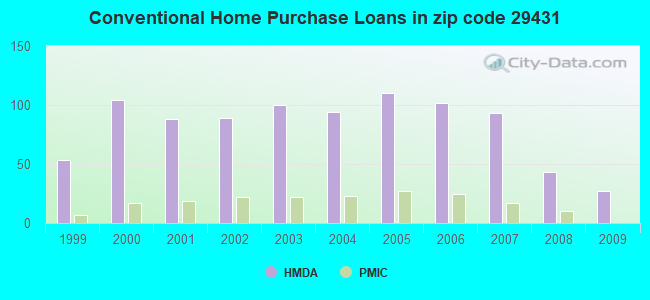
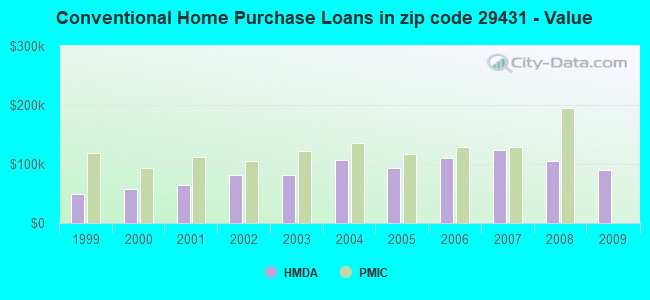
B) Conventional Home Purchase Loans
C) Refinancings
D) Home Improvement Loans
F) Non-occupant Loans on < 5 Family Dwellings (A B C & D)
G) Loans On Manufactured Home Dwelling (A B C & D)
Number
Average Value
Number
Average Value
Number
Average Value
Number
Average Value
Number
Average Value
Number
Average Value
LOANS ORIGINATED
21
$133,720
27
$90,072
131
$157,464
28
$18,260
13
$93,312
47
$66,799
APPLICATIONS APPROVED, NOT ACCEPTED
4
$106,678
0
$0
15
$133,488
3
$91,043
0
$0
3
$139,967
APPLICATIONS DENIED
6
$103,032
14
$113,099
91
$165,240
8
$58,562
7
$143,579
20
$69,450
APPLICATIONS WITHDRAWN
4
$110,808
4
$54,675
37
$177,193
0
$0
1
$112,750
8
$91,732
FILES CLOSED FOR INCOMPLETENESS
1
$116,640
0
$0
9
$153,792
0
$0
0
$0
2
$102,060
Aggregated Statistics For Year 2008 (Based on 4 partial tracts)
A) FHA, FSA/RHS & VA Home Purchase Loans
B) Conventional Home Purchase Loans
C) Refinancings
D) Home Improvement Loans
F) Non-occupant Loans on < 5 Family Dwellings (A B C & D)
G) Loans On Manufactured Home Dwelling (A B C & D)
Number
Average Value
Number
Average Value
Number
Average Value
Number
Average Value
Number
Average Value
Number
Average Value
LOANS ORIGINATED
19
$143,396
43
$105,473
117
$132,375
43
$32,799
19
$81,085
77
$63,205
APPLICATIONS APPROVED, NOT ACCEPTED
3
$121,500
9
$120,312
23
$129,994
0
$0
2
$25,270
11
$86,950
APPLICATIONS DENIED
9
$140,940
20
$88,890
85
$139,716
32
$76,272
11
$97,642
43
$79,116
APPLICATIONS WITHDRAWN
7
$129,554
6
$71,280
26
$125,874
5
$162,518
2
$77,760
16
$82,256
FILES CLOSED FOR INCOMPLETENESS
0
$0
0
$0
15
$169,581
0
$0
0
$0
2
$96,230
Aggregated Statistics For Year 2007 (Based on 4 partial tracts)
A) FHA, FSA/RHS & VA Home Purchase Loans
B) Conventional Home Purchase Loans
C) Refinancings
D) Home Improvement Loans
F) Non-occupant Loans on < 5 Family Dwellings (A B C & D)
G) Loans On Manufactured Home Dwelling (A B C & D)
Number
Average Value
Number
Average Value
Number
Average Value
Number
Average Value
Number
Average Value
Number
Average Value
LOANS ORIGINATED
15
$150,660
93
$122,995
140
$121,729
65
$53,041
23
$129,065
103
$62,368
APPLICATIONS APPROVED, NOT ACCEPTED
0
$0
19
$78,629
26
$116,827
5
$64,346
10
$96,520
17
$73,300
APPLICATIONS DENIED
1
$123,440
68
$101,731
111
$125,187
39
$57,198
14
$118,376
79
$56,314
APPLICATIONS WITHDRAWN
1
$87,480
6
$91,530
56
$145,522
9
$100,656
1
$45,680
18
$109,458
FILES CLOSED FOR INCOMPLETENESS
0
$0
2
$286,740
14
$147,258
1
$166,210
1
$267,300
1
$97,200
Aggregated Statistics For Year 2006 (Based on 4 partial tracts)
A) FHA, FSA/RHS & VA Home Purchase Loans
B) Conventional Home Purchase Loans
C) Refinancings
D) Home Improvement Loans
F) Non-occupant Loans on < 5 Family Dwellings (A B C & D)
G) Loans On Manufactured Home Dwelling (A B C & D)
Number
Average Value
Number
Average Value
Number
Average Value
Number
Average Value
Number
Average Value
Number
Average Value
LOANS ORIGINATED
10
$139,288
102
$109,388
139
$115,046
51
$39,909
35
$80,870
90
$55,307
APPLICATIONS APPROVED, NOT ACCEPTED
6
$94,770
24
$101,250
22
$115,756
5
$41,212
3
$70,957
28
$77,552
APPLICATIONS DENIED
6
$79,380
72
$99,117
122
$107,565
41
$63,939
9
$107,136
87
$68,129
APPLICATIONS WITHDRAWN
5
$108,086
14
$105,531
49
$116,104
4
$93,798
3
$118,260
14
$85,814
FILES CLOSED FOR INCOMPLETENESS
1
$174,960
4
$92,340
16
$145,253
1
$24,300
2
$155,520
0
$0
Aggregated Statistics For Year 2005 (Based on 4 partial tracts)
A) FHA, FSA/RHS & VA Home Purchase Loans
B) Conventional Home Purchase Loans
C) Refinancings
D) Home Improvement Loans
F) Non-occupant Loans on < 5 Family Dwellings (A B C & D)
G) Loans On Manufactured Home Dwelling (A B C & D)
Number
Average Value
Number
Average Value
Number
Average Value
Number
Average Value
Number
Average Value
Number
Average Value
LOANS ORIGINATED
5
$99,144
110
$92,658
145
$107,309
49
$31,778
33
$71,545
91
$64,280
APPLICATIONS APPROVED, NOT ACCEPTED
1
$46,660
29
$66,632
25
$100,272
4
$29,645
2
$64,640
28
$53,738
APPLICATIONS DENIED
10
$75,913
98
$61,266
135
$97,567
28
$46,864
14
$52,627
139
$59,061
APPLICATIONS WITHDRAWN
2
$166,210
24
$77,477
81
$110,460
6
$93,312
8
$81,405
22
$72,679
FILES CLOSED FOR INCOMPLETENESS
0
$0
5
$91,174
17
$169,414
0
$0
0
$0
6
$83,107
Aggregated Statistics For Year 2004 (Based on 4 partial tracts)
A) FHA, FSA/RHS & VA Home Purchase Loans
B) Conventional Home Purchase Loans
C) Refinancings
D) Home Improvement Loans
F) Non-occupant Loans on < 5 Family Dwellings (A B C & D)
G) Loans On Manufactured Home Dwelling (A B C & D)
Number
Average Value
Number
Average Value
Number
Average Value
Number
Average Value
Number
Average Value
Number
Average Value
LOANS ORIGINATED
9
$106,164
94
$107,116
149
$99,914
48
$47,871
27
$100,440
97
$62,649
APPLICATIONS APPROVED, NOT ACCEPTED
1
$33,050
33
$82,119
40
$96,350
2
$49,570
4
$90,395
36
$61,560
APPLICATIONS DENIED
5
$114,890
81
$68,688
166
$93,406
32
$28,279
8
$68,648
101
$61,082
APPLICATIONS WITHDRAWN
1
$233,280
17
$89,996
68
$109,650
10
$70,567
4
$103,518
13
$68,040
FILES CLOSED FOR INCOMPLETENESS
0
$0
6
$100,763
25
$107,114
3
$25,920
2
$136,080
5
$90,980
Aggregated Statistics For Year 2003 (Based on 4 partial tracts)
A) FHA, FSA/RHS & VA Home Purchase Loans
B) Conventional Home Purchase Loans
C) Refinancings
D) Home Improvement Loans
F) Non-occupant Loans on < 5 Family Dwellings (A B C & D)
Number
Average Value
Number
Average Value
Number
Average Value
Number
Average Value
Number
Average Value
LOANS ORIGINATED
8
$92,582
100
$81,658
224
$93,989
35
$16,191
27
$73,296
APPLICATIONS APPROVED, NOT ACCEPTED
6
$43,417
32
$56,680
53
$91,221
3
$27,540
3
$49,897
APPLICATIONS DENIED
17
$45,169
148
$57,039
159
$76,452
15
$18,273
7
$65,263
APPLICATIONS WITHDRAWN
1
$97,200
17
$99,887
72
$90,801
0
$0
5
$76,400
FILES CLOSED FOR INCOMPLETENESS
0
$0
1
$97,200
9
$82,512
0
$0
1
$57,350
Aggregated Statistics For Year 2002 (Based on 4 partial tracts)
A) FHA, FSA/RHS & VA Home Purchase Loans
B) Conventional Home Purchase Loans
C) Refinancings
D) Home Improvement Loans
F) Non-occupant Loans on < 5 Family Dwellings (A B C & D)
Number
Average Value
Number
Average Value
Number
Average Value
Number
Average Value
Number
Average Value
LOANS ORIGINATED
5
$103,032
89
$81,375
193
$92,466
18
$14,958
29
$58,990
APPLICATIONS APPROVED, NOT ACCEPTED
3
$59,940
21
$45,777
47
$74,348
6
$29,322
10
$55,307
APPLICATIONS DENIED
2
$104,490
68
$50,129
106
$76,595
9
$7,128
9
$46,332
APPLICATIONS WITHDRAWN
0
$0
16
$81,830
50
$85,128
0
$0
6
$62,693
FILES CLOSED FOR INCOMPLETENESS
0
$0
1
$82,620
18
$109,998
0
$0
0
$0
Aggregated Statistics For Year 2001 (Based on 4 partial tracts)
A) FHA, FSA/RHS & VA Home Purchase Loans
B) Conventional Home Purchase Loans
C) Refinancings
D) Home Improvement Loans
F) Non-occupant Loans on < 5 Family Dwellings (A B C & D)
Number
Average Value
Number
Average Value
Number
Average Value
Number
Average Value
Number
Average Value
LOANS ORIGINATED
7
$94,423
88
$63,898
180
$83,997
34
$11,064
27
$75,744
APPLICATIONS APPROVED, NOT ACCEPTED
0
$0
31
$57,317
34
$77,474
0
$0
5
$68,234
APPLICATIONS DENIED
3
$112,427
90
$49,313
118
$71,129
15
$8,035
7
$42,490
APPLICATIONS WITHDRAWN
4
$74,115
10
$58,028
64
$73,705
10
$17,788
5
$39,852
FILES CLOSED FOR INCOMPLETENESS
0
$0
2
$110,810
8
$75,938
1
$10,690
0
$0
Aggregated Statistics For Year 2000 (Based on 4 partial tracts)
A) FHA, FSA/RHS & VA Home Purchase Loans
B) Conventional Home Purchase Loans
C) Refinancings
D) Home Improvement Loans
E) Loans on Dwellings For 5+ Families
F) Non-occupant Loans on < 5 Family Dwellings (A B C & D)
Number
Average Value
Number
Average Value
Number
Average Value
Number
Average Value
Number
Average Value
Number
Average Value
LOANS ORIGINATED
8
$89,545
104
$57,086
78
$66,233
25
$10,886
0
$0
17
$59,635
APPLICATIONS APPROVED, NOT ACCEPTED
2
$41,310
32
$47,324
26
$61,946
5
$38,492
0
$0
3
$27,863
APPLICATIONS DENIED
4
$47,870
133
$41,401
120
$66,153
17
$22,127
1
$69,980
6
$42,768
APPLICATIONS WITHDRAWN
4
$94,040
11
$58,585
35
$63,041
2
$23,330
0
$0
3
$56,377
FILES CLOSED FOR INCOMPLETENESS
0
$0
2
$56,375
11
$62,031
0
$0
0
$0
0
$0
Aggregated Statistics For Year 1999 (Based on 2 partial tracts)
A) FHA, FSA/RHS & VA Home Purchase Loans
B) Conventional Home Purchase Loans
C) Refinancings
D) Home Improvement Loans
F) Non-occupant Loans on < 5 Family Dwellings (A B C & D)
Detailed PMIC statistics for the following Tracts:0203.00
2003 - 2018 National Fire Incident Reporting System (NFIRS) incidents
According to the data from the years 2003 - 2018 the average number of fires per year is 31. The highest number of fire incidents - 90 took place in 2011, and the least - 0 in 2004. The data has a growing trend.
When looking into fire subcategories, the most reports belonged to: Outside Fires (34.7%), and Structure Fires (34.1%).
Fire incident types reported to NFIRS in Zip Code 29431
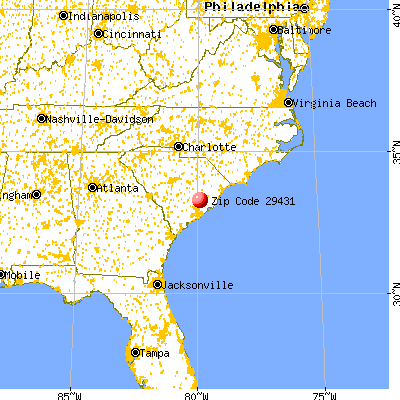


 Nearest zip codes: 29479, 29434, 29461, 29564, 29469, 29468.
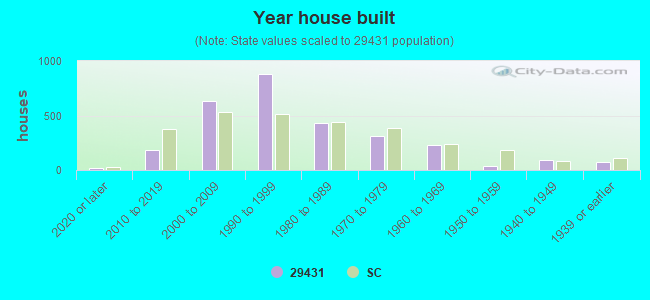


 : $498,734 in 17 contracts from 2001 to 2006
 According to the data from the years 2003 - 2018 the average number of fires per year is 31. The highest number of fire incidents - 90 took place in 2011, and the least - 0 in 2004. The data has a growing trend.
 When looking into fire subcategories, the most reports belonged to: Outside Fires (34.7%), and Structure Fires (34.1%).