Estimated zip code population in 2022: 1,835 Zip code population in 2010: 1,375 Zip code population in 2000: 1,601
Houses and condos: 533 Renter-occupied apartments: 109
% of renters here:
20%
State:
34%
March 2022 cost of living index in zip code 30575: 80.7 (low, U.S. average is 100)
Land area: 11.5 sq. mi. Water area: 0.1 sq. mi.
Population density: 159 people per square mile
(very low).
OSM Map
General Map
Google Map
MSN Map
OSM Map
General Map
Google Map
MSN Map
OSM Map
General Map
Google Map
MSN Map
OSM Map
General Map
Google Map
MSN Map
Please wait while loading the map...
Real estate property taxes paid for housing units in 2022:
This zip code:
0.6% ($1,872)
Georgia:
0.7% ($2,160)
Median real estate property taxes paid for housing units with mortgages in 2022: $1,524 (0.4%) Median real estate property taxes paid for housing units with no mortgage in 2022: $2,907 (1.3%)
Business Search- 14 Million verified businesses
Males: 792
(43.2%)
Females: 1,042
(56.8%)
For population 25 years and over in 30575:
High school or higher: 59.6%
Bachelor's degree or higher: 19.6%
Graduate or professional degree: 3.4%
Unemployed: 5.4%
Mean travel time to work (commute): 28.5 minutes
For population 15 years and over in 30575:
Never married: 25.5%
Now married: 61.2%
Separated: 2.1%
Widowed: 3.7%
Divorced: 7.6%
Zip code 30575 compared to state average:
Black race population percentage significantly below state average.
Hispanic race population percentage significantly above state average.
Renting percentage below state average.
Length of stay since moving in significantly below state average.
Number of rooms per house above state average.
House age below state average.
Percentage of population with a bachelor's degree or higher below state average.
Averages for the 2020 tax year for zip code 30575, filed in 2021:
Average Adjusted Gross Income (AGI) in 2020: $54,378 (Individual Income Tax Returns)
Here:
$54,378
State:
$70,847
Salary/wage: $47,300 (reported on 85.7% of returns)
Here:
$47,300
State:
$59,126
(% of AGI for various income ranges: 1187.1% for AGIs below $25k, 3927.3% for AGIs $25k-50k, 6837.8% for AGIs $50k-75k, 9688.0% for AGIs $75k-100k, 29590.0% for AGIs $100k-200k)
Taxable interest for individuals: $1,027 (reported on 14.3% of returns)
This zip code:
$1,027
Georgia:
$2,011
(% of AGI for various income ranges: 15.7% for AGIs below $25k, 22.2% for AGIs $50k-75k, 150.0% for AGIs $100k-200k)
Ordinary dividends: $3,229 (reported on 9.1% of returns)
Here:
$3,229
State:
$8,996
(% of AGI for various income ranges: 15.3% for AGIs $25k-50k, 507.5% for AGIs $100k-200k)
Net capital gain/loss in AGI: +$13,717 (reported on 7.8% of returns)
Here:
+$13,717
State:
+$28,402
(% of AGI for various income ranges: 13.3% for AGIs $25k-50k, 2007.5% for AGIs $100k-200k)
Profit/loss from business: +$7,887 (reported on 19.5% of returns)
Here:
+$7,887
State:
+$6,707
(% of AGI for various income ranges: 288.6% for AGIs below $25k, 338.7% for AGIs $25k-50k, 138.0% for AGIs $75k-100k)
Taxable individual retirement arrangement distribution: $9,167 (reported on 3.9% of returns)
30575:
$9,167
Georgia:
$20,525
(% of AGI for various income ranges: 183.3% for AGIs $25k-50k)
Total itemized deductions: $23,783 (reported on 7.8% of returns)
Here:
$23,783
State:
$34,001
(% of AGI for various income ranges: 332.7% for AGIs $25k-50k, 2320.0% for AGIs $100k-200k)
Charity contributions: $8,650 (reported on 5.2% of returns)
Here:
$8,650
State:
$14,164
(% of AGI for various income ranges: 865.0% for AGIs $100k-200k)
Taxes paid: $6,383 (reported on 7.8% of returns)
30575:
$6,383
State:
$7,540
(% of AGI for various income ranges: 74.0% for AGIs $25k-50k, 680.0% for AGIs $100k-200k)
Earned income credit: $2,588 (reported on 22.1% of returns)
Here:
$2,588
State:
$2,530
(% of AGI for various income ranges: 140.0% for AGIs below $25k, 97.3% for AGIs $25k-50k)
Percentage of individuals using paid preparers for their 2020 taxes: 94.8%
Here:
95%
State:
93%
(% for various income ranges: 89.3% for AGIs below $25k, 95.0% for AGIs $25k-50k, 100.0% for AGIs $50k-75k, 100.0% for AGIs $75k-100k, 100.0% for AGIs $100k-200k, 100.0% for AGIs over 200k)
Averages for the 2012 tax year for zip code 30575, filed in 2013:
Average Adjusted Gross Income (AGI) in 2012: $37,477 (Individual Income Tax Returns)
Here:
$37,477
State:
$56,131
Salary/wage: $34,496 (reported on 83.9% of returns)
Here:
$34,496
State:
$47,942
(% of AGI for various income ranges: 74.6% for AGIs below $25k, 80.8% for AGIs $25k-50k, 78.6% for AGIs $50k-75k, 86.3% for AGIs $75k-100k, 66.5% for AGIs $100k-200k)
Taxable interest for individuals: $883 (reported on 19.4% of returns)
This zip code:
$883
Georgia:
$1,706
(% of AGI for various income ranges: 0.4% for AGIs below $25k, 1.0% for AGIs $25k-50k, 0.2% for AGIs $50k-75k, 0.4% for AGIs $100k-200k)
Ordinary dividends: $1,680 (reported on 8.1% of returns)
Here:
$1,680
State:
$7,265
Profit/loss from business: +$5,354 (reported on 21.0% of returns)
Here:
+$5,354
State:
+$7,583
(% of AGI for various income ranges: 13.1% for AGIs below $25k, 1.1% for AGIs $25k-50k, 2.2% for AGIs $50k-75k)
Taxable individual retirement arrangement distribution: $6,375 (reported on 6.5% of returns)
30575:
$6,375
Georgia:
$17,199
Total itemized deductions: $19,133 (28% of AGI, reported on 29.0% of returns)
Here:
$19,133
State:
$23,886
Here:
28.0% of AGI
State:
21.5% of AGI
(% of AGI for various income ranges: 21.2% for AGIs $25k-50k, 17.1% for AGIs $50k-75k, 17.6% for AGIs $75k-100k, 14.8% for AGIs $100k-200k)
Charity contributions: $2,994 (reported on 25.8% of returns)
Here:
$2,994
State:
$5,507
(% of AGI for various income ranges: 2.8% for AGIs $25k-50k, 2.2% for AGIs $50k-75k, 2.7% for AGIs $75k-100k, 2.2% for AGIs $100k-200k)
Taxes paid: $5,583 (reported on 29.0% of returns)
30575:
$5,583
State:
$7,838
(% of AGI for various income ranges: 4.5% for AGIs $25k-50k, 4.9% for AGIs $50k-75k, 5.7% for AGIs $75k-100k, 6.0% for AGIs $100k-200k)
Earned income credit: $2,653 (reported on 27.4% of returns)
Here:
$2,653
State:
$2,589
(% of AGI for various income ranges: 9.1% for AGIs below $25k, 1.5% for AGIs $25k-50k)
Percentage of individuals using paid preparers for their 2012 taxes: 64.5%
Here:
65%
State:
55%
(% for various income ranges: 62.1% for AGIs below $25k, 64.7% for AGIs $25k-50k, 75.0% for AGIs $50k-75k, 50.0% for AGIs $75k-100k, 75.0% for AGIs $100k-200k)
Averages for the 2004 tax year for zip code 30575, filed in 2005:
Average Adjusted Gross Income (AGI) in 2004: $35,211 (Individual Income Tax Returns)
Here:
$35,211
State:
$47,553
Salary/wage: $32,496 (reported on 89.8% of returns)
Here:
$32,496
State:
$42,178
(% of AGI for various income ranges: 76.7% for AGIs below $10k, 86.6% for AGIs $10k-25k, 88.7% for AGIs $25k-50k, 85.0% for AGIs $50k-75k, 83.4% for AGIs $75k-100k, 68.5% for AGIs over 100k)
Taxable interest for individuals: $1,140 (reported on 25.1% of returns)
This zip code:
$1,140
Georgia:
$1,772
(% of AGI for various income ranges: 3.3% for AGIs below $10k, 1.9% for AGIs $10k-25k, 0.3% for AGIs $25k-50k, 0.7% for AGIs $50k-75k, 0.2% for AGIs $75k-100k, 0.9% for AGIs over 100k)
Taxable dividends: $1,310 (reported on 10.2% of returns)
Here:
$1,310
State:
$4,283
(% of AGI for various income ranges: 1.0% for AGIs $10k-25k, 0.4% for AGIs $50k-75k, 1.1% for AGIs $75k-100k)
Net capital gain/loss: +$32,657 (reported on 6.1% of returns)
Here:
+$32,657
State:
+$16,461
(% of AGI for various income ranges: 2.2% for AGIs below $10k, -0.1% for AGIs $50k-75k, 44.3% for AGIs $75k-100k)
Profit/loss from business: +$6,250 (reported on 14.7% of returns)
Here:
+$6,250
State:
+$8,201
(% of AGI for various income ranges: 16.6% for AGIs below $10k, 5.8% for AGIs $10k-25k, 4.5% for AGIs $25k-50k, 0.4% for AGIs $50k-75k)
Total itemized deductions: $16,792 (25% of AGI, reported on 29.5% of returns)
Here:
$16,792
State:
$19,944
Here:
24.6% of AGI
State:
22.6% of AGI
(% of AGI for various income ranges: 5.8% for AGIs $10k-25k, 10.8% for AGIs $25k-50k, 19.6% for AGIs $50k-75k, 14.8% for AGIs $75k-100k, 18.9% for AGIs over 100k)
Charity contributions deductions: $3,926 (6% of AGI, reported on 26.1% of returns)
Here:
$3,926
State:
$4,354
Here:
5.6% of AGI
State:
4.7% of AGI
(% of AGI for various income ranges: 4.4% for AGIs below $10k, 2.0% for AGIs $25k-50k, 4.7% for AGIs $50k-75k, 2.9% for AGIs $75k-100k, 3.5% for AGIs over 100k)
Total tax: $4,138 (reported on 66.1% of returns)
30575:
$4,138
State:
$8,223
(% of AGI for various income ranges: 3.2% for AGIs below $10k, 3.0% for AGIs $10k-25k, 5.6% for AGIs $25k-50k, 7.7% for AGIs $50k-75k, 10.5% for AGIs $75k-100k, 13.9% for AGIs over 100k)
Earned income credit: $2,101 (reported on 27.7% of returns)
Here:
$2,101
State:
$1,986
Percentage of individuals using paid preparers for their 2004 taxes: 74.2%
Here:
74%
State:
62%
(% for various income ranges: 68.9% for AGIs below $10k, 77.4% for AGIs $10k-25k, 75.7% for AGIs $25k-50k, 72.2% for AGIs $50k-75k, 80.0% for AGIs $75k-100k, 70.0% for AGIs over 100k)
Household received Food Stamps/SNAP in the past 12 months: 42 Household did not receive Food Stamps/SNAP in the past 12 months: 489
Women who had a birth in the past 12 months: 3 (3 now married, 0 unmarried) Women who did not have a birth in the past 12 months: 415 (271 now married, 142 unmarried)
Housing units in zip code 30575 with a mortgage: 239 (10 second mortgage, 9 both second mortgage and home equity loan) Houses without a mortgage: 16
Median monthly owner costs for units with a mortgage: $1,208 Median monthly owner costs for units without a mortgage: $715
Residents with income below the poverty level in 2022:
This zip code:
10.3%
Whole state:
12.7%
Residents with income below 50% of the poverty level in 2022:
This zip code:
3.7%
Whole state:
6.3%
Median number of rooms in houses and condos:
Here:
7.6
State:
6.8
Median number of rooms in apartments:
Here:
4.2
State:
4.6
Notable locations in this zip code not listed on our city pages
Size of family households: 101 2-persons, 74 3-persons, 101 4-persons, 16 5-persons, 26 6-persons, 63 7-or-more-persons
Size of nonfamily households: 141 1-person, 8 2-persons, 2 3-persons
554 married couples with children.
95 single-parent households (95 men).
61.9% of residents of 30575 zip code speak English at home.
35.7% of residents speak Spanish at home (56% very well, 30% well, 14% not well).
0.6% of residents speak other Indo-European language at home (100% well).
Foreign born population: 228 (12.5%) (47.8% of them are naturalized citizens)
This zip code:
12.5%
Whole state:
10.7%
87%Honduras
4%Serbia
3%Costa Rica
20%American
15%English
7%Irish
5%Scottish
5%German
1%Ukrainian
1%Polish
Year of entry for the foreign-born population
02010 or later
1012000 to 2009
191990 to 1999
93Before 1990
Facilities with environmental interests located in this zip code:
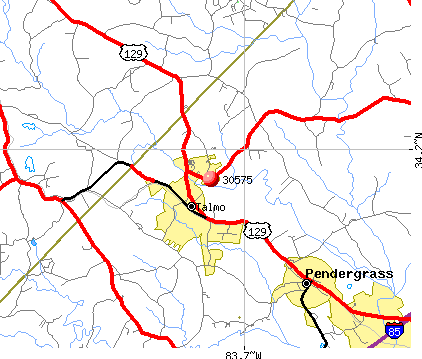
NORTH JACKSON ELEMENTARY SCHOOL (8632 U.S. HIGHWAY 129 NORTH in TALMO, GA)
(National Center for Education Statistics) - STATE ID-3050 Organizations: JACKSON COUNTY (SCHOOL DISTRICT)
AGRI-CYCLE, LLC (HIGHWAY 332 in TALMO, GA)
National Pollutant Discharge Elimination System NON-MAJOR (Tracking pollutant discharge elimination systems) - permit Business SIC classification: POULTRY SLAUGHTERING AND PROCESSING Alternative names: MOTT'S - VALLEY FRESH, INC., MR RICHARD HARVILLE, VALLEY FRESH, INC.
MOTTS PREPARED FOODS (GA HWY 332 in TALMO, GA)
AIR MINOR (AIRS/AFS)
CONAGRA POULTRY CO (1184 MAIN ST. in TALMO, GA)
TRI REPORTER (Tracking of toxic chemicals releasing facilities) Business SIC classification: POULTRY SLAUGHTERING AND PROCESSING
73.9%Electricity
20.4%Utility gas
5.3%Bottled, tank, or LP gas
Population in 1990: 1,153. Population change in the 1990s: +448 (+38.9%).
Place of birth for U.S.-born residents:
This state: 1,378
Northeast: 93
Midwest: 39
South: 78
60% of the 30575 zip code residents lived in the same house 5 years ago. Out of people who lived in different houses, 30% lived in this county. Out of people who lived in different counties, 50% lived in Georgia.
93% of the 30575 zip code residents lived in the same house 1 year ago. Out of people who lived in different houses, 82% moved from this county. Out of people who lived in different houses, 9% moved from different county within same state.
Private vs. public school enrollment:
Students in private schools in grades 1 to 8 (elementary and middle school):
Here:
0.0%
Georgia:
12.1%
Students in private schools in grades 9 to 12 (high school): 9
Here:
4.7%
Georgia:
10.8%
Students in private undergraduate colleges: 7
Here:
8.1%
Georgia:
17.1%
Occupation by median earnings in the past 12 months ($)
92,413Management occupations
68,619Installation, maintenance, and repair occupations
57,922Business and financial operations occupations
43,426Construction and extraction occupations
39,697Food preparation and serving related occupations
34,146Sales and related occupations
Top industries in this zip code by the number of employees in 2005:
Construction: Water and Sewer Line and Related Structures Construction (20-49 employees: 1 establishment)
Construction: Site Preparation Contractors (20-49: 1)
Construction: Commercial and Institutional Building Construction (10-19: 1, 1-4: 1)
Real Estate and Rental and Leasing: Lessors of Residential Buildings and Dwellings (1-4: 1)
Other Services (except Public Administration): Religious Organizations (1-4: 1)
Professional, Scientific, and Technical Services: Administrative Management and General Management Consulting Services (1-4: 1)
Other Services (except Public Administration): General Automotive Repair (1-4: 1)
Fatal accident statistics in 2014:
Fatal accident count: 1
Vehicles involved in fatal accidents: 1
Fatal accidents caused by drunken drivers: 0
Fatalities: 1
Persons involved in fatal accidents: 1
Pedestrians involved in fatal accidents: 0
Fatal accident statistics in 2012:
Fatal accident count: 2
Vehicles involved in fatal accidents: 3
Fatal accidents caused by drunken drivers: 2
Fatalities: 2
Persons involved in fatal accidents: 4
Pedestrians involved in fatal accidents: 0
Home Mortgage Disclosure Act Aggregated Statistics For Year 2009 (Based on 2 partial tracts)
A) FHA, FSA/RHS & VA Home Purchase Loans
B) Conventional Home Purchase Loans
C) Refinancings
D) Home Improvement Loans
F) Non-occupant Loans on < 5 Family Dwellings (A B C & D)
G) Loans On Manufactured Home Dwelling (A B C & D)
Number
Average Value
Number
Average Value
Number
Average Value
Number
Average Value
Number
Average Value
Number
Average Value
LOANS ORIGINATED
7
$99,207
5
$99,004
23
$136,390
2
$24,900
4
$157,118
3
$159,903
APPLICATIONS APPROVED, NOT ACCEPTED
1
$87,100
0
$0
3
$107,943
1
$18,110
0
$0
1
$38,590
APPLICATIONS DENIED
1
$142,080
1
$70,500
20
$122,828
2
$14,555
1
$67,270
3
$66,047
APPLICATIONS WITHDRAWN
2
$69,425
0
$0
8
$130,680
0
$0
1
$56,490
1
$43,120
FILES CLOSED FOR INCOMPLETENESS
0
$0
0
$0
2
$155,985
0
$0
0
$0
0
$0
Aggregated Statistics For Year 2008 (Based on 2 partial tracts)
A) FHA, FSA/RHS & VA Home Purchase Loans
B) Conventional Home Purchase Loans
C) Refinancings
D) Home Improvement Loans
F) Non-occupant Loans on < 5 Family Dwellings (A B C & D)
G) Loans On Manufactured Home Dwelling (A B C & D)
Number
Average Value
Number
Average Value
Number
Average Value
Number
Average Value
Number
Average Value
Number
Average Value
LOANS ORIGINATED
7
$156,403
8
$148,118
31
$137,497
2
$38,915
9
$149,219
3
$84,370
APPLICATIONS APPROVED, NOT ACCEPTED
0
$0
1
$128,500
4
$127,850
0
$0
0
$0
0
$0
APPLICATIONS DENIED
2
$110,385
3
$137,697
22
$130,046
4
$44,790
2
$51,315
3
$34,353
APPLICATIONS WITHDRAWN
0
$0
1
$247,510
9
$143,350
1
$40,320
1
$82,360
1
$74,380
FILES CLOSED FOR INCOMPLETENESS
0
$0
1
$96,370
3
$99,247
0
$0
0
$0
0
$0
Aggregated Statistics For Year 2007 (Based on 2 partial tracts)
A) FHA, FSA/RHS & VA Home Purchase Loans
B) Conventional Home Purchase Loans
C) Refinancings
D) Home Improvement Loans
F) Non-occupant Loans on < 5 Family Dwellings (A B C & D)
G) Loans On Manufactured Home Dwelling (A B C & D)
Number
Average Value
Number
Average Value
Number
Average Value
Number
Average Value
Number
Average Value
Number
Average Value
LOANS ORIGINATED
5
$150,488
30
$135,699
28
$116,562
4
$76,862
10
$104,113
3
$73,447
APPLICATIONS APPROVED, NOT ACCEPTED
0
$0
4
$145,100
11
$121,598
1
$82,790
2
$104,995
1
$72,010
APPLICATIONS DENIED
1
$116,860
6
$97,343
32
$127,635
5
$64,982
2
$103,380
3
$101,547
APPLICATIONS WITHDRAWN
1
$109,090
3
$111,393
12
$110,801
1
$77,400
1
$70,500
1
$98,960
FILES CLOSED FOR INCOMPLETENESS
0
$0
1
$140,570
3
$150,847
0
$0
1
$76,750
0
$0
Aggregated Statistics For Year 2006 (Based on 2 partial tracts)
A) FHA, FSA/RHS & VA Home Purchase Loans
B) Conventional Home Purchase Loans
C) Refinancings
D) Home Improvement Loans
F) Non-occupant Loans on < 5 Family Dwellings (A B C & D)
G) Loans On Manufactured Home Dwelling (A B C & D)
Number
Average Value
Number
Average Value
Number
Average Value
Number
Average Value
Number
Average Value
Number
Average Value
LOANS ORIGINATED
5
$151,438
47
$110,484
35
$101,246
4
$41,232
14
$84,623
5
$65,326
APPLICATIONS APPROVED, NOT ACCEPTED
0
$0
3
$87,820
6
$73,483
1
$30,830
2
$56,920
1
$50,880
APPLICATIONS DENIED
2
$99,070
7
$103,981
32
$116,741
8
$31,342
2
$81,065
4
$74,760
APPLICATIONS WITHDRAWN
1
$193,390
5
$120,564
16
$119,321
1
$25,870
2
$116,425
0
$0
FILES CLOSED FOR INCOMPLETENESS
0
$0
1
$148,550
6
$127,132
0
$0
0
$0
0
$0
Aggregated Statistics For Year 2005 (Based on 2 partial tracts)
A) FHA, FSA/RHS & VA Home Purchase Loans
B) Conventional Home Purchase Loans
C) Refinancings
D) Home Improvement Loans
F) Non-occupant Loans on < 5 Family Dwellings (A B C & D)
G) Loans On Manufactured Home Dwelling (A B C & D)
Number
Average Value
Number
Average Value
Number
Average Value
Number
Average Value
Number
Average Value
Number
Average Value
LOANS ORIGINATED
9
$122,700
42
$100,033
37
$102,882
4
$61,930
10
$90,789
5
$73,950
APPLICATIONS APPROVED, NOT ACCEPTED
0
$0
5
$77,486
8
$84,191
2
$32,880
1
$21,990
1
$60,370
APPLICATIONS DENIED
2
$78,800
11
$96,354
37
$107,095
6
$34,208
5
$93,354
6
$71,795
APPLICATIONS WITHDRAWN
1
$97,450
4
$92,548
22
$114,925
2
$73,950
2
$77,830
1
$90,550
FILES CLOSED FOR INCOMPLETENESS
1
$81,500
1
$56,920
9
$113,884
0
$0
0
$0
1
$62,520
Aggregated Statistics For Year 2004 (Based on 2 partial tracts)
A) FHA, FSA/RHS & VA Home Purchase Loans
B) Conventional Home Purchase Loans
C) Refinancings
D) Home Improvement Loans
F) Non-occupant Loans on < 5 Family Dwellings (A B C & D)
G) Loans On Manufactured Home Dwelling (A B C & D)


 Nearest zip codes: 30567, 30507, 30543, 30517, 30548, 30501.


