Estimated zip code population in 2022: 2,771 Zip code population in 2010: 2,496 Zip code population in 2000: 1,664
Houses and condos: 1,224 Renter-occupied apartments: 172
% of renters here:
18%
State:
34%
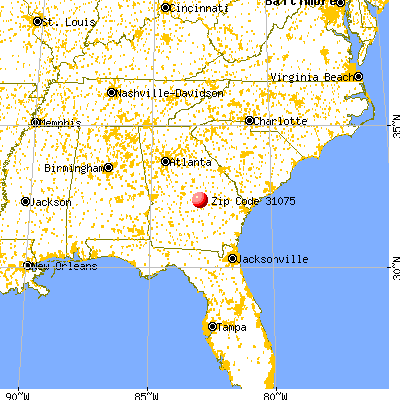
March 2022 cost of living index in zip code 31075: 80.1 (low, U.S. average is 100)
Land area: 54.6 sq. mi. Water area: 0.5 sq. mi.
Population density: 51 people per square mile
(very low).
OSM Map
General Map
Google Map
MSN Map
OSM Map
General Map
Google Map
MSN Map
OSM Map
General Map
Google Map
MSN Map
OSM Map
General Map
Google Map
MSN Map
Please wait while loading the map...
Real estate property taxes paid for housing units in 2022:
This zip code:
0.7% ($705)
Georgia:
0.7% ($2,160)
Median real estate property taxes paid for housing units with mortgages in 2022: $974 (0.5%) Median real estate property taxes paid for housing units with no mortgage in 2022: $604 (0.6%)
Estimated median house/condo value in 2022: $104,374
31075:
$104,374
Georgia:
$297,400
According to our research of Georgia and other state lists, there were 5 registered sex offenders living in 31075 zip code as of June 15, 2024. The ratio of all residents to sex offenders in zip code 31075 is 572 to 1. The ratio of registered sex offenders to all residents in this zip code is lower than the state average.
Median resident age:
This zip code:
44.5 years
Georgia median age:
37.6 years
Average household size:
This zip code:
2.9 people
Georgia:
2.6 people
Averages for the 2020 tax year for zip code 31075, filed in 2021:
Average Adjusted Gross Income (AGI) in 2020: $47,271 (Individual Income Tax Returns)
Here:
$47,271
State:
$70,847
Salary/wage: $43,321 (reported on 84.4% of returns)
Here:
$43,321
State:
$59,126
(% of AGI for various income ranges: 1231.6% for AGIs below $25k, 3922.9% for AGIs $25k-50k, 6740.0% for AGIs $50k-75k, 9252.9% for AGIs $75k-100k, 17224.3% for AGIs $100k-200k)
Taxable interest for individuals: $857 (reported on 21.1% of returns)
This zip code:
$857
Georgia:
$2,011
(% of AGI for various income ranges: 8.7% for AGIs below $25k, 18.3% for AGIs $25k-50k, 36.7% for AGIs $50k-75k, 5.7% for AGIs $75k-100k, 111.4% for AGIs $100k-200k)
Ordinary dividends: $1,250 (reported on 5.5% of returns)
Here:
$1,250
State:
$8,996
(% of AGI for various income ranges: 21.2% for AGIs $25k-50k, 34.3% for AGIs $75k-100k)
Net capital gain/loss in AGI: +$11,214 (reported on 6.4% of returns)
Here:
+$11,214
State:
+$28,402
(% of AGI for various income ranges: 21.3% for AGIs below $25k, 11.7% for AGIs $50k-75k, 1007.1% for AGIs $100k-200k)
Profit/loss from business: +$3,681 (reported on 19.3% of returns)
Here:
+$3,681
State:
+$6,707
(% of AGI for various income ranges: 174.2% for AGIs below $25k, 75.4% for AGIs $25k-50k, 148.3% for AGIs $50k-75k)
Taxable individual retirement arrangement distribution: $6,640 (reported on 4.6% of returns)
31075:
$6,640
Georgia:
$20,525
(% of AGI for various income ranges: 53.9% for AGIs below $25k, 137.5% for AGIs $50k-75k)
Total itemized deductions: $28,175 (reported on 3.7% of returns)
Here:
$28,175
State:
$34,001
(% of AGI for various income ranges: 1610.0% for AGIs $100k-200k)
Charity contributions: $13,167 (reported on 2.8% of returns)
Here:
$13,167
State:
$14,164
(% of AGI for various income ranges: 329.2% for AGIs $50k-75k)
Taxes paid: $5,675 (reported on 3.7% of returns)
31075:
$5,675
State:
$7,540
(% of AGI for various income ranges: 324.3% for AGIs $100k-200k)
Earned income credit: $2,650 (reported on 27.5% of returns)
Here:
$2,650
State:
$2,530
(% of AGI for various income ranges: 159.4% for AGIs below $25k, 125.4% for AGIs $25k-50k)
Percentage of individuals using paid preparers for their 2020 taxes: 93.6%
Here:
94%
State:
93%
(% for various income ranges: 90.5% for AGIs below $25k, 93.5% for AGIs $25k-50k, 93.8% for AGIs $50k-75k, 100.0% for AGIs $75k-100k, 100.0% for AGIs $100k-200k)
Averages for the 2012 tax year for zip code 31075, filed in 2013:
Average Adjusted Gross Income (AGI) in 2012: $37,638 (Individual Income Tax Returns)
Here:
$37,638
State:
$56,131
Salary/wage: $35,406 (reported on 84.8% of returns)
Here:
$35,406
State:
$47,942
(% of AGI for various income ranges: 75.6% for AGIs below $25k, 84.1% for AGIs $25k-50k, 80.7% for AGIs $50k-75k, 86.5% for AGIs $75k-100k, 70.9% for AGIs $100k-200k)
Taxable interest for individuals: $860 (reported on 20.2% of returns)
This zip code:
$860
Georgia:
$1,706
(% of AGI for various income ranges: 0.6% for AGIs below $25k, 0.8% for AGIs $25k-50k, 0.2% for AGIs $50k-75k, 0.2% for AGIs $75k-100k, 0.6% for AGIs $100k-200k)
Ordinary dividends: $4,329 (reported on 7.1% of returns)
Here:
$4,329
State:
$7,265
(% of AGI for various income ranges: 4.0% for AGIs below $25k, 0.3% for AGIs $25k-50k, 0.2% for AGIs $75k-100k)
Net capital gain/loss in AGI: +$475 (reported on 4.0% of returns)
Here:
+$475
State:
+$16,323
Profit/loss from business: +$2,567 (reported on 15.2% of returns)
Here:
+$2,567
State:
+$7,583
(% of AGI for various income ranges: 4.5% for AGIs below $25k, 0.7% for AGIs $25k-50k, 0.4% for AGIs $50k-75k)
Taxable individual retirement arrangement distribution: $9,825 (reported on 4.0% of returns)
31075:
$9,825
Georgia:
$17,199
Total itemized deductions: $17,896 (26% of AGI, reported on 26.3% of returns)
Here:
$17,896
State:
$23,886
Here:
26.2% of AGI
State:
21.5% of AGI
(% of AGI for various income ranges: 4.9% for AGIs below $25k, 9.8% for AGIs $25k-50k, 15.2% for AGIs $50k-75k, 15.9% for AGIs $75k-100k, 16.8% for AGIs $100k-200k)
Charity contributions: $4,886 (reported on 22.2% of returns)
Here:
$4,886
State:
$5,507
(% of AGI for various income ranges: 1.1% for AGIs below $25k, 2.0% for AGIs $25k-50k, 3.0% for AGIs $50k-75k, 3.6% for AGIs $75k-100k, 5.0% for AGIs $100k-200k)
Taxes paid: $4,708 (reported on 26.3% of returns)
31075:
$4,708
State:
$7,838
(% of AGI for various income ranges: 0.6% for AGIs below $25k, 2.0% for AGIs $25k-50k, 4.1% for AGIs $50k-75k, 4.3% for AGIs $75k-100k, 5.7% for AGIs $100k-200k)
Earned income credit: $2,665 (reported on 31.3% of returns)
Here:
$2,665
State:
$2,589
(% of AGI for various income ranges: 10.0% for AGIs below $25k, 1.9% for AGIs $25k-50k)
Percentage of individuals using paid preparers for their 2012 taxes: 64.6%
Here:
65%
State:
55%
(% for various income ranges: 63.0% for AGIs below $25k, 61.5% for AGIs $25k-50k, 66.7% for AGIs $50k-75k, 71.4% for AGIs $75k-100k, 80.0% for AGIs $100k-200k)
Averages for the 2004 tax year for zip code 31075, filed in 2005:
Average Adjusted Gross Income (AGI) in 2004: $30,866 (Individual Income Tax Returns)
Here:
$30,866
State:
$47,553
Salary/wage: $30,072 (reported on 86.2% of returns)
Here:
$30,072
State:
$42,178
(% of AGI for various income ranges: 133.3% for AGIs below $10k, 82.0% for AGIs $10k-25k, 86.0% for AGIs $25k-50k, 86.4% for AGIs $50k-75k, 87.1% for AGIs $75k-100k, 62.8% for AGIs over 100k)
Taxable interest for individuals: $1,212 (reported on 29.6% of returns)
This zip code:
$1,212
Georgia:
$1,772
(% of AGI for various income ranges: 7.9% for AGIs below $10k, 1.7% for AGIs $10k-25k, 1.4% for AGIs $25k-50k, 0.6% for AGIs $50k-75k, 0.3% for AGIs $75k-100k, 0.9% for AGIs over 100k)
Taxable dividends: $616 (reported on 8.3% of returns)
Here:
$616
State:
$4,283
(% of AGI for various income ranges: 4.0% for AGIs below $10k, 0.0% for AGIs $25k-50k, 0.1% for AGIs $50k-75k, 0.4% for AGIs $75k-100k)
Net capital gain/loss: +$1,066 (reported on 7.0% of returns)
Here:
+$1,066
State:
+$16,461
(% of AGI for various income ranges: 0.2% for AGIs below $10k, 0.6% for AGIs $25k-50k, 0.0% for AGIs $50k-75k, 0.4% for AGIs $75k-100k)
Profit/loss from business: +$4,882 (reported on 14.5% of returns)
Here:
+$4,882
State:
+$8,201
(% of AGI for various income ranges: 24.9% for AGIs below $10k, 5.2% for AGIs $10k-25k, 0.2% for AGIs $25k-50k, 2.9% for AGIs $50k-75k)
Total itemized deductions: $14,662 (26% of AGI, reported on 24.7% of returns)
Here:
$14,662
State:
$19,944
Here:
25.8% of AGI
State:
22.6% of AGI
(% of AGI for various income ranges: 4.9% for AGIs $10k-25k, 12.9% for AGIs $25k-50k, 12.7% for AGIs $50k-75k, 14.9% for AGIs $75k-100k, 16.7% for AGIs over 100k)
Charity contributions deductions: $3,323 (6% of AGI, reported on 21.6% of returns)
Here:
$3,323
State:
$4,354
Here:
5.9% of AGI
State:
4.7% of AGI
(% of AGI for various income ranges: 1.1% for AGIs $10k-25k, 2.2% for AGIs $25k-50k, 2.6% for AGIs $50k-75k, 3.4% for AGIs $75k-100k, 3.2% for AGIs over 100k)
Total tax: $3,164 (reported on 67.6% of returns)
31075:
$3,164
State:
$8,223
(% of AGI for various income ranges: 5.4% for AGIs below $10k, 3.1% for AGIs $10k-25k, 5.4% for AGIs $25k-50k, 7.7% for AGIs $50k-75k, 8.8% for AGIs $75k-100k, 14.3% for AGIs over 100k)
Earned income credit: $1,896 (reported on 30.7% of returns)
Here:
$1,896
State:
$1,986
Percentage of individuals using paid preparers for their 2004 taxes: 69.9%
Here:
70%
State:
62%
(% for various income ranges: 62.9% for AGIs below $10k, 69.7% for AGIs $10k-25k, 70.4% for AGIs $25k-50k, 75.2% for AGIs $50k-75k, 78.3% for AGIs $75k-100k, 75.0% for AGIs over 100k)
Household received Food Stamps/SNAP in the past 12 months: 159 Household did not receive Food Stamps/SNAP in the past 12 months: 803
Women who had a birth in the past 12 months: 46 (24 now married, 21 unmarried) Women who did not have a birth in the past 12 months: 460 (183 now married, 277 unmarried)
Housing units in zip code 31075 with a mortgage: 281 (12 second mortgage, 12 both second mortgage and home equity loan) Median monthly owner costs for units with a mortgage: $885 Median monthly owner costs for units without a mortgage: $293
Residents with income below the poverty level in 2022:
This zip code:
30.1%
Whole state:
12.7%
Residents with income below 50% of the poverty level in 2022:
This zip code:
14.7%
Whole state:
6.3%
Median number of rooms in houses and condos:
Here:
6.4
State:
6.8
Median number of rooms in apartments:
Here:
6.5
State:
4.6
Notable locations in this zip code not listed on our city pages
Churches in zip code 31075 include: Mount Zion Church (A), New Evergreen Church (B), Reedy Spring Church (C), Fleming Chapel (D), Baker Church (E), Warren Grove Church (F), New Faith Church (G). Display/hide their locations on the map
Size of family households: 309 2-persons, 192 3-persons, 103 4-persons, 31 5-persons, 70 6-persons
Size of nonfamily households: 227 1-person, 26 2-persons
355 married couples with children.
92 single-parent households (18 men, 74 women).
100.2% of residents of 31075 zip code speak English at home.
0.3% of residents speak Asian or Pacific Island language at home (100% well).
Foreign born population: 21 (0.8%) (67.1% of them are naturalized citizens)
This zip code:
0.8%
Whole state:
10.7%
90%Hong Kong
10%English
7%American
3%German
2%Polish
1%Irish
0%Scottish
0%European
Year of entry for the foreign-born population
82010 or later
02000 to 2009
121990 to 1999
5Before 1990
Facilities with environmental interests located in this zip code:
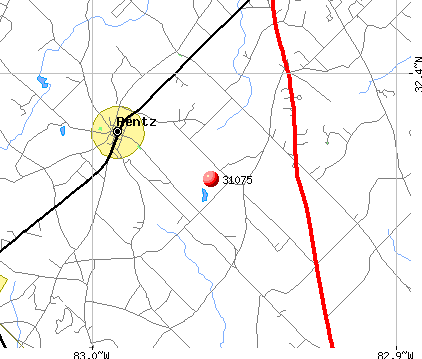
RENTZ CABINET COMPANY (2041 COLLEGE STREET in RENTZ, GA)
AIR MAJOR (AIRS/AFS) (Integrated Compliance Information System) - ICIS-04-2001-1754, FORMAL ENFORCEMENT ACTION CRITERIA AND HAZARDOUS AIR POLLUTANT INVENTORY (Inventory of air pollution sources) Conditionally Exempt Small Quantity Generators, less than 100 kg/month of hazardous waste (Resource Conservation and Recovery Act (tracking hazardous waste)) TRI REPORTER (Tracking of toxic chemicals releasing facilities) Business SIC classification: WOOD KITCHEN CABINETS Business NAICS classification: WOOD KITCHEN CABINET AND COUNTERTOP MANUFACTURING.
RENTZ, TOWN OF (WPCP) (2124 W. RAILROAD STREET in RENTZ, GA)
National Pollutant Discharge Elimination System NON-MAJOR (Tracking pollutant discharge elimination systems) - permit Business SIC classification: SEWERAGE SYSTEMS
Housing units lacking complete plumbing facilities: 8.5% Housing units lacking complete kitchen facilities: 3.5%
95.9%Electricity
2.5%Utility gas
1.7%Bottled, tank, or LP gas
Population in 1990: 3,037.
Place of birth for U.S.-born residents:
This state: 2,195
Northeast: 54
Midwest: 49
South: 396
West: 21
62% of the 31075 zip code residents lived in the same house 5 years ago. Out of people who lived in different houses, 69% lived in this county. Out of people who lived in different counties, 50% lived in Georgia.
94% of the 31075 zip code residents lived in the same house 1 year ago. Out of people who lived in different houses, 63% moved from this county. Out of people who lived in different houses, 30% moved from different state. Out of people who lived in different houses, 7% moved from abroad.
Private vs. public school enrollment:
Students in private schools in grades 1 to 8 (elementary and middle school):
Here:
0.0%
Georgia:
12.1%
Students in private schools in grades 9 to 12 (high school):
Here:
0.0%
Georgia:
10.8%
Students in private undergraduate colleges:
Here:
0.0%
Georgia:
17.1%
Occupation by median earnings in the past 12 months ($)
97,135Health diagnosing and treating practitioners and other technical occupations
60,530Community and social service occupations
49,753Business and financial operations occupations
49,204Production occupations
40,841Transportation occupations
38,228Healthcare support occupations
Top industries in this zip code by the number of employees in 2005:
Accommodation and Food Services: Full-Service Restaurants (20-49: 1)
Construction: Water and Sewer Line and Related Structures Construction (5-9: 1)
Other Services (except Public Administration): Religious Organizations (1-4: 2)
Administrative and Support and Waste Management and Remediation Services: Office Administrative Services (1-4: 1)
Construction: All Other Specialty Trade Contractors (1-4: 1)
Administrative and Support and Waste Management and Remediation Services: Landscaping Services (1-4: 1)
People in group quarters in 2010:
10 people in group homes intended for adults
Fatal accident statistics in 2012:
Fatal accident count: 2
Vehicles involved in fatal accidents: 4
Fatal accidents caused by drunken drivers: 1
Fatalities: 3
Persons involved in fatal accidents: 7
Pedestrians involved in fatal accidents: 0
Fatal accident statistics in 2011:
Fatal accident count: 1
Vehicles involved in fatal accidents: 2
Fatal accidents caused by drunken drivers: 0
Fatalities: 2
Persons involved in fatal accidents: 3
Pedestrians involved in fatal accidents: 0
2002 - 2018 National Fire Incident Reporting System (NFIRS) incidents
Based on the data from the years 2002 - 2018 the average number of fire incidents per year is 18. The highest number of reported fire incidents - 35 took place in 2004, and the least - 9 in 2009. The data has a growing trend.
When looking into fire subcategories, the most reports belonged to: Outside Fires (58.9%), and Structure Fires (22.1%).
Fire incident types reported to NFIRS in Zip Code 31075


 Nearest zip codes: 31009, 31019, 31021, 31012, 31022, 30454.


 Based on the data from the years 2002 - 2018 the average number of fire incidents per year is 18. The highest number of reported fire incidents - 35 took place in 2004, and the least - 9 in 2009. The data has a growing trend.
 When looking into fire subcategories, the most reports belonged to: Outside Fires (58.9%), and Structure Fires (22.1%).