Estimated zip code population in 2022: 4,270 Zip code population in 2010: 4,591 Zip code population in 2000: 4,396
Houses and condos: 2,169 Renter-occupied apartments: 1,046
% of renters here:
59%
State:
34%
March 2022 cost of living index in zip code 31301: 88.0 (less than average, U.S. average is 100)
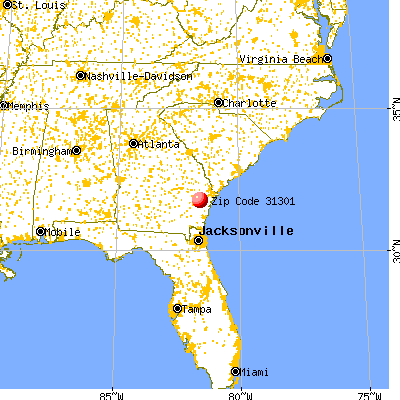
Land area: 11.8 sq. mi. Water area: 0.1 sq. mi.
Population density: 363 people per square mile
(very low).
OSM Map
General Map
Google Map
MSN Map
OSM Map
General Map
Google Map
MSN Map
OSM Map
General Map
Google Map
MSN Map
OSM Map
General Map
Google Map
MSN Map
Please wait while loading the map...
Real estate property taxes paid for housing units in 2022:
This zip code:
0.8% ($1,333)
Georgia:
0.7% ($2,160)
Median real estate property taxes paid for housing units with mortgages in 2022: $1,850 (1.1%) Median real estate property taxes paid for housing units with no mortgage in 2022: $1,031 (1.7%)
Business Search- 14 Million verified businesses
Males: 2,172
(50.9%)
Females: 2,097
(49.1%)
For population 25 years and over in 31301:
High school or higher: 90.8%
Bachelor's degree or higher: 19.2%
Graduate or professional degree: 7.2%
Unemployed: 2.1%
Mean travel time to work (commute): 24.9 minutes
For population 15 years and over in 31301:
Never married: 35.7%
Now married: 39.6%
Separated: 9.4%
Widowed: 2.5%
Divorced: 12.8%
Zip code 31301 compared to state average:
Median household income below state average.
Median house value below state average.
Unemployed percentage below state average.
Foreign-born population percentage significantly below state average.
Renting percentage above state average.
Length of stay since moving in significantly above state average.
House age below state average.
Percentage of population with a bachelor's degree or higher below state average.
Averages for the 2020 tax year for zip code 31301, filed in 2021:
Average Adjusted Gross Income (AGI) in 2020: $38,887 (Individual Income Tax Returns)
Here:
$38,887
State:
$70,847
Salary/wage: $34,697 (reported on 88.3% of returns)
Here:
$34,697
State:
$59,126
(% of AGI for various income ranges: 1219.0% for AGIs below $25k, 3702.0% for AGIs $25k-50k, 6592.6% for AGIs $50k-75k, 11118.6% for AGIs $75k-100k, 15903.3% for AGIs $100k-200k)
Taxable interest for individuals: $300 (reported on 11.7% of returns)
This zip code:
$300
Georgia:
$2,011
(% of AGI for various income ranges: 1.2% for AGIs below $25k, 4.3% for AGIs $25k-50k, 4.2% for AGIs $50k-75k, 14.3% for AGIs $75k-100k, 28.3% for AGIs $100k-200k)
Ordinary dividends: $1,325 (reported on 4.4% of returns)
Here:
$1,325
State:
$8,996
(% of AGI for various income ranges: 0.6% for AGIs below $25k, 3.2% for AGIs $50k-75k, 160.0% for AGIs $100k-200k)
Net capital gain/loss in AGI: +$2,225 (reported on 4.4% of returns)
Here:
+$2,225
State:
+$28,402
(% of AGI for various income ranges: 3.7% for AGIs $25k-50k, 230.0% for AGIs $75k-100k)
Profit/loss from business: +$1,841 (reported on 15.0% of returns)
Here:
+$1,841
State:
+$6,707
(% of AGI for various income ranges: 100.0% for AGIs below $25k, 227.1% for AGIs $75k-100k)
Taxable individual retirement arrangement distribution: $12,100 (reported on 2.2% of returns)
31301:
$12,100
Georgia:
$20,525
(% of AGI for various income ranges: 254.7% for AGIs $50k-75k)
Total itemized deductions: $23,730 (reported on 5.6% of returns)
Here:
$23,730
State:
$34,001
(% of AGI for various income ranges: 108.0% for AGIs $25k-50k, 252.1% for AGIs $50k-75k, 734.3% for AGIs $75k-100k, 1471.7% for AGIs $100k-200k)
Charity contributions: $10,422 (reported on 5.0% of returns)
Here:
$10,422
State:
$14,164
(% of AGI for various income ranges: 77.8% for AGIs $25k-50k, 320.0% for AGIs $75k-100k, 593.3% for AGIs $100k-200k)
Taxes paid: $5,620 (reported on 5.6% of returns)
31301:
$5,620
State:
$7,540
(% of AGI for various income ranges: 18.5% for AGIs $25k-50k, 59.5% for AGIs $50k-75k, 184.3% for AGIs $75k-100k, 391.7% for AGIs $100k-200k)
Earned income credit: $2,729 (reported on 34.4% of returns)
Here:
$2,729
State:
$2,530
(% of AGI for various income ranges: 167.6% for AGIs below $25k, 120.0% for AGIs $25k-50k)
Percentage of individuals using paid preparers for their 2020 taxes: 95.6%
Here:
96%
State:
93%
(% for various income ranges: 94.9% for AGIs below $25k, 96.4% for AGIs $25k-50k, 95.8% for AGIs $50k-75k, 91.7% for AGIs $75k-100k, 100.0% for AGIs $100k-200k)
Averages for the 2012 tax year for zip code 31301, filed in 2013:
Average Adjusted Gross Income (AGI) in 2012: $33,498 (Individual Income Tax Returns)
Here:
$33,498
State:
$56,131
Salary/wage: $31,613 (reported on 89.4% of returns)
Here:
$31,613
State:
$47,942
(% of AGI for various income ranges: 85.8% for AGIs below $25k, 92.3% for AGIs $25k-50k, 79.8% for AGIs $50k-75k, 73.8% for AGIs $75k-100k, 82.5% for AGIs $100k-200k)
Taxable interest for individuals: $278 (reported on 15.2% of returns)
This zip code:
$278
Georgia:
$1,706
(% of AGI for various income ranges: 0.2% for AGIs below $25k, 0.1% for AGIs $50k-75k, 0.2% for AGIs $100k-200k)
Ordinary dividends: $257 (reported on 4.6% of returns)
Here:
$257
State:
$7,265
(% of AGI for various income ranges: 0.1% for AGIs below $25k)
Net capital gain/loss in AGI: +$50 (reported on 2.6% of returns)
Here:
+$50
State:
+$16,323
Profit/loss from business: +$3,539 (reported on 15.2% of returns)
Here:
+$3,539
State:
+$7,583
(% of AGI for various income ranges: 9.4% for AGIs below $25k)
Taxable individual retirement arrangement distribution: $8,033 (reported on 2.0% of returns)
31301:
$8,033
Georgia:
$17,199
Total itemized deductions: $18,231 (28% of AGI, reported on 23.8% of returns)
Here:
$18,231
State:
$23,886
Here:
28.2% of AGI
State:
21.5% of AGI
(% of AGI for various income ranges: 4.7% for AGIs below $25k, 13.1% for AGIs $25k-50k, 15.3% for AGIs $50k-75k, 17.3% for AGIs $75k-100k, 16.8% for AGIs $100k-200k)
Charity contributions: $4,166 (reported on 19.2% of returns)
Here:
$4,166
State:
$5,507
(% of AGI for various income ranges: 0.7% for AGIs below $25k, 2.3% for AGIs $25k-50k, 2.2% for AGIs $50k-75k, 3.4% for AGIs $75k-100k, 3.8% for AGIs $100k-200k)
Taxes paid: $5,067 (reported on 23.8% of returns)
31301:
$5,067
State:
$7,838
(% of AGI for various income ranges: 0.7% for AGIs below $25k, 3.3% for AGIs $25k-50k, 3.8% for AGIs $50k-75k, 4.9% for AGIs $75k-100k, 6.3% for AGIs $100k-200k)
Earned income credit: $2,895 (reported on 41.7% of returns)
Here:
$2,895
State:
$2,589
(% of AGI for various income ranges: 14.0% for AGIs below $25k, 2.3% for AGIs $25k-50k)
Percentage of individuals using paid preparers for their 2012 taxes: 52.3%
Here:
52%
State:
55%
(% for various income ranges: 51.2% for AGIs below $25k, 48.8% for AGIs $25k-50k, 60.0% for AGIs $50k-75k, 57.1% for AGIs $75k-100k, 62.5% for AGIs $100k-200k)
Averages for the 2004 tax year for zip code 31301, filed in 2005:
Average Adjusted Gross Income (AGI) in 2004: $29,678 (Individual Income Tax Returns)
Here:
$29,678
State:
$47,553
Salary/wage: $28,139 (reported on 94.4% of returns)
Here:
$28,139
State:
$42,178
(% of AGI for various income ranges: 103.3% for AGIs below $10k, 93.7% for AGIs $10k-25k, 91.8% for AGIs $25k-50k, 88.7% for AGIs $50k-75k, 86.1% for AGIs $75k-100k, 68.7% for AGIs over 100k)
Taxable interest for individuals: $341 (reported on 15.9% of returns)
This zip code:
$341
Georgia:
$1,772
(% of AGI for various income ranges: 0.6% for AGIs below $10k, 0.1% for AGIs $10k-25k, 0.2% for AGIs $25k-50k, 0.2% for AGIs $50k-75k, 0.2% for AGIs $75k-100k, 0.2% for AGIs over 100k)
Taxable dividends: $165 (reported on 5.9% of returns)
Here:
$165
State:
$4,283
(% of AGI for various income ranges: 0.0% for AGIs $10k-25k, 0.0% for AGIs $25k-50k, 0.0% for AGIs $50k-75k, 0.0% for AGIs $75k-100k, 0.1% for AGIs over 100k)
Net capital gain/loss: +$5,870 (reported on 3.2% of returns)
Here:
+$5,870
State:
+$16,461
Profit/loss from business: +$165 (reported on 8.0% of returns)
Here:
+$165
State:
+$8,201
(% of AGI for various income ranges: -8.4% for AGIs below $10k, 1.4% for AGIs $10k-25k, 0.1% for AGIs $25k-50k, -0.2% for AGIs $50k-75k, 0.4% for AGIs $75k-100k)
IRA payment deduction: $1,364 (reported on 0.8% of returns)
31301:
$1,364
Georgia:
$2,969
Total itemized deductions: $16,429 (31% of AGI, reported on 25.2% of returns)
Here:
$16,429
State:
$19,944
Here:
30.5% of AGI
State:
22.6% of AGI
(% of AGI for various income ranges: 6.0% for AGIs $10k-25k, 14.8% for AGIs $25k-50k, 18.3% for AGIs $50k-75k, 20.0% for AGIs $75k-100k, 16.0% for AGIs over 100k)
Charity contributions deductions: $3,522 (6% of AGI, reported on 22.2% of returns)
Here:
$3,522
State:
$4,354
Here:
6.4% of AGI
State:
4.7% of AGI
(% of AGI for various income ranges: 1.0% for AGIs $10k-25k, 2.6% for AGIs $25k-50k, 3.6% for AGIs $50k-75k, 3.9% for AGIs $75k-100k, 3.7% for AGIs over 100k)
Total tax: $2,920 (reported on 58.2% of returns)
31301:
$2,920
State:
$8,223
(% of AGI for various income ranges: 2.0% for AGIs below $10k, 2.4% for AGIs $10k-25k, 4.2% for AGIs $25k-50k, 6.9% for AGIs $50k-75k, 9.3% for AGIs $75k-100k, 14.7% for AGIs over 100k)
Earned income credit: $2,107 (reported on 36.4% of returns)
Here:
$2,107
State:
$1,986
Percentage of individuals using paid preparers for their 2004 taxes: 69.0%
Here:
69%
State:
62%
(% for various income ranges: 63.4% for AGIs below $10k, 71.4% for AGIs $10k-25k, 72.2% for AGIs $25k-50k, 64.5% for AGIs $50k-75k, 74.5% for AGIs $75k-100k, 47.8% for AGIs over 100k)
Likely homosexual households (counted as self-reported same-sex unmarried-partner households)
Lesbian couples: 0.5% of all households
Gay men: 0.7% of all households
Household received Food Stamps/SNAP in the past 12 months: 272 Household did not receive Food Stamps/SNAP in the past 12 months: 1,508
Women who had a birth in the past 12 months: 24 (5 now married, 19 unmarried) Women who did not have a birth in the past 12 months: 987 (366 now married, 620 unmarried)
Housing units in zip code 31301 with a mortgage: 398 (9 second mortgage, 10 both second mortgage and home equity loan) Median monthly owner costs for units with a mortgage: $1,212 Median monthly owner costs for units without a mortgage: $456
Residents with income below the poverty level in 2022:
This zip code:
19.7%
Whole state:
12.7%
Residents with income below 50% of the poverty level in 2022:
This zip code:
15.0%
Whole state:
6.3%
Median number of rooms in houses and condos:
Here:
6.3
State:
6.8
Median number of rooms in apartments:
Here:
4.7
State:
4.6
Notable locations in this zip code not listed on our city pages
Churches in zip code 31301 include: Friendship Church (A), Pillar in Zion Apostolic Church (B), Baconton Missionary Baptist Church (C), Walthourville Presbyterian Church (D), Walthourville Baptist Church (E), Victory Church (F), Pleasant Hill Church (G), Walthourville Church (H), Bacon Church (I). Display/hide their locations on the map
544 married couples with children.
382 single-parent households (28 men, 354 women).
95.0% of residents of 31301 zip code speak English at home.
1.9% of residents speak Spanish at home (96% very well, 4% well).
0.5% of residents speak other Indo-European language at home (38% very well, 62% well).
1.3% of residents speak Asian or Pacific Island language at home (100% very well).
0.4% of residents speak other language at home (24% very well, 76% not well).
Foreign born population: 186 (4.4%) (41.2% of them are naturalized citizens)
This zip code:
4.4%
Whole state:
10.7%
36%Malaysia
21%France
18%Bahamas
7%Sweden
4%Japan
3%Grenada
2%Greece
14%American
4%German
4%Irish
3%English
2%African
1%Barbadian
1%Italian
Year of entry for the foreign-born population
242010 or later
442000 to 2009
1511990 to 1999
93Before 1990
Facilities with environmental interests located in this zip code:
MOBILE CONCRETE INC (DUNLEVIE ROAD in ALLENHURST, GA)
AIR MINOR (AIRS/AFS) Business SIC classification: READY-MIXED CONCRETE
Housing units lacking complete plumbing facilities: 2.1% Housing units lacking complete kitchen facilities: 2.7%
93.1%Electricity
4.1%Utility gas
1.7%No fuel used
1.3%Bottled, tank, or LP gas
Population in 1990: 3,075. Population change in the 1990s: +1,321 (+43.0%).
Place of birth for U.S.-born residents:
This state: 1,933
Northeast: 295
Midwest: 119
South: 1,230
West: 371
31% of the 31301 zip code residents lived in the same house 5 years ago. Out of people who lived in different houses, 23% lived in this county. Out of people who lived in different counties, 50% lived in Georgia.
83% of the 31301 zip code residents lived in the same house 1 year ago. Out of people who lived in different houses, 7% moved from this county. Out of people who lived in different houses, 52% moved from different county within same state. Out of people who lived in different houses, 40% moved from different state. Out of people who lived in different houses, 7% moved from abroad.
Private vs. public school enrollment:
Students in private schools in grades 1 to 8 (elementary and middle school): 79
Here:
15.8%
Georgia:
12.1%
Students in private schools in grades 9 to 12 (high school): 22
Here:
6.5%
Georgia:
10.8%
Students in private undergraduate colleges: 3
Here:
2.3%
Georgia:
17.1%
Occupation by median earnings in the past 12 months ($)
141,682Business and financial operations occupations
126,288Health diagnosing and treating practitioners and other technical occupations
70,523Education, training, and library occupations
65,186Health technologists and technicians
50,766Management occupations
47,737Construction and extraction occupations
Companies with federal contracts located in this zip code (ALLENHURST, GA):
RELAFORD CONSTRUCTION INC (88 CATO LN; small business) : $18,017,285 in 218 contractsfrom 2000 to 2006
Contracts for Maintenance, Repair or Alteration of Real Property -- Highways, Roads, Streets, Bridges, and Railways (includes resurfacing), Construction of Structures and Facilities -- Maintenance Buildings, Maintenance, Repair or Alteration of Real Property -- Other Non-Building Facilities, Construction of Structures and Facilities -- Miscellaneous Buildings, and moreby Army, Navy Signed by year:2000: $4,943,612; 2001: $2,541,393; 2002: $2,909,416; 2003: $2,370,625; 2004: $3,935,228; 2005: $1,200,986; 2006: $116,025.
Biggest contracts:
$2,912,342 with Army for Maintenance, Repair or Alteration of Real Property -- Highways, Roads, Streets, Bridges, and Railways (includes resurfacing). Taking place in TX. Signed on 2000-09-28. Completion date: 2001-08-07.
$2,600,025 with Army for Maintenance, Repair or Alteration of Real Property -- Highways, Roads, Streets, Bridges, and Railways (includes resurfacing). Taking place in NC. Signed on 2004-05-13. Completion date: 2004-12-31.
$2,388,021 with Army for Construction of Structures and Facilities -- Maintenance Buildings. Taking place in NC. Signed on 2001-09-29. Completion date: 2002-11-29.
$1,215,957 with Army for Maintenance, Repair or Alteration of Real Property -- Other Non-Building Facilities. Signed on 2000-09-29. Completion date: 2002-02-08.
WATERS, DENNIS RENTAL PROPERTI (565 DUNLEVIE RD; small business) : $1,793,652 in 4 contractsfrom 2002 to 2005
$539,288 with Army for Motor Pool Operations. Signed on 2004-04-30. Completion date: 2003-09-09.
$539,287, same as above.Signed on 2005-06-16. Completion date: 2003-09-09.
$531,000, same as above.Signed on 2002-08-29. Completion date: 2003-08-31.
$184,077, same as above.Signed on 2003-09-08. Completion date: 2003-09-09.
AMERICAN FENCE (R R 2 BOX 85 A TIBET RD; small business) : $54,850 in 7 contractsfrom 2000 to 2006
Contracts for Maintenance, Repair or Alteration of Real Property -- Other Non-Building Facilities, Maintenance, Repair or Alteration of Real Property -- Other Administrative Facilities and Service Buildings, Miscellaneous Items, Fencing, Fences, Gates and Components, and moreby Army Signed by year:2000: $19,700; 2001: $5,450; 2002: $3,700; 2003: $20,000; 2004: $0; 2005: $0; 2006: $6,000.
Biggest contracts:
$19,700 with Army for Maintenance, Repair or Alteration of Real Property -- Other Non-Building Facilities. Signed on 2000-05-02. Completion date: 2000-07-17.
$10,500 with Army for Maintenance, Repair or Alteration of Real Property -- Other Administrative Facilities and Service Buildings. Signed on 2003-09-02. Completion date: 2003-10-16.
$9,500 with Army for Miscellaneous Items. Signed on 2003-06-26. Completion date: 2003-07-24.
$6,000 with Army for Fencing, Fences, Gates and Components. Signed on 2006-06-16. Completion date: 2006-12-29.
L C WILLIAMS (312 TIBET RD; small business) : $52,334 in 5 contractsfrom 2003 to 2006
Contracts for Other Education and Training Services by Army Signed by year:2000: $0; 2001: $0; 2002: $0; 2003: $4,160; 2004: $48,160; 2005: $0; 2006: $14.
Biggest contracts:
$28,112 with Army for Other Education and Training Services. Signed on 2004-12-02. Completion date: 2005-11-30.
$20,048, same as above.Signed on 2004-01-22. Completion date: 2004-09-30.
$4,160, same as above.Signed on 2003-03-06. Completion date: 2003-06-01.
$14, same as above.Signed on 2006-04-17. Completion date: 2006-11-30.
KINSLOW, JACKIE (439 MCCUMBER DR; small business) : $46,362 in 5 contractsfrom 2003 to 2005
Contracts for Landscaping/Groundskeeping Services by Army Signed by year:2000: $0; 2001: $0; 2002: $0; 2003: $7,206; 2004: $10,417; 2005: $28,739; 2006: $0.
Biggest contracts:
$19,574 with Army for Landscaping/Groundskeeping Services. Signed on 2005-03-23. Completion date: 2006-03-31.
$9,593, same as above.Signed on 2004-05-26. Completion date: 2004-04-30.
$9,165, same as above.Signed on 2005-04-27. Completion date: 2004-04-30.
$7,206, same as above.Signed on 2003-05-08. Completion date: 2004-04-30.
JOHN R OSMANSKI (WILLIAMSON RD; small business) : $14 in 2 contractsin 2006
$14 with Army for Other Education and Training Services. Signed on 2006-04-07. Completion date: 2006-09-30.
$0, same as above.Signed on 2006-04-07. Completion date: 2006-09-30.
RANDY L KNOX (580 MC CUMBER DRIVE; small business)
-$19,683 with Army for Other Professional Services. Signed on 2005-04-06. Completion date: 2005-09-30.
Top industries in this zip code by the number of employees in 2005:
Real Estate and Rental and Leasing: Residential Property Managers (20-49 employees: 1 establishment)
Construction: Land Subdivision (10-19: 1)
Construction: New Single-Family Housing Construction (except Operative Builders) (10-19: 1)
Construction: Commercial and Institutional Building Construction (10-19: 1)
Construction: All Other Specialty Trade Contractors (5-9: 1, 1-4: 1)
Construction: Residential Remodelers (5-9: 1)
Other Services (except Public Administration): Automotive Body, Paint, and Interior Repair and Maintenance (5-9: 1)
Fatal accident statistics in 2014:
Fatal accident count: 1
Vehicles involved in fatal accidents: 1
Fatal accidents caused by drunken drivers: 1
Fatalities: 1
Persons involved in fatal accidents: 1
Pedestrians involved in fatal accidents: 0
Fatal accident statistics in 2012:
Fatal accident count: 1
Vehicles involved in fatal accidents: 1
Fatal accidents caused by drunken drivers: 1
Fatalities: 1
Persons involved in fatal accidents: 1
Pedestrians involved in fatal accidents: 0
Home Mortgage Disclosure Act Aggregated Statistics For Year 2009 (Based on 4 partial tracts)
A) FHA, FSA/RHS & VA Home Purchase Loans
B) Conventional Home Purchase Loans
C) Refinancings
D) Home Improvement Loans
F) Non-occupant Loans on < 5 Family Dwellings (A B C & D)
G) Loans On Manufactured Home Dwelling (A B C & D)
Number
Average Value
Number
Average Value
Number
Average Value
Number
Average Value
Number
Average Value
Number
Average Value
LOANS ORIGINATED
31
$142,489
11
$85,663
104
$117,806
20
$31,270
42
$83,406
34
$57,797
APPLICATIONS APPROVED, NOT ACCEPTED
0
$0
1
$22,490
6
$98,510
3
$78,980
0
$0
3
$19,993
APPLICATIONS DENIED
8
$117,532
3
$33,757
34
$148,977
16
$51,993
3
$39,823
3
$26,760
APPLICATIONS WITHDRAWN
9
$126,539
3
$61,483
25
$134,434
1
$48,750
1
$20,770
0
$0
FILES CLOSED FOR INCOMPLETENESS
0
$0
1
$142,460
4
$151,012
0
$0
1
$142,460
0
$0
Aggregated Statistics For Year 2008 (Based on 4 partial tracts)
A) FHA, FSA/RHS & VA Home Purchase Loans
B) Conventional Home Purchase Loans
C) Refinancings
D) Home Improvement Loans
F) Non-occupant Loans on < 5 Family Dwellings (A B C & D)
G) Loans On Manufactured Home Dwelling (A B C & D)
Number
Average Value
Number
Average Value
Number
Average Value
Number
Average Value
Number
Average Value
Number
Average Value
LOANS ORIGINATED
47
$142,785
29
$108,872
85
$113,437
20
$72,788
51
$131,899
43
$111,739
APPLICATIONS APPROVED, NOT ACCEPTED
0
$0
5
$61,416
11
$66,655
2
$29,485
0
$0
6
$46,488
APPLICATIONS DENIED
5
$123,004
6
$72,372
58
$124,393
23
$62,906
13
$70,048
14
$78,314
APPLICATIONS WITHDRAWN
9
$129,827
1
$115,860
20
$106,860
0
$0
1
$50,930
0
$0
FILES CLOSED FOR INCOMPLETENESS
1
$108,430
0
$0
4
$153,152
0
$0
0
$0
0
$0
Aggregated Statistics For Year 2007 (Based on 4 partial tracts)
A) FHA, FSA/RHS & VA Home Purchase Loans
B) Conventional Home Purchase Loans
C) Refinancings
D) Home Improvement Loans
E) Loans on Dwellings For 5+ Families
F) Non-occupant Loans on < 5 Family Dwellings (A B C & D)
G) Loans On Manufactured Home Dwelling (A B C & D)
Number
Average Value
Number
Average Value
Number
Average Value
Number
Average Value
Number
Average Value
Number
Average Value
Number
Average Value
LOANS ORIGINATED
42
$127,566
31
$80,340
81
$111,315
35
$34,983
8
$222,172
46
$53,245
28
$35,786
APPLICATIONS APPROVED, NOT ACCEPTED
2
$93,125
1
$87,000
11
$83,866
2
$20,460
0
$0
1
$80,010
0
$0
APPLICATIONS DENIED
6
$107,782
9
$90,908
69
$108,453
24
$61,846
0
$0
11
$88,165
9
$58,987
APPLICATIONS WITHDRAWN
6
$104,728
4
$140,360
30
$111,480
2
$131,380
0
$0
2
$48,230
3
$56,483
FILES CLOSED FOR INCOMPLETENESS
3
$88,477
2
$61,685
7
$99,731
1
$22,950
0
$0
1
$55,740
1
$113,970
Aggregated Statistics For Year 2006 (Based on 4 partial tracts)
A) FHA, FSA/RHS & VA Home Purchase Loans
B) Conventional Home Purchase Loans
C) Refinancings
D) Home Improvement Loans
E) Loans on Dwellings For 5+ Families
F) Non-occupant Loans on < 5 Family Dwellings (A B C & D)
G) Loans On Manufactured Home Dwelling (A B C & D)
Number
Average Value
Number
Average Value
Number
Average Value
Number
Average Value
Number
Average Value
Number
Average Value
Number
Average Value
LOANS ORIGINATED
76
$121,177
44
$81,592
94
$77,215
38
$30,583
3
$324,067
35
$67,338
28
$42,769
APPLICATIONS APPROVED, NOT ACCEPTED
5
$109,652
9
$55,677
9
$76,537
5
$18,410
1
$314,920
5
$37,810
5
$56,664
APPLICATIONS DENIED
0
$0
19
$92,849
77
$109,624
34
$35,340
0
$0
3
$65,297
5
$30,120
APPLICATIONS WITHDRAWN
5
$112,696
10
$92,586
48
$112,832
9
$59,430
0
$0
1
$124,820
3
$99,637
FILES CLOSED FOR INCOMPLETENESS
0
$0
3
$57,840
12
$100,051
0
$0
0
$0
0
$0
0
$0
Aggregated Statistics For Year 2005 (Based on 4 partial tracts)
A) FHA, FSA/RHS & VA Home Purchase Loans
B) Conventional Home Purchase Loans
C) Refinancings
D) Home Improvement Loans
F) Non-occupant Loans on < 5 Family Dwellings (A B C & D)
G) Loans On Manufactured Home Dwelling (A B C & D)
Number
Average Value
Number
Average Value
Number
Average Value
Number
Average Value
Number
Average Value
Number
Average Value
LOANS ORIGINATED
42
$123,695
58
$91,067
88
$76,896
26
$17,184
45
$63,070
23
$54,112
APPLICATIONS APPROVED, NOT ACCEPTED
6
$143,425
11
$62,347
10
$97,618
2
$80,525
0
$0
3
$46,660
APPLICATIONS DENIED
3
$83,053
23
$61,477
68
$95,170
35
$39,004
8
$39,540
19
$42,428
APPLICATIONS WITHDRAWN
5
$124,014
21
$100,699
56
$93,294
8
$67,226
7
$88,764
3
$60,483
FILES CLOSED FOR INCOMPLETENESS
0
$0
2
$60,660
23
$116,843
0
$0
3
$96,473
0
$0
Aggregated Statistics For Year 2004 (Based on 4 partial tracts)
A) FHA, FSA/RHS & VA Home Purchase Loans
B) Conventional Home Purchase Loans
C) Refinancings
D) Home Improvement Loans
F) Non-occupant Loans on < 5 Family Dwellings (A B C & D)
G) Loans On Manufactured Home Dwelling (A B C & D)
Detailed PMIC statistics for the following Tracts:0102.04
, 0104.00
2002 - 2018 National Fire Incident Reporting System (NFIRS) incidents
Based on the data from the years 2002 - 2018 the average number of fire incidents per year is 6. The highest number of reported fire incidents - 19 took place in 2017, and the least - 0 in 2004. The data has a growing trend.
When looking into fire subcategories, the most reports belonged to: Outside Fires (46.5%), and Structure Fires (43.6%).
Fire incident types reported to NFIRS in Zip Code 31301


 Nearest zip codes: 31313, 31314, 31316, 31315, 31323, 31309.


 Based on the data from the years 2002 - 2018 the average number of fire incidents per year is 6. The highest number of reported fire incidents - 19 took place in 2017, and the least - 0 in 2004. The data has a growing trend.
 When looking into fire subcategories, the most reports belonged to: Outside Fires (46.5%), and Structure Fires (43.6%).