Estimated zip code population in 2022: 5,031 Zip code population in 2010: 5,041 Zip code population in 2000: 5,020
Houses and condos: 2,364 Renter-occupied apartments: 337
% of renters here:
16%
State:
30%
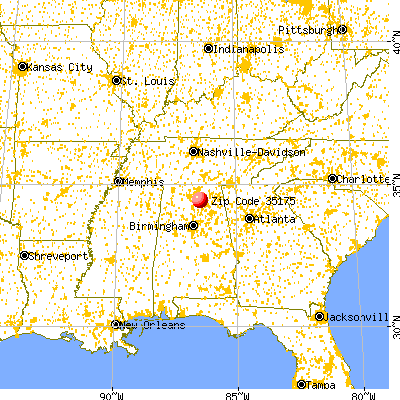
March 2022 cost of living index in zip code 35175: 81.4 (low, U.S. average is 100)
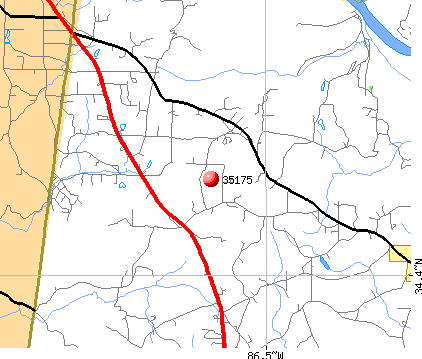
Land area: 63.7 sq. mi. Water area: 1.7 sq. mi.
Population density: 79 people per square mile
(very low).
OSM Map
General Map
Google Map
MSN Map
OSM Map
General Map
Google Map
MSN Map
OSM Map
General Map
Google Map
MSN Map
OSM Map
General Map
Google Map
MSN Map
Please wait while loading the map...
Real estate property taxes paid for housing units in 2022:
This zip code:
0.3% ($628)
Alabama:
0.4% ($718)
Median real estate property taxes paid for housing units with mortgages in 2022: $913 (0.3%) Median real estate property taxes paid for housing units with no mortgage in 2022: $458 (0.3%)
Business Search- 14 Million verified businesses
Males: 2,443
(48.6%)
Females: 2,588
(51.4%)
For population 25 years and over in 35175:
High school or higher: 91.0%
Bachelor's degree or higher: 25.3%
Graduate or professional degree: 11.6%
Unemployed: 3.7%
Mean travel time to work (commute): 26.9 minutes
For population 15 years and over in 35175:
Never married: 19.3%
Now married: 54.6%
Separated: 1.2%
Widowed: 8.9%
Divorced: 16.1%
Zip code 35175 compared to state average:
Black race population percentage significantly below state average.
Median age significantly above state average.
Foreign-born population percentage significantly below state average.
Renting percentage below state average.
Length of stay since moving in significantly above state average.
Averages for the 2020 tax year for zip code 35175, filed in 2021:
Average Adjusted Gross Income (AGI) in 2020: $63,630 (Individual Income Tax Returns)
Here:
$63,630
State:
$63,984
Salary/wage: $56,665 (reported on 78.4% of returns)
Here:
$56,665
State:
$52,834
(% of AGI for various income ranges: 1015.1% for AGIs below $25k, 3583.0% for AGIs $25k-50k, 6420.0% for AGIs $50k-75k, 9834.0% for AGIs $75k-100k, 16959.5% for AGIs $100k-200k, 49996.7% for AGIs over 200k)
Taxable interest for individuals: $1,688 (reported on 32.6% of returns)
This zip code:
$1,688
Alabama:
$1,615
(% of AGI for various income ranges: 20.2% for AGIs below $25k, 28.6% for AGIs $25k-50k, 45.6% for AGIs $50k-75k, 49.3% for AGIs $75k-100k, 147.5% for AGIs $100k-200k, 1776.7% for AGIs over 200k)
Ordinary dividends: $4,925 (reported on 14.1% of returns)
Here:
$4,925
State:
$7,660
(% of AGI for various income ranges: 16.6% for AGIs below $25k, 22.5% for AGIs $25k-50k, 66.4% for AGIs $50k-75k, 77.3% for AGIs $75k-100k, 180.0% for AGIs $100k-200k, 2490.0% for AGIs over 200k)
Net capital gain/loss in AGI: +$15,910 (reported on 12.8% of returns)
Here:
+$15,910
State:
+$23,528
(% of AGI for various income ranges: 12.6% for AGIs below $25k, 17.7% for AGIs $25k-50k, 103.6% for AGIs $50k-75k, 237.3% for AGIs $75k-100k, 402.0% for AGIs $100k-200k, 10166.7% for AGIs over 200k)
Profit/loss from business: +$10,691 (reported on 15.4% of returns)
Here:
+$10,691
State:
+$9,534
(% of AGI for various income ranges: 194.2% for AGIs below $25k, 90.2% for AGIs $25k-50k, 266.0% for AGIs $50k-75k, 132.0% for AGIs $75k-100k, 502.5% for AGIs $100k-200k, 1493.3% for AGIs over 200k)
Taxable individual retirement arrangement distribution: $14,339 (reported on 10.1% of returns)
35175:
$14,339
Alabama:
$19,004
(% of AGI for various income ranges: 47.9% for AGIs below $25k, 109.1% for AGIs $25k-50k, 231.2% for AGIs $50k-75k, 222.7% for AGIs $75k-100k, 826.0% for AGIs $100k-200k)
Total itemized deductions: $31,367 (reported on 5.3% of returns)
Here:
$31,367
State:
$37,338
(% of AGI for various income ranges: 369.6% for AGIs $50k-75k, 727.0% for AGIs $100k-200k, 4620.0% for AGIs over 200k)
Charity contributions: $13,618 (reported on 4.8% of returns)
Here:
$13,618
State:
$18,005
(% of AGI for various income ranges: 48.2% for AGIs $25k-50k, 256.0% for AGIs $100k-200k, 2580.0% for AGIs over 200k)
Taxes paid: $6,400 (reported on 5.3% of returns)
35175:
$6,400
State:
$6,484
(% of AGI for various income ranges: 48.8% for AGIs $50k-75k, 167.5% for AGIs $100k-200k, 1036.7% for AGIs over 200k)
Earned income credit: $2,186 (reported on 16.3% of returns)
Here:
$2,186
State:
$2,628
(% of AGI for various income ranges: 90.9% for AGIs below $25k, 74.3% for AGIs $25k-50k)
Percentage of individuals using paid preparers for their 2020 taxes: 93.4%
Here:
93%
State:
93%
(% for various income ranges: 91.7% for AGIs below $25k, 92.9% for AGIs $25k-50k, 94.3% for AGIs $50k-75k, 100.0% for AGIs $75k-100k, 94.3% for AGIs $100k-200k, 85.7% for AGIs over 200k)
Averages for the 2012 tax year for zip code 35175, filed in 2013:
Average Adjusted Gross Income (AGI) in 2012: $55,245 (Individual Income Tax Returns)
Here:
$55,245
State:
$52,001
Salary/wage: $46,188 (reported on 80.3% of returns)
Here:
$46,188
State:
$43,822
(% of AGI for various income ranges: 67.8% for AGIs below $25k, 74.3% for AGIs $25k-50k, 78.3% for AGIs $50k-75k, 74.9% for AGIs $75k-100k, 74.2% for AGIs $100k-200k, 35.7% for AGIs over 200k)
Taxable interest for individuals: $1,717 (reported on 33.3% of returns)
This zip code:
$1,717
Alabama:
$1,592
(% of AGI for various income ranges: 1.4% for AGIs below $25k, 0.8% for AGIs $25k-50k, 0.9% for AGIs $50k-75k, 0.6% for AGIs $75k-100k, 1.1% for AGIs $100k-200k, 1.5% for AGIs over 200k)
Ordinary dividends: $3,713 (reported on 14.6% of returns)
Here:
$3,713
State:
$5,697
(% of AGI for various income ranges: 0.7% for AGIs below $25k, 0.6% for AGIs $25k-50k, 0.2% for AGIs $50k-75k, 0.7% for AGIs $75k-100k, 0.9% for AGIs $100k-200k, 2.5% for AGIs over 200k)
Net capital gain/loss in AGI: +$9,759 (reported on 10.3% of returns)
Here:
+$9,759
State:
+$13,286
(% of AGI for various income ranges: 0.2% for AGIs $25k-50k, 0.4% for AGIs $50k-75k, 1.6% for AGIs $100k-200k, 7.3% for AGIs over 200k)
Profit/loss from business: +$9,244 (reported on 16.0% of returns)
Here:
+$9,244
State:
+$9,151
(% of AGI for various income ranges: 9.8% for AGIs below $25k, 3.8% for AGIs $25k-50k, 1.1% for AGIs $50k-75k, 1.2% for AGIs $75k-100k, 3.3% for AGIs $100k-200k)
Taxable individual retirement arrangement distribution: $13,109 (reported on 10.8% of returns)
35175:
$13,109
Alabama:
$14,992
(% of AGI for various income ranges: 3.0% for AGIs below $25k, 2.6% for AGIs $25k-50k, 2.6% for AGIs $50k-75k, 3.6% for AGIs $75k-100k, 3.8% for AGIs $100k-200k)
Total itemized deductions: $20,017 (18% of AGI, reported on 24.9% of returns)
Here:
$20,017
State:
$21,388
Here:
18.1% of AGI
State:
20.1% of AGI
(% of AGI for various income ranges: 5.7% for AGIs below $25k, 10.7% for AGIs $25k-50k, 7.7% for AGIs $50k-75k, 9.4% for AGIs $75k-100k, 11.3% for AGIs $100k-200k, 7.0% for AGIs over 200k)
Charity contributions: $5,366 (reported on 22.1% of returns)
Here:
$5,366
State:
$5,925
(% of AGI for various income ranges: 0.5% for AGIs below $25k, 1.8% for AGIs $25k-50k, 1.6% for AGIs $50k-75k, 2.1% for AGIs $75k-100k, 3.3% for AGIs $100k-200k, 2.3% for AGIs over 200k)
Taxes paid: $4,623 (reported on 24.9% of returns)
35175:
$4,623
State:
$5,272
(% of AGI for various income ranges: 0.5% for AGIs below $25k, 1.4% for AGIs $25k-50k, 1.5% for AGIs $50k-75k, 2.1% for AGIs $75k-100k, 2.9% for AGIs $100k-200k, 2.8% for AGIs over 200k)
Earned income credit: $2,288 (reported on 19.2% of returns)
Here:
$2,288
State:
$2,646
(% of AGI for various income ranges: 6.7% for AGIs below $25k, 1.2% for AGIs $25k-50k)
Percentage of individuals using paid preparers for their 2012 taxes: 62.4%
Here:
62%
State:
60%
(% for various income ranges: 58.0% for AGIs below $25k, 67.9% for AGIs $25k-50k, 65.6% for AGIs $50k-75k, 72.2% for AGIs $75k-100k, 50.0% for AGIs $100k-200k, 75.0% for AGIs over 200k)
Averages for the 2004 tax year for zip code 35175, filed in 2005:
Average Adjusted Gross Income (AGI) in 2004: $43,153 (Individual Income Tax Returns)
Here:
$43,153
State:
$42,302
Salary/wage: $39,482 (reported on 83.0% of returns)
Here:
$39,482
State:
$36,626
(% of AGI for various income ranges: 115.1% for AGIs below $10k, 73.8% for AGIs $10k-25k, 79.3% for AGIs $25k-50k, 81.6% for AGIs $50k-75k, 87.3% for AGIs $75k-100k, 62.5% for AGIs over 100k)
Taxable interest for individuals: $1,147 (reported on 41.6% of returns)
This zip code:
$1,147
Alabama:
$1,827
(% of AGI for various income ranges: 6.3% for AGIs below $10k, 1.2% for AGIs $10k-25k, 1.1% for AGIs $25k-50k, 1.3% for AGIs $50k-75k, 1.0% for AGIs $75k-100k, 0.8% for AGIs over 100k)
Taxable dividends: $2,373 (reported on 16.9% of returns)
Here:
$2,373
State:
$4,206
(% of AGI for various income ranges: 1.3% for AGIs below $10k, 0.4% for AGIs $10k-25k, 0.4% for AGIs $25k-50k, 0.2% for AGIs $50k-75k, 0.3% for AGIs $75k-100k, 2.3% for AGIs over 100k)
Net capital gain/loss: +$3,000 (reported on 11.9% of returns)
Here:
+$3,000
State:
+$13,031
(% of AGI for various income ranges: -0.9% for AGIs below $10k, 0.4% for AGIs $10k-25k, -0.1% for AGIs $25k-50k, 0.1% for AGIs $50k-75k, 0.9% for AGIs $75k-100k, 2.2% for AGIs over 100k)
Profit/loss from business: +$6,324 (reported on 17.8% of returns)
Here:
+$6,324
State:
+$8,302
(% of AGI for various income ranges: 21.1% for AGIs below $10k, 7.3% for AGIs $10k-25k, 3.6% for AGIs $25k-50k, 1.9% for AGIs $50k-75k, -0.3% for AGIs $75k-100k, 1.5% for AGIs over 100k)
IRA payment deduction: $3,778 (reported on 1.7% of returns)
35175:
$3,778
Alabama:
$3,006
Total itemized deductions: $16,400 (19% of AGI, reported on 24.9% of returns)
Here:
$16,400
State:
$17,623
Here:
18.7% of AGI
State:
20.8% of AGI
(% of AGI for various income ranges: 4.3% for AGIs $10k-25k, 8.4% for AGIs $25k-50k, 10.3% for AGIs $50k-75k, 11.4% for AGIs $75k-100k, 10.9% for AGIs over 100k)
Charity contributions deductions: $4,055 (4% of AGI, reported on 22.6% of returns)
Here:
$4,055
State:
$4,768
Here:
4.5% of AGI
State:
5.4% of AGI
(% of AGI for various income ranges: 0.8% for AGIs $10k-25k, 1.5% for AGIs $25k-50k, 2.2% for AGIs $50k-75k, 2.8% for AGIs $75k-100k, 2.7% for AGIs over 100k)
Total tax: $6,354 (reported on 76.2% of returns)
35175:
$6,354
State:
$6,905
(% of AGI for various income ranges: 6.9% for AGIs below $10k, 3.8% for AGIs $10k-25k, 6.3% for AGIs $25k-50k, 8.7% for AGIs $50k-75k, 10.9% for AGIs $75k-100k, 19.3% for AGIs over 100k)
Earned income credit: $1,840 (reported on 19.1% of returns)
Here:
$1,840
State:
$2,048
Percentage of individuals using paid preparers for their 2004 taxes: 66.5%
Here:
66%
State:
65%
(% for various income ranges: 61.9% for AGIs below $10k, 68.7% for AGIs $10k-25k, 70.3% for AGIs $25k-50k, 67.0% for AGIs $50k-75k, 63.9% for AGIs $75k-100k, 58.8% for AGIs over 100k)
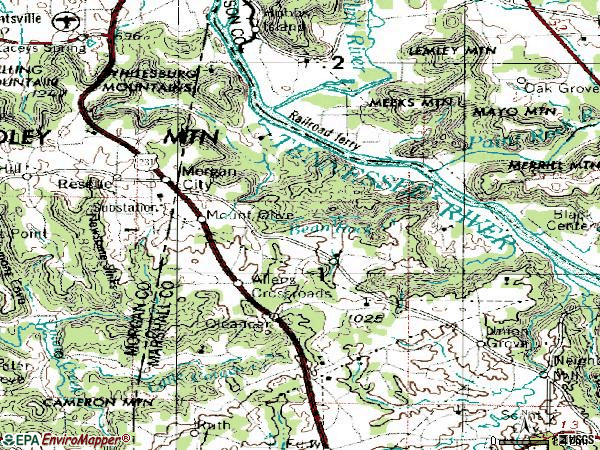
Notable locations in zip code 35175: Rescue (A), Ferguson Farms (B), Burden-Childers Farms (C), Bean Rock (D), Union Chapel Community Center (E), Union Grove Volunteer Fire Department (F), Brindlee Mountain Volunteer Fire Department Station 1 (G), Brindlee Mountain Volunteer Fire Department Station 3 (H), Brindlee Mountain Volunteer Fire Department Station 4 Substation (I). Display/hide their locations on the map
Churches in zip code 35175 include: Mount View Church (A), Oleander Church (B), Mount Olive Church (C), Pine Ridge Baptist Church (D), Mount Tabor Baptist Church (E), Pleasant Valley Church (F), Spring Mountain Church (G), Union Chapel Church (H), Brock Chapel (I). Display/hide their locations on the map
Cemeteries: Skidmore Cemetery (1), Pine Ridge Cemetery (2), Dunlap Cemetery (3), Prince Cemetery (4), New Canaan Cemetery (5), Polly Cemetery (6), Mount Olive Cemetery (7). Display/hide their locations on the map
Streams, rivers, and creeks: Tacket Branch (A), Shoal Creek (B), Lynn Creek (C), Kid Creek (D), Cane Creek (E), Bowling Branch (F), Bean Rock Creek (G), Wolf Creek (H), Pigeon Roost Creek (I). Display/hide their locations on the map
In group quarters: 12 (-1 institutionalized population)
Size of family households: 736 2-persons, 442 3-persons, 161 4-persons, 180 5-persons
Size of nonfamily households: 574 1-person, 76 2-persons
517 married couples with children.
339 single-parent households (61 men, 278 women).
97.8% of residents of 35175 zip code speak English at home.
1.6% of residents speak Spanish at home (2% very well, 98% not well).
0.2% of residents speak other Indo-European language at home (100% very well).
Foreign born population: 28 (0.6%) (100.0% of them are naturalized citizens)
This zip code:
0.6%
Whole state:
3.8%
37%Belgium
30%Malaysia
22%Romania
47%American
12%English
6%German
4%Scottish
4%Irish
2%Italian
1%European
Year of entry for the foreign-born population
02010 or later
62000 to 2009
501990 to 1999
23Before 1990
Facilities with environmental interests located in this zip code:
CHEROKEE RIDGE CORP WWTP (4000 CHEROKEE RIDGE RD in UNION GROVE, AL)
National Pollutant Discharge Elimination System NON-MAJOR (Tracking pollutant discharge elimination systems) - permit (Resource Conservation and Recovery Act (tracking hazardous waste)) Business SIC classification: SEWERAGE SYSTEMS Organizations: CHEROKEE RIDGE GOLF INC. (CONTACT/OWNER)
Alternative names: CHEROKEE RIDGE CORPORATION, CHEROKEE RIDGE GOLF INC.
BURDEN CHILDERS FARMS INCORP (JAMES M CHILDERS in UNION GROVE, AL)
National Pollutant Discharge Elimination System NON-MAJOR (Tracking pollutant discharge elimination systems) - permit Business SIC classification: DAIRY FARMS
MASTIN LAKE RD IMPROVEMENTS (REED CONTRACTING SERVICE INC in UNION GROVE, AL)
National Pollutant Discharge Elimination System NON-MAJOR (Tracking pollutant discharge elimination systems) - permit Business SIC classification: HIGHWAY AND STREET CONSTRUCTION, EXCEPT ELEVATED HIGHWAYS Alternative names: REED CONTRACT SVC INC MASTIN, REED CONTRACT SVC INC MASTIN
MORGAN CITY SALVAGE (4346 HWY 231 in UNION GROVE, AL)
(Resource Conservation and Recovery Act (tracking hazardous waste))
Housing units lacking complete plumbing facilities: 2.3% Housing units lacking complete kitchen facilities: 2.1%
61.5%Electricity
22.3%Bottled, tank, or LP gas
13.2%Utility gas
2.3%Wood
0.9%No fuel used
Population in 1990: 4,921. Population change in the 1990s: +99 (+2.0%).
Place of birth for U.S.-born residents:
This state: 3,504
Northeast: 85
Midwest: 348
South: 771
West: 226
66% of the 35175 zip code residents lived in the same house 5 years ago. Out of people who lived in different houses, 51% lived in this county. Out of people who lived in different counties, 50% lived in Alabama.
95% of the 35175 zip code residents lived in the same house 1 year ago. Out of people who lived in different houses, 45% moved from this county. Out of people who lived in different houses, 45% moved from different county within same state. Out of people who lived in different houses, 12% moved from different state.
Private vs. public school enrollment:
Students in private schools in grades 1 to 8 (elementary and middle school): 65
Here:
14.3%
Alabama:
14.7%
Students in private schools in grades 9 to 12 (high school): 21
Here:
8.9%
Alabama:
16.3%
Students in private undergraduate colleges:
Here:
0.0%
Alabama:
14.6%
Occupation by median earnings in the past 12 months ($)
101,577Architecture and engineering occupations
82,552Production occupations
78,045Construction and extraction occupations
58,089Management occupations
55,044Education, training, and library occupations
53,952Transportation occupations
Companies with federal contracts located in this zip code:
PATTERSON MACHINE, INC (2165 RESCUE ROAD in UNION GROVE, AL; small business) : $2,147,858 in 20 contractsfrom 2002 to 2006
Contracts for Aircraft Ground Servicing Equipment, Aircraft Maintenance and Repair Shop Specialized Equipment, Aircraft Hydraulic, Vacuum, and De-icing System Components, Guided Missile Remote Control Systems, and moreby Air Force, Army Signed by year:2000: $0; 2001: $0; 2002: $870,562; 2003: $162,575; 2004: $946,032; 2005: $157,983; 2006: $10,706.
Biggest contracts:
$612,803 with Air Force for Aircraft Ground Servicing Equipment. Signed on 2002-09-17. Completion date: 2003-10-30.
$522,448, same as above.Signed on 2004-03-24. Completion date: 2005-08-08.
$354,319 with Air Force for Aircraft Maintenance and Repair Shop Specialized Equipment. Signed on 2004-05-15. Completion date: 2005-12-31.
$173,366 with Air Force for Aircraft Hydraulic, Vacuum, and De-icing System Components. Signed on 2002-02-22. Completion date: 2002-08-30.
Top industries in this zip code by the number of employees in 2005:
Real Estate and Rental and Leasing: Lessors of Residential Buildings and Dwellings (100-249 employees: 1 establishment)
Arts, Entertainment, and Recreation: Golf Courses and Country Clubs (20-49: 1)
Wholesale Trade: Automobile and Other Motor Vehicle Merchant Wholesalers (20-49: 1)
Construction: Residential Remodelers (10-19: 1)
Construction: Site Preparation Contractors (5-9: 1)
Arts, Entertainment, and Recreation: Fitness and Recreational Sports Centers (5-9: 1)
Accommodation and Food Services: Limited-Service Restaurants (5-9: 1)
Fatal accident statistics in 2013:
Fatal accident count: 2
Vehicles involved in fatal accidents: 2
Fatal accidents caused by drunken drivers: 0
Fatalities: 2
Persons involved in fatal accidents: 2
Pedestrians involved in fatal accidents: 1
Fatal accident statistics in 2011:
Fatal accident count: 1
Vehicles involved in fatal accidents: 3
Fatal accidents caused by drunken drivers: 0
Fatalities: 1
Persons involved in fatal accidents: 2
Pedestrians involved in fatal accidents: 0
Home Mortgage Disclosure Act Aggregated Statistics For Year 2009 (Based on 1 partial tract)
A) FHA, FSA/RHS & VA Home Purchase Loans
B) Conventional Home Purchase Loans
C) Refinancings
D) Home Improvement Loans
F) Non-occupant Loans on < 5 Family Dwellings (A B C & D)
G) Loans On Manufactured Home Dwelling (A B C & D)
Number
Average Value
Number
Average Value
Number
Average Value
Number
Average Value
Number
Average Value
Number
Average Value
LOANS ORIGINATED
2
$142,895
2
$131,610
11
$153,675
3
$24,773
1
$39,060
2
$33,850
APPLICATIONS APPROVED, NOT ACCEPTED
0
$0
1
$53,600
1
$93,310
0
$0
0
$0
0
$0
APPLICATIONS DENIED
1
$67,160
3
$58,880
7
$124,961
2
$24,790
0
$0
3
$42,677
APPLICATIONS WITHDRAWN
1
$100,690
0
$0
3
$161,917
0
$0
0
$0
0
$0
FILES CLOSED FOR INCOMPLETENESS
0
$0
0
$0
1
$104,050
0
$0
0
$0
0
$0
Aggregated Statistics For Year 2008 (Based on 1 partial tract)
A) FHA, FSA/RHS & VA Home Purchase Loans
B) Conventional Home Purchase Loans
C) Refinancings
D) Home Improvement Loans
F) Non-occupant Loans on < 5 Family Dwellings (A B C & D)
G) Loans On Manufactured Home Dwelling (A B C & D)
Number
Average Value
Number
Average Value
Number
Average Value
Number
Average Value
Number
Average Value
Number
Average Value
LOANS ORIGINATED
2
$108,445
4
$111,348
10
$106,482
2
$35,315
1
$107,630
3
$40,037
APPLICATIONS APPROVED, NOT ACCEPTED
0
$0
0
$0
1
$135,410
0
$0
0
$0
0
$0
APPLICATIONS DENIED
0
$0
2
$43,290
8
$119,079
2
$87,940
0
$0
3
$50,343
APPLICATIONS WITHDRAWN
0
$0
1
$70,200
3
$103,727
1
$44,700
0
$0
0
$0
FILES CLOSED FOR INCOMPLETENESS
0
$0
0
$0
1
$233,380
0
$0
0
$0
0
$0
Aggregated Statistics For Year 2007 (Based on 1 partial tract)
A) FHA, FSA/RHS & VA Home Purchase Loans
B) Conventional Home Purchase Loans
C) Refinancings
D) Home Improvement Loans
F) Non-occupant Loans on < 5 Family Dwellings (A B C & D)
G) Loans On Manufactured Home Dwelling (A B C & D)
Number
Average Value
Number
Average Value
Number
Average Value
Number
Average Value
Number
Average Value
Number
Average Value
LOANS ORIGINATED
2
$87,345
8
$91,968
10
$94,037
2
$21,535
1
$107,630
4
$40,905
APPLICATIONS APPROVED, NOT ACCEPTED
0
$0
1
$60,220
2
$89,080
0
$0
0
$0
1
$19,100
APPLICATIONS DENIED
0
$0
3
$73,200
8
$102,790
4
$50,262
0
$0
2
$67,435
APPLICATIONS WITHDRAWN
0
$0
1
$63,690
3
$122,967
1
$53,160
0
$0
1
$32,660
FILES CLOSED FOR INCOMPLETENESS
0
$0
0
$0
1
$137,250
0
$0
0
$0
0
$0
Aggregated Statistics For Year 2006 (Based on 1 partial tract)
A) FHA, FSA/RHS & VA Home Purchase Loans
B) Conventional Home Purchase Loans
C) Refinancings
D) Home Improvement Loans
F) Non-occupant Loans on < 5 Family Dwellings (A B C & D)
G) Loans On Manufactured Home Dwelling (A B C & D)
Number
Average Value
Number
Average Value
Number
Average Value
Number
Average Value
Number
Average Value
Number
Average Value
LOANS ORIGINATED
1
$91,470
8
$79,856
11
$98,094
2
$29,730
1
$71,940
4
$34,260
APPLICATIONS APPROVED, NOT ACCEPTED
0
$0
1
$100,580
2
$103,835
0
$0
0
$0
1
$42,100
APPLICATIONS DENIED
0
$0
3
$58,337
8
$95,480
2
$52,405
1
$35,700
2
$54,415
APPLICATIONS WITHDRAWN
0
$0
2
$102,205
4
$98,438
0
$0
0
$0
0
$0
FILES CLOSED FOR INCOMPLETENESS
0
$0
1
$39,280
3
$124,050
0
$0
0
$0
0
$0
Aggregated Statistics For Year 2005 (Based on 1 partial tract)
A) FHA, FSA/RHS & VA Home Purchase Loans
B) Conventional Home Purchase Loans
C) Refinancings
D) Home Improvement Loans
F) Non-occupant Loans on < 5 Family Dwellings (A B C & D)
G) Loans On Manufactured Home Dwelling (A B C & D)
Number
Average Value
Number
Average Value
Number
Average Value
Number
Average Value
Number
Average Value
Number
Average Value
LOANS ORIGINATED
2
$88,265
8
$103,455
12
$95,398
2
$70,200
2
$73,780
3
$43,510
APPLICATIONS APPROVED, NOT ACCEPTED
0
$0
3
$53,600
4
$75,380
0
$0
0
$0
2
$51,865
APPLICATIONS DENIED
0
$0
3
$63,543
14
$88,389
3
$50,707
1
$38,630
2
$85,985
APPLICATIONS WITHDRAWN
0
$0
2
$93,310
7
$109,724
1
$72,370
0
$0
1
$36,670
FILES CLOSED FOR INCOMPLETENESS
0
$0
0
$0
4
$82,920
0
$0
0
$0
0
$0
Aggregated Statistics For Year 2004 (Based on 1 partial tract)
A) FHA, FSA/RHS & VA Home Purchase Loans
B) Conventional Home Purchase Loans
C) Refinancings
D) Home Improvement Loans
F) Non-occupant Loans on < 5 Family Dwellings (A B C & D)
G) Loans On Manufactured Home Dwelling (A B C & D)
Number
Average Value
Number
Average Value
Number
Average Value
Number
Average Value
Number
Average Value
Number
Average Value
LOANS ORIGINATED
2
$69,225
10
$81,364
13
$91,006
2
$26,255
2
$48,065
4
$36,482
APPLICATIONS APPROVED, NOT ACCEPTED
0
$0
2
$67,055
3
$100,073
1
$35,590
0
$0
1
$69,440
APPLICATIONS DENIED
0
$0
3
$58,480
12
$94,594
4
$42,370
0
$0
3
$55,840
APPLICATIONS WITHDRAWN
0
$0
2
$54,140
3
$116,097
0
$0
0
$0
0
$0
FILES CLOSED FOR INCOMPLETENESS
0
$0
0
$0
4
$114,575
0
$0
0
$0
0
$0
Aggregated Statistics For Year 2003 (Based on 1 partial tract)
A) FHA, FSA/RHS & VA Home Purchase Loans
B) Conventional Home Purchase Loans
C) Refinancings
D) Home Improvement Loans
F) Non-occupant Loans on < 5 Family Dwellings (A B C & D)
Number
Average Value
Number
Average Value
Number
Average Value
Number
Average Value
Number
Average Value
LOANS ORIGINATED
2
$81,375
7
$89,839
26
$102,495
1
$47,410
1
$78,230
APPLICATIONS APPROVED, NOT ACCEPTED
0
$0
2
$67,000
3
$90,633
0
$0
0
$0
APPLICATIONS DENIED
0
$0
3
$56,530
13
$86,182
2
$25,715
1
$37,650
APPLICATIONS WITHDRAWN
0
$0
1
$117,610
6
$91,285
0
$0
0
$0
FILES CLOSED FOR INCOMPLETENESS
0
$0
0
$0
1
$108,280
0
$0
0
$0
Aggregated Statistics For Year 2002 (Based on 1 partial tract)
A) FHA, FSA/RHS & VA Home Purchase Loans
B) Conventional Home Purchase Loans
C) Refinancings
D) Home Improvement Loans
F) Non-occupant Loans on < 5 Family Dwellings (A B C & D)
Number
Average Value
Number
Average Value
Number
Average Value
Number
Average Value
Number
Average Value
LOANS ORIGINATED
2
$69,875
7
$68,261
17
$101,837
1
$34,830
1
$34,720
APPLICATIONS APPROVED, NOT ACCEPTED
0
$0
2
$35,695
4
$61,900
0
$0
0
$0
APPLICATIONS DENIED
0
$0
7
$28,070
8
$63,526
1
$20,400
1
$18,120
APPLICATIONS WITHDRAWN
0
$0
1
$114,360
4
$70,770
0
$0
0
$0
FILES CLOSED FOR INCOMPLETENESS
0
$0
0
$0
2
$96,455
0
$0
0
$0
Aggregated Statistics For Year 2001 (Based on 1 partial tract)
A) FHA, FSA/RHS & VA Home Purchase Loans
B) Conventional Home Purchase Loans
C) Refinancings
D) Home Improvement Loans
F) Non-occupant Loans on < 5 Family Dwellings (A B C & D)
Number
Average Value
Number
Average Value
Number
Average Value
Number
Average Value
Number
Average Value
LOANS ORIGINATED
2
$73,615
8
$67,175
14
$86,916
1
$10,420
1
$70,420
APPLICATIONS APPROVED, NOT ACCEPTED
0
$0
2
$48,500
1
$95,370
0
$0
0
$0
APPLICATIONS DENIED
0
$0
9
$45,763
7
$66,293
1
$15,080
0
$0
APPLICATIONS WITHDRAWN
0
$0
1
$49,040
3
$103,797
0
$0
0
$0
FILES CLOSED FOR INCOMPLETENESS
0
$0
0
$0
2
$94,775
0
$0
0
$0
Aggregated Statistics For Year 2000 (Based on 1 partial tract)
A) FHA, FSA/RHS & VA Home Purchase Loans
B) Conventional Home Purchase Loans
C) Refinancings
D) Home Improvement Loans
F) Non-occupant Loans on < 5 Family Dwellings (A B C & D)
Number
Average Value
Number
Average Value
Number
Average Value
Number
Average Value
Number
Average Value
LOANS ORIGINATED
2
$65,315
13
$61,085
6
$62,188
2
$21,105
0
$0
APPLICATIONS APPROVED, NOT ACCEPTED
0
$0
2
$33,145
1
$41,990
1
$19,960
0
$0
APPLICATIONS DENIED
0
$0
9
$40,374
4
$50,290
1
$15,520
1
$20,070
APPLICATIONS WITHDRAWN
0
$0
0
$0
2
$65,535
0
$0
0
$0
FILES CLOSED FOR INCOMPLETENESS
0
$0
0
$0
2
$53,925
0
$0
0
$0
Aggregated Statistics For Year 1999 (Based on 1 partial tract)
A) FHA, FSA/RHS & VA Home Purchase Loans
B) Conventional Home Purchase Loans
C) Refinancings
D) Home Improvement Loans
F) Non-occupant Loans on < 5 Family Dwellings (A B C & D)
Detailed PMIC statistics for the following Tracts:0057.00
2004 - 2018 National Fire Incident Reporting System (NFIRS) incidents
Based on the data from the years 2004 - 2018 the average number of fire incidents per year is 16. The highest number of fire incidents - 38 took place in 2004, and the least - 2 in 2012. The data has a decreasing trend.
When looking into fire subcategories, the most incidents belonged to: Outside Fires (55.3%), and Structure Fires (35.4%).
Fire incident types reported to NFIRS in Zip Code 35175


 Nearest zip codes: 35016, 35803, 35754, 35087, 35760, 35019.


 Based on the data from the years 2004 - 2018 the average number of fire incidents per year is 16. The highest number of fire incidents - 38 took place in 2004, and the least - 2 in 2012. The data has a decreasing trend.
 When looking into fire subcategories, the most incidents belonged to: Outside Fires (55.3%), and Structure Fires (35.4%).