Estimated zip code population in 2022: 981 Zip code population in 2010: 972 Zip code population in 2000: 777
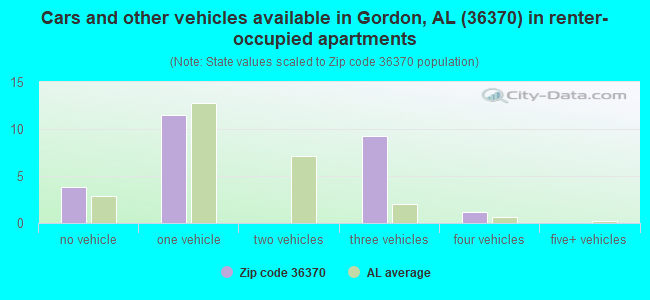
Houses and condos: 439 Renter-occupied apartments: 25
% of renters here:
7%
State:
30%
March 2022 cost of living index in zip code 36370: 79.5 (low, U.S. average is 100)
Land area: 28.3 sq. mi. Water area: 0.0 sq. mi.
Population density: 35 people per square mile
(very low).
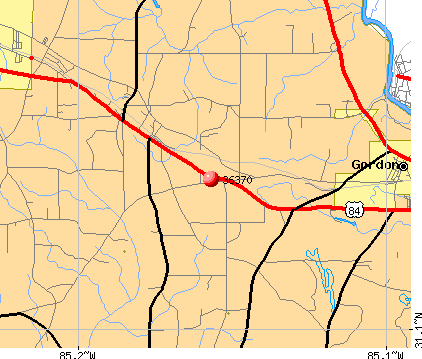
OSM Map
General Map
Google Map
MSN Map
OSM Map
General Map
Google Map
MSN Map
OSM Map
General Map
Google Map
MSN Map
OSM Map
General Map
Google Map
MSN Map
Please wait while loading the map...
Real estate property taxes paid for housing units in 2022:
This zip code:
0.2% ($225)
Alabama:
0.4% ($718)
Median real estate property taxes paid for housing units with mortgages in 2022: $383 (0.3%) Median real estate property taxes paid for housing units with no mortgage in 2022: $203 (0.2%)
Business Search- 14 Million verified businesses
Males: 499
(50.8%)
Females: 482
(49.2%)
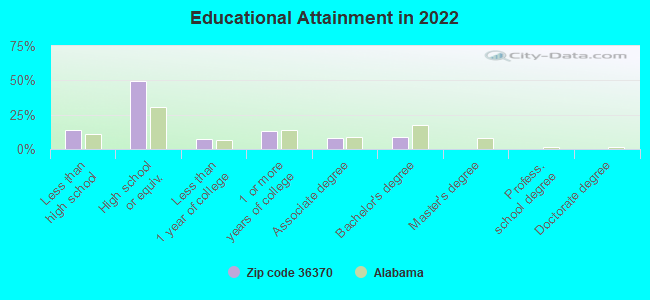
For population 25 years and over in 36370:
High school or higher: 84.8%
Bachelor's degree or higher: 8.6%
Graduate or professional degree: 0.0%
Unemployed: 6.3%
Mean travel time to work (commute): 26.0 minutes
For population 15 years and over in 36370:
Never married: 25.0%
Now married: 55.7%
Separated: 1.1%
Widowed: 6.8%
Divorced: 11.4%
Zip code 36370 compared to state average:
Median house value below state average.
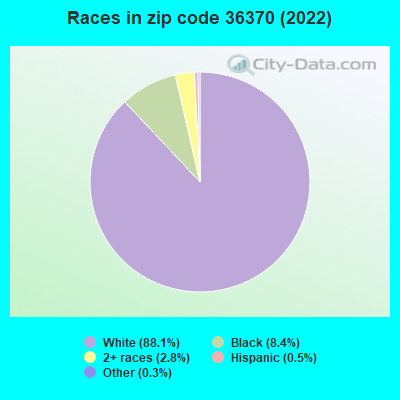
Black race population percentage significantly below state average.
Hispanic race population percentage significantly below state average.
Median age above state average.
Foreign-born population percentage significantly below state average.
Renting percentage significantly below state average.
Number of college students below state average.
Percentage of population with a bachelor's degree or higher significantly below state average.
Averages for the 2020 tax year for zip code 36370, filed in 2021:
Average Adjusted Gross Income (AGI) in 2020: $44,164 (Individual Income Tax Returns)
Here:
$44,164
State:
$63,984
Salary/wage: $46,018 (reported on 78.6% of returns)
Here:
$46,018
State:
$52,834
(% of AGI for various income ranges: 1230.8% for AGIs below $25k, 3542.2% for AGIs $25k-50k, 6530.0% for AGIs $50k-75k, 11955.0% for AGIs $75k-100k, 17983.3% for AGIs $100k-200k)
Taxable interest for individuals: $589 (reported on 21.4% of returns)
This zip code:
$589
Alabama:
$1,615
(% of AGI for various income ranges: 14.6% for AGIs below $25k, 82.5% for AGIs $50k-75k, 3.3% for AGIs $100k-200k)
Profit/loss from business: +$4,717 (reported on 14.3% of returns)
Here:
+$4,717
State:
+$9,534
(% of AGI for various income ranges: 134.6% for AGIs below $25k, 120.0% for AGIs $25k-50k)
Earned income credit: $2,200 (reported on 28.6% of returns)
Here:
$2,200
State:
$2,628
(% of AGI for various income ranges: 147.7% for AGIs below $25k, 80.0% for AGIs $25k-50k)
Percentage of individuals using paid preparers for their 2020 taxes: 90.5%
Here:
90%
State:
93%
(% for various income ranges: 88.9% for AGIs below $25k, 90.9% for AGIs $25k-50k, 83.3% for AGIs $50k-75k, 100.0% for AGIs $75k-100k, 100.0% for AGIs $100k-200k)
Averages for the 2012 tax year for zip code 36370, filed in 2013:
Average Adjusted Gross Income (AGI) in 2012: $38,008 (Individual Income Tax Returns)
Here:
$38,008
State:
$52,001
Salary/wage: $36,469 (reported on 84.2% of returns)
Here:
$36,469
State:
$43,822
(% of AGI for various income ranges: 85.0% for AGIs below $25k, 81.0% for AGIs $25k-50k, 76.0% for AGIs $50k-75k, 82.1% for AGIs $75k-100k)
Taxable interest for individuals: $540 (reported on 26.3% of returns)
This zip code:
$540
Alabama:
$1,592
(% of AGI for various income ranges: 0.3% for AGIs below $25k, 0.2% for AGIs $25k-50k, 0.9% for AGIs $50k-75k, 0.1% for AGIs $75k-100k)
Ordinary dividends: $1,000 (reported on 5.3% of returns)
Here:
$1,000
State:
$5,697
Profit/loss from business: +$4,840 (reported on 13.2% of returns)
Here:
+$4,840
State:
+$9,151
Taxable individual retirement arrangement distribution: $13,050 (reported on 5.3% of returns)
36370:
$13,050
Alabama:
$14,992
Total itemized deductions: $14,325 (24% of AGI, reported on 21.1% of returns)
Here:
$14,325
State:
$21,388
Here:
23.9% of AGI
State:
20.1% of AGI
Charity contributions: $4,120 (reported on 13.2% of returns)
Here:
$4,120
State:
$5,925
Taxes paid: $2,762 (reported on 21.1% of returns)
36370:
$2,762
State:
$5,272
Earned income credit: $2,467 (reported on 31.6% of returns)
Here:
$2,467
State:
$2,646
(% of AGI for various income ranges: 10.2% for AGIs below $25k, 1.7% for AGIs $25k-50k)
Percentage of individuals using paid preparers for their 2012 taxes: 65.8%
Here:
66%
State:
60%
(% for various income ranges: 61.1% for AGIs below $25k, 66.7% for AGIs $25k-50k, 66.7% for AGIs $50k-75k, 80.0% for AGIs $75k-100k)
Averages for the 2004 tax year for zip code 36370, filed in 2005:
Average Adjusted Gross Income (AGI) in 2004: $32,775 (Individual Income Tax Returns)
Here:
$32,775
State:
$42,302
Salary/wage: $34,119 (reported on 86.3% of returns)
Here:
$34,119
State:
$36,626
(% of AGI for various income ranges: 108.0% for AGIs below $10k, 74.0% for AGIs $10k-25k, 86.1% for AGIs $25k-50k, 93.0% for AGIs $50k-75k, 97.2% for AGIs $75k-100k)
Taxable interest for individuals: $1,306 (reported on 31.6% of returns)
This zip code:
$1,306
Alabama:
$1,827
(% of AGI for various income ranges: 4.0% for AGIs below $10k, 2.8% for AGIs $10k-25k, 2.0% for AGIs $25k-50k, 0.3% for AGIs $50k-75k, 0.3% for AGIs $75k-100k)
Taxable dividends: $514 (reported on 10.5% of returns)
Here:
$514
State:
$4,206
Profit/loss from farming: +$86 (reported on 10.0% of returns)
Here:
+$86
State:
-$6,257
Total itemized deductions: $17,452 (24% of AGI, reported on 17.7% of returns)
Here:
$17,452
State:
$17,623
Here:
24.2% of AGI
State:
20.8% of AGI
Charity contributions deductions: $3,460 (5% of AGI, reported on 14.2% of returns)
Here:
$3,460
State:
$4,768
Here:
4.8% of AGI
State:
5.4% of AGI
Total tax: $3,972 (reported on 61.5% of returns)
36370:
$3,972
State:
$6,905
(% of AGI for various income ranges: 3.1% for AGIs below $10k, 2.9% for AGIs $10k-25k, 5.4% for AGIs $25k-50k, 8.4% for AGIs $50k-75k, 11.2% for AGIs $75k-100k)
Earned income credit: $2,048 (reported on 29.9% of returns)
Here:
$2,048
State:
$2,048
Percentage of individuals using paid preparers for their 2004 taxes: 68.1%
Here:
68%
State:
65%
(% for various income ranges: 58.2% for AGIs below $10k, 72.9% for AGIs $10k-25k, 71.1% for AGIs $25k-50k, 69.0% for AGIs $50k-75k, 66.7% for AGIs $75k-100k)
Household received Food Stamps/SNAP in the past 12 months: 64 Household did not receive Food Stamps/SNAP in the past 12 months: 312
Women who had a birth in the past 12 months: 18 (21 now married, 0 unmarried) Women who did not have a birth in the past 12 months: 216 (107 now married, 108 unmarried)
Housing units in zip code 36370 with a mortgage: 145 (9 second mortgage, 3 home equity loan, 5 both second mortgage and home equity loan) Houses without a mortgage: 5
Median monthly owner costs for units with a mortgage: $1,039 Median monthly owner costs for units without a mortgage: $309
Residents with income below the poverty level in 2022:
This zip code:
19.3%
Whole state:
16.2%
Residents with income below 50% of the poverty level in 2022:
This zip code:
10.7%
Whole state:
8.6%
Median number of rooms in houses and condos:
Here:
6.6
State:
6.5
Median number of rooms in apartments:
Here:
6.3
State:
4.7
Notable locations in this zip code not listed on our city pages
Churches in zip code 36370 include: Liberty Baptist Church (A), Philadelphia Church (B), Friendship Bible Church (C), Union Springs Free Will Baptist Church (D), Shady Grove Church (E). Display/hide their locations on the map
Streams, rivers, and creeks: Smith Branch (A), Meadows Creek (B), Little Rocky Creek (C), Jackson Creek (D), Bruners Gin Creek (E). Display/hide their locations on the map
Size of family households: 112 2-persons, 46 3-persons, 46 4-persons, 6 5-persons, 17 6-persons, 3 7-or-more-persons
Size of nonfamily households: 118 1-person, 21 2-persons
103 married couples with children.
42 single-parent households (25 men, 17 women).
99.1% of residents of 36370 zip code speak English at home.
0.3% of residents speak other Indo-European language at home (100% very well).
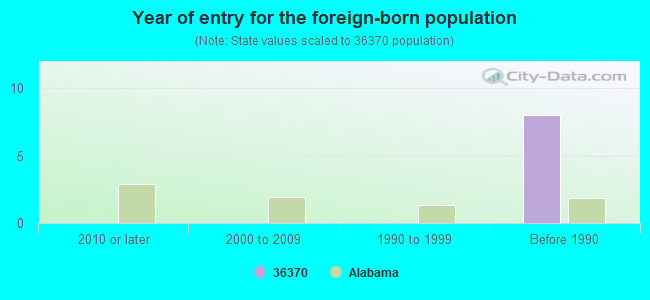
Foreign born population: 0 (0.0%)
:
0.0%
Whole state:
3.8%
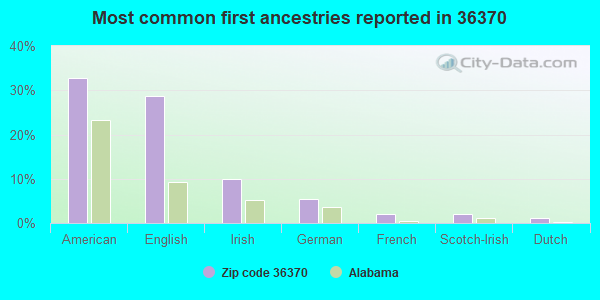
33%American
29%English
10%Irish
5%German
2%French
2%Scotch-Irish
1%Dutch
Year of entry for the foreign-born population
02010 or later
02000 to 2009
01990 to 1999
8Before 1990
Facilities with environmental interests located in this zip code:
SOUTHEASTERN ENTERPRISES (US HIGHWAY 84 EAST in PANSEY, AL)
Conditionally Exempt Small Quantity Generators, less than 100 kg/month of hazardous waste (Resource Conservation and Recovery Act (tracking hazardous waste))
Housing units lacking complete plumbing facilities: 9.0% Housing units lacking complete kitchen facilities: 2.3%
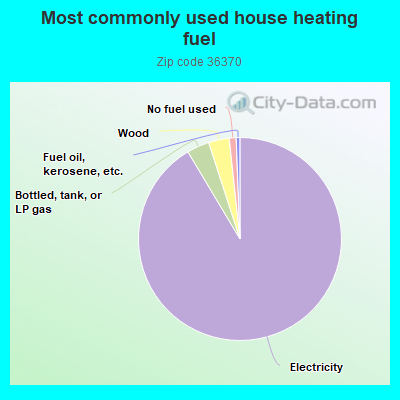
91.8%Electricity
3.6%Bottled, tank, or LP gas
3.3%Wood
1.1%No fuel used
0.6%Fuel oil, kerosene, etc.
Population in 1990: 595. Population change in the 1990s: +182 (+30.6%).
Place of birth for U.S.-born residents:
This state: 667
Northeast: 42
Midwest: 23
South: 230
West: 7
60% of the 36370 zip code residents lived in the same house 5 years ago. Out of people who lived in different houses, 68% lived in this county. Out of people who lived in different counties, 50% lived in Alabama.
89% of the 36370 zip code residents lived in the same house 1 year ago. Out of people who lived in different houses, 49% moved from this county. Out of people who lived in different houses, 35% moved from different county within same state. Out of people who lived in different houses, 12% moved from different state.
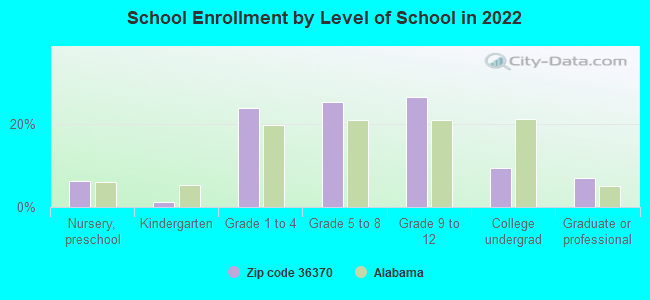
Private vs. public school enrollment:
Students in private schools in grades 1 to 8 (elementary and middle school): 22
Here:
27.8%
Alabama:
14.7%
Students in private schools in grades 9 to 12 (high school): 15
Here:
34.4%
Alabama:
16.3%
Students in private undergraduate colleges:
Here:
0.0%
Alabama:
14.6%
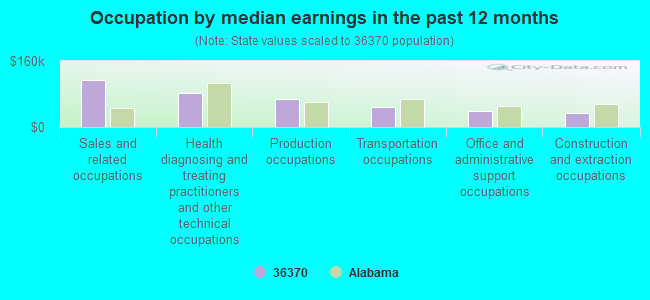
Occupation by median earnings in the past 12 months ($)
114,935Sales and related occupations
82,079Health diagnosing and treating practitioners and other technical occupations
66,914Production occupations
47,977Transportation occupations
38,737Office and administrative support occupations
34,829Construction and extraction occupations
Top industries in this zip code by the number of employees in 2005:
Other Services (except Public Administration): Religious Organizations (1-4 employees: 1 establishment)
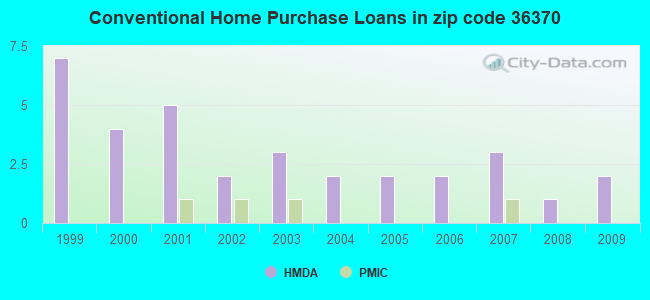
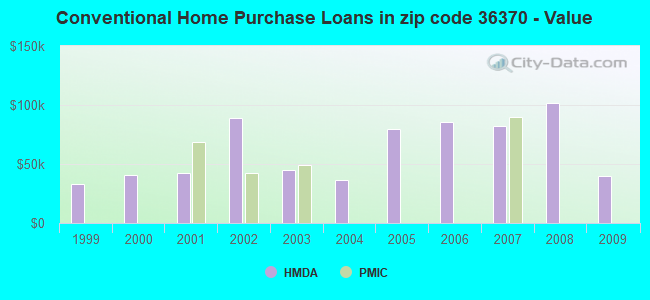
Home Mortgage Disclosure Act Aggregated Statistics For Year 2009 (Based on 1 partial tract)
A) FHA, FSA/RHS & VA Home Purchase Loans
B) Conventional Home Purchase Loans
C) Refinancings
F) Non-occupant Loans on < 5 Family Dwellings (A B C & D)
G) Loans On Manufactured Home Dwelling (A B C & D)
Number
Average Value
Number
Average Value
Number
Average Value
Number
Average Value
Number
Average Value
LOANS ORIGINATED
1
$55,550
2
$39,880
5
$103,446
1
$22,420
1
$37,500
APPLICATIONS APPROVED, NOT ACCEPTED
0
$0
0
$0
1
$107,930
0
$0
0
$0
APPLICATIONS DENIED
0
$0
0
$0
3
$95,893
0
$0
0
$0
APPLICATIONS WITHDRAWN
0
$0
0
$0
1
$121,420
0
$0
0
$0
FILES CLOSED FOR INCOMPLETENESS
0
$0
0
$0
0
$0
0
$0
0
$0
Aggregated Statistics For Year 2008 (Based on 1 partial tract)
A) FHA, FSA/RHS & VA Home Purchase Loans
B) Conventional Home Purchase Loans
C) Refinancings
D) Home Improvement Loans
G) Loans On Manufactured Home Dwelling (A B C & D)
Number
Average Value
Number
Average Value
Number
Average Value
Number
Average Value
Number
Average Value
LOANS ORIGINATED
1
$102,970
1
$101,380
5
$91,898
1
$21,030
2
$60,215
APPLICATIONS APPROVED, NOT ACCEPTED
0
$0
0
$0
1
$41,860
0
$0
0
$0
APPLICATIONS DENIED
0
$0
2
$66,265
4
$91,910
1
$16,670
2
$66,265
APPLICATIONS WITHDRAWN
0
$0
0
$0
1
$111,300
0
$0
1
$76,190
FILES CLOSED FOR INCOMPLETENESS
0
$0
0
$0
0
$0
0
$0
0
$0
Aggregated Statistics For Year 2007 (Based on 1 partial tract)
B) Conventional Home Purchase Loans
C) Refinancings
D) Home Improvement Loans
F) Non-occupant Loans on < 5 Family Dwellings (A B C & D)
G) Loans On Manufactured Home Dwelling (A B C & D)
Number
Average Value
Number
Average Value
Number
Average Value
Number
Average Value
Number
Average Value
LOANS ORIGINATED
3
$81,940
5
$86,622
2
$20,040
1
$52,380
2
$44,145
APPLICATIONS APPROVED, NOT ACCEPTED
2
$64,875
2
$41,465
0
$0
0
$0
2
$54,860
APPLICATIONS DENIED
2
$90,570
6
$75,260
2
$25,000
0
$0
2
$67,655
APPLICATIONS WITHDRAWN
0
$0
2
$49,500
0
$0
0
$0
0
$0
FILES CLOSED FOR INCOMPLETENESS
0
$0
0
$0
0
$0
0
$0
0
$0
Aggregated Statistics For Year 2006 (Based on 1 partial tract)
B) Conventional Home Purchase Loans
C) Refinancings
D) Home Improvement Loans
F) Non-occupant Loans on < 5 Family Dwellings (A B C & D)
G) Loans On Manufactured Home Dwelling (A B C & D)
Number
Average Value
Number
Average Value
Number
Average Value
Number
Average Value
Number
Average Value
LOANS ORIGINATED
2
$85,710
5
$80,630
1
$46,620
1
$21,230
1
$41,070
APPLICATIONS APPROVED, NOT ACCEPTED
2
$46,525
1
$43,850
0
$0
0
$0
2
$50,095
APPLICATIONS DENIED
3
$59,320
3
$57,007
2
$20,830
0
$0
3
$53,633
APPLICATIONS WITHDRAWN
0
$0
2
$67,355
0
$0
0
$0
0
$0
FILES CLOSED FOR INCOMPLETENESS
0
$0
0
$0
0
$0
0
$0
0
$0
Aggregated Statistics For Year 2005 (Based on 1 partial tract)
B) Conventional Home Purchase Loans
C) Refinancings
D) Home Improvement Loans
G) Loans On Manufactured Home Dwelling (A B C & D)
Number
Average Value
Number
Average Value
Number
Average Value
Number
Average Value
LOANS ORIGINATED
2
$79,660
5
$75,194
1
$27,970
2
$34,420
APPLICATIONS APPROVED, NOT ACCEPTED
0
$0
2
$81,045
0
$0
0
$0
APPLICATIONS DENIED
1
$56,940
8
$68,845
2
$26,090
3
$43,647
APPLICATIONS WITHDRAWN
0
$0
2
$141,160
1
$16,860
0
$0
FILES CLOSED FOR INCOMPLETENESS
0
$0
0
$0
0
$0
0
$0
Aggregated Statistics For Year 2004 (Based on 1 partial tract)
B) Conventional Home Purchase Loans
C) Refinancings
D) Home Improvement Loans
F) Non-occupant Loans on < 5 Family Dwellings (A B C & D)
G) Loans On Manufactured Home Dwelling (A B C & D)
Number
Average Value
Number
Average Value
Number
Average Value
Number
Average Value
Number
Average Value
LOANS ORIGINATED
2
$36,405
6
$64,315
2
$17,060
1
$23,410
3
$20,567
APPLICATIONS APPROVED, NOT ACCEPTED
1
$49,200
2
$65,470
0
$0
0
$0
1
$37,300
APPLICATIONS DENIED
2
$39,680
5
$52,536
0
$0
0
$0
1
$43,650
APPLICATIONS WITHDRAWN
1
$30,950
3
$73,077
0
$0
0
$0
0
$0
FILES CLOSED FOR INCOMPLETENESS
0
$0
0
$0
0
$0
0
$0
0
$0
Aggregated Statistics For Year 2003 (Based on 1 partial tract)
B) Conventional Home Purchase Loans
C) Refinancings
D) Home Improvement Loans
Number
Average Value
Number
Average Value
Number
Average Value
LOANS ORIGINATED
3
$45,037
8
$64,901
1
$53,570
APPLICATIONS APPROVED, NOT ACCEPTED
1
$31,150
3
$50,460
0
$0
APPLICATIONS DENIED
2
$34,420
7
$62,553
1
$23,210
APPLICATIONS WITHDRAWN
1
$29,560
1
$69,640
0
$0
FILES CLOSED FOR INCOMPLETENESS
0
$0
1
$63,490
0
$0
Aggregated Statistics For Year 2002 (Based on 1 partial tract)
B) Conventional Home Purchase Loans
C) Refinancings
D) Home Improvement Loans
F) Non-occupant Loans on < 5 Family Dwellings (A B C & D)
Number
Average Value
Number
Average Value
Number
Average Value
Number
Average Value
LOANS ORIGINATED
2
$88,885
6
$72,020
1
$24,800
1
$13,290
APPLICATIONS APPROVED, NOT ACCEPTED
1
$44,440
1
$33,130
0
$0
0
$0
APPLICATIONS DENIED
2
$46,525
3
$54,230
1
$110,910
0
$0
APPLICATIONS WITHDRAWN
0
$0
1
$54,960
0
$0
0
$0
FILES CLOSED FOR INCOMPLETENESS
0
$0
0
$0
0
$0
0
$0
Aggregated Statistics For Year 2001 (Based on 1 partial tract)
A) FHA, FSA/RHS & VA Home Purchase Loans
B) Conventional Home Purchase Loans
C) Refinancings
D) Home Improvement Loans
F) Non-occupant Loans on < 5 Family Dwellings (A B C & D)
Number
Average Value
Number
Average Value
Number
Average Value
Number
Average Value
Number
Average Value
LOANS ORIGINATED
1
$79,960
5
$42,338
7
$47,927
2
$8,930
1
$19,840
APPLICATIONS APPROVED, NOT ACCEPTED
0
$0
2
$50,095
1
$28,370
0
$0
0
$0
APPLICATIONS DENIED
0
$0
8
$32,091
5
$35,554
1
$6,750
0
$0
APPLICATIONS WITHDRAWN
0
$0
0
$0
2
$55,155
0
$0
0
$0
FILES CLOSED FOR INCOMPLETENESS
0
$0
0
$0
0
$0
0
$0
0
$0
Aggregated Statistics For Year 2000 (Based on 1 partial tract)
B) Conventional Home Purchase Loans
C) Refinancings
D) Home Improvement Loans
F) Non-occupant Loans on < 5 Family Dwellings (A B C & D)
Number
Average Value
Number
Average Value
Number
Average Value
Number
Average Value
LOANS ORIGINATED
4
$40,970
3
$48,740
2
$12,200
1
$30,550
APPLICATIONS APPROVED, NOT ACCEPTED
1
$55,550
0
$0
0
$0
0
$0
APPLICATIONS DENIED
2
$39,780
2
$58,925
1
$4,360
0
$0
APPLICATIONS WITHDRAWN
0
$0
1
$48,010
0
$0
0
$0
FILES CLOSED FOR INCOMPLETENESS
0
$0
0
$0
0
$0
0
$0
Aggregated Statistics For Year 1999 (Based on 1 partial tract)
B) Conventional Home Purchase Loans
C) Refinancings
D) Home Improvement Loans
F) Non-occupant Loans on < 5 Family Dwellings (A B C & D)


+$86
-$6,257
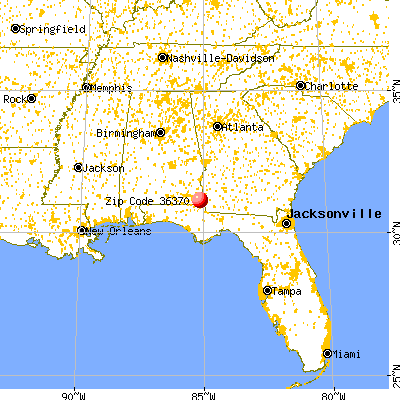
 Nearest zip codes: 36312, 36343, 36376, 36321, 39861, 32445.