Estimated zip code population in 2022: 1,558 Zip code population in 2010: 1,718 Zip code population in 2000: 1,432
Houses and condos: 674 Renter-occupied apartments: 281
% of renters here:
44%
State:
30%
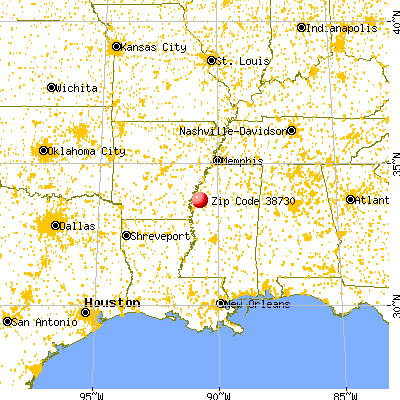
March 2022 cost of living index in zip code 38730: 77.6 (low, U.S. average is 100)
Land area: 49.3 sq. mi. Water area: 0.4 sq. mi.
Population density: 32 people per square mile
(very low).
OSM Map
General Map
Google Map
MSN Map
OSM Map
General Map
Google Map
MSN Map
OSM Map
General Map
Google Map
MSN Map
OSM Map
General Map
Google Map
MSN Map
Please wait while loading the map...
Real estate property taxes paid for housing units in 2022:
This zip code:
0.7% ($843)
Mississippi:
0.7% ($1,161)
Median real estate property taxes paid for housing units with mortgages in 2022: $1,627 (0.7%) Median real estate property taxes paid for housing units with no mortgage in 2022: $769 (0.8%)
Business Search- 14 Million verified businesses
Males: 699
(44.9%)
Females: 858
(55.1%)
For population 25 years and over in 38730:
High school or higher: 92.0%
Bachelor's degree or higher: 43.2%
Graduate or professional degree: 23.0%
Unemployed: 3.9%
Mean travel time to work (commute): 18.0 minutes
For population 15 years and over in 38730:
Never married: 25.2%
Now married: 44.1%
Separated: 0.3%
Widowed: 8.7%
Divorced: 21.7%
Zip code 38730 compared to state average:
Hispanic race population percentage significantly below state average.
Foreign-born population percentage above state average.
Length of stay since moving in significantly above state average.
House age above state average.
Number of college students significantly below state average.
Percentage of population with a bachelor's degree or higher above state average.
Estimated median house/condo value in 2022: $122,036
38730:
$122,036
Mississippi:
$162,500
According to our research of Mississippi and other state lists, there were 2 registered sex offenders living in 38730 zip code as of June 16, 2024. The ratio of all residents to sex offenders in zip code 38730 is 1,148 to 1. The ratio of registered sex offenders to all residents in this zip code is much lower than the state average.
Median resident age:
This zip code:
40.9 years
Mississippi median age:
38.9 years
Average household size:
This zip code:
2.4 people
Mississippi:
2.5 people
Averages for the 2020 tax year for zip code 38730, filed in 2021:
Average Adjusted Gross Income (AGI) in 2020: $59,422 (Individual Income Tax Returns)
Here:
$59,422
State:
$54,084
Salary/wage: $47,622 (reported on 80.6% of returns)
Here:
$47,622
State:
$45,187
(% of AGI for various income ranges: 1249.4% for AGIs below $25k, 3572.0% for AGIs $25k-50k, 7020.0% for AGIs $50k-75k, 9973.3% for AGIs $75k-100k, 17506.0% for AGIs $100k-200k)
Taxable interest for individuals: $1,995 (reported on 30.6% of returns)
This zip code:
$1,995
Mississippi:
$1,434
(% of AGI for various income ranges: 7.6% for AGIs below $25k, 24.7% for AGIs $25k-50k, 77.1% for AGIs $50k-75k, 173.3% for AGIs $75k-100k, 566.0% for AGIs $100k-200k)
Ordinary dividends: $5,767 (reported on 16.7% of returns)
Here:
$5,767
State:
$6,661
(% of AGI for various income ranges: 24.1% for AGIs below $25k, 188.6% for AGIs $50k-75k, 1038.0% for AGIs $100k-200k)
Net capital gain/loss in AGI: +$10,090 (reported on 13.9% of returns)
Here:
+$10,090
State:
+$16,833
(% of AGI for various income ranges: 24.1% for AGIs below $25k, 52.9% for AGIs $50k-75k, 1862.0% for AGIs $100k-200k)
Profit/loss from business: +$6,760 (reported on 13.9% of returns)
Here:
+$6,760
State:
+$7,724
(% of AGI for various income ranges: 121.8% for AGIs below $25k, 54.7% for AGIs $25k-50k, 158.6% for AGIs $50k-75k, 552.0% for AGIs $100k-200k)
Taxable individual retirement arrangement distribution: $13,517 (reported on 8.3% of returns)
38730:
$13,517
Mississippi:
$17,717
(% of AGI for various income ranges: 214.0% for AGIs $25k-50k, 1633.3% for AGIs $75k-100k)
Total itemized deductions: $38,700 (reported on 5.6% of returns)
Here:
$38,700
State:
$34,027
(% of AGI for various income ranges: 3096.0% for AGIs $100k-200k)
Charity contributions: $21,300 (reported on 4.2% of returns)
Here:
$21,300
State:
$14,997
(% of AGI for various income ranges: 1278.0% for AGIs $100k-200k)
Taxes paid: $6,050 (reported on 5.6% of returns)
38730:
$6,050
State:
$6,353
(% of AGI for various income ranges: 484.0% for AGIs $100k-200k)
Earned income credit: $2,729 (reported on 23.6% of returns)
Here:
$2,729
State:
$2,689
(% of AGI for various income ranges: 186.5% for AGIs below $25k, 98.0% for AGIs $25k-50k)
Percentage of individuals using paid preparers for their 2020 taxes: 93.1%
Here:
93%
State:
94%
(% for various income ranges: 95.7% for AGIs below $25k, 94.7% for AGIs $25k-50k, 90.9% for AGIs $50k-75k, 100.0% for AGIs $75k-100k, 90.0% for AGIs $100k-200k, 66.7% for AGIs over 200k)
Averages for the 2012 tax year for zip code 38730, filed in 2013:
Average Adjusted Gross Income (AGI) in 2012: $46,027 (Individual Income Tax Returns)
Here:
$46,027
State:
$46,197
Salary/wage: $38,986 (reported on 84.6% of returns)
Here:
$38,986
State:
$38,549
(% of AGI for various income ranges: 78.9% for AGIs below $25k, 87.3% for AGIs $25k-50k, 67.0% for AGIs $50k-75k, 73.1% for AGIs $75k-100k, 63.2% for AGIs $100k-200k)
Taxable interest for individuals: $1,532 (reported on 28.2% of returns)
This zip code:
$1,532
Mississippi:
$1,482
(% of AGI for various income ranges: 1.2% for AGIs below $25k, 0.2% for AGIs $25k-50k, 0.9% for AGIs $50k-75k, 0.5% for AGIs $75k-100k, 1.4% for AGIs $100k-200k)
Ordinary dividends: $3,150 (reported on 15.4% of returns)
Here:
$3,150
State:
$5,401
(% of AGI for various income ranges: 0.8% for AGIs below $25k, 1.9% for AGIs $50k-75k, 1.7% for AGIs $100k-200k)
Net capital gain/loss in AGI: +$5,840 (reported on 12.8% of returns)
Here:
+$5,840
State:
+$12,121
(% of AGI for various income ranges: 0.6% for AGIs below $25k, 1.8% for AGIs $50k-75k, 3.2% for AGIs $100k-200k)
Profit/loss from business: +$7,791 (reported on 14.1% of returns)
Here:
+$7,791
State:
+$10,220
(% of AGI for various income ranges: 7.6% for AGIs below $25k, 1.5% for AGIs $50k-75k, 8.9% for AGIs $75k-100k)
Taxable individual retirement arrangement distribution: $6,950 (reported on 5.1% of returns)
38730:
$6,950
Mississippi:
$13,665
Total itemized deductions: $22,062 (21% of AGI, reported on 20.5% of returns)
Here:
$22,062
State:
$22,078
Here:
20.8% of AGI
State:
21.8% of AGI
(% of AGI for various income ranges: 8.5% for AGIs $25k-50k, 11.3% for AGIs $50k-75k, 13.3% for AGIs $75k-100k, 11.5% for AGIs $100k-200k)
Charity contributions: $6,346 (reported on 16.7% of returns)
Here:
$6,346
State:
$6,081
(% of AGI for various income ranges: 2.6% for AGIs below $25k, 2.1% for AGIs $50k-75k, 3.1% for AGIs $75k-100k, 3.1% for AGIs $100k-200k)
Taxes paid: $6,362 (reported on 20.5% of returns)
38730:
$6,362
State:
$5,794
(% of AGI for various income ranges: 1.3% for AGIs $25k-50k, 2.0% for AGIs $50k-75k, 4.4% for AGIs $75k-100k, 4.2% for AGIs $100k-200k)
Earned income credit: $2,422 (reported on 29.5% of returns)
Here:
$2,422
State:
$2,710
(% of AGI for various income ranges: 10.5% for AGIs below $25k, 1.8% for AGIs $25k-50k)
Percentage of individuals using paid preparers for their 2012 taxes: 62.8%
Here:
63%
State:
60%
(% for various income ranges: 58.8% for AGIs below $25k, 55.0% for AGIs $25k-50k, 77.8% for AGIs $50k-75k, 66.7% for AGIs $75k-100k, 77.8% for AGIs $100k-200k)
Averages for the 2004 tax year for zip code 38730, filed in 2005:
Average Adjusted Gross Income (AGI) in 2004: $35,044 (Individual Income Tax Returns)
Here:
$35,044
State:
$36,110
Salary/wage: $31,012 (reported on 86.2% of returns)
Here:
$31,012
State:
$31,757
(% of AGI for various income ranges: 106.5% for AGIs below $10k, 81.9% for AGIs $10k-25k, 81.1% for AGIs $25k-50k, 78.1% for AGIs $50k-75k, 80.9% for AGIs $75k-100k, 60.2% for AGIs over 100k)
Taxable interest for individuals: $1,911 (reported on 31.7% of returns)
This zip code:
$1,911
Mississippi:
$1,649
(% of AGI for various income ranges: 5.4% for AGIs below $10k, 1.2% for AGIs $10k-25k, 2.7% for AGIs $25k-50k, 0.6% for AGIs $50k-75k, 0.7% for AGIs $75k-100k, 2.5% for AGIs over 100k)
Taxable dividends: $2,312 (reported on 18.2% of returns)
Here:
$2,312
State:
$3,089
(% of AGI for various income ranges: 2.0% for AGIs below $10k, 0.6% for AGIs $10k-25k, 0.9% for AGIs $25k-50k, 1.0% for AGIs $50k-75k, 0.3% for AGIs $75k-100k, 2.6% for AGIs over 100k)
Net capital gain/loss: +$2,600 (reported on 12.3% of returns)
Here:
+$2,600
State:
+$8,427
(% of AGI for various income ranges: -1.2% for AGIs below $10k, -0.3% for AGIs $10k-25k, 0.1% for AGIs $25k-50k, -0.3% for AGIs $50k-75k, 4.2% for AGIs over 100k)
Profit/loss from business: +$5,448 (reported on 13.5% of returns)
Here:
+$5,448
State:
+$8,818
(% of AGI for various income ranges: 4.7% for AGIs below $10k, 4.2% for AGIs $10k-25k, 4.4% for AGIs $25k-50k, 1.4% for AGIs $50k-75k, 1.0% for AGIs $75k-100k)
Profit/loss from farming: +$231 (reported on 1.7% of returns)
Here:
+$231
State:
-$5,673
IRA payment deduction: $3,812 (reported on 2.1% of returns)
38730:
$3,812
Mississippi:
$3,024
Total itemized deductions: $16,188 (19% of AGI, reported on 18.6% of returns)
Here:
$16,188
State:
$17,896
Here:
18.9% of AGI
State:
22.5% of AGI
(% of AGI for various income ranges: 3.3% for AGIs $10k-25k, 6.0% for AGIs $25k-50k, 9.5% for AGIs $50k-75k, 9.6% for AGIs $75k-100k, 13.6% for AGIs over 100k)
Charity contributions deductions: $4,758 (5% of AGI, reported on 16.0% of returns)
Here:
$4,758
State:
$4,735
Here:
5.4% of AGI
State:
5.7% of AGI
(% of AGI for various income ranges: 3.8% for AGIs below $10k, 1.2% for AGIs $25k-50k, 1.9% for AGIs $50k-75k, 2.2% for AGIs $75k-100k, 4.3% for AGIs over 100k)
Total tax: $5,318 (reported on 63.4% of returns)
38730:
$5,318
State:
$5,562
(% of AGI for various income ranges: 2.4% for AGIs below $10k, 2.7% for AGIs $10k-25k, 6.4% for AGIs $25k-50k, 9.3% for AGIs $50k-75k, 10.8% for AGIs $75k-100k, 16.8% for AGIs over 100k)
Earned income credit: $2,199 (reported on 35.7% of returns)
Here:
$2,199
State:
$2,107
Percentage of individuals using paid preparers for their 2004 taxes: 74.3%
Here:
74%
State:
65%
(% for various income ranges: 70.3% for AGIs below $10k, 82.4% for AGIs $10k-25k, 67.9% for AGIs $25k-50k, 72.4% for AGIs $50k-75k, 66.7% for AGIs $75k-100k, 84.1% for AGIs over 100k)
Household received Food Stamps/SNAP in the past 12 months: 89 Household did not receive Food Stamps/SNAP in the past 12 months: 548
Women who had a birth in the past 12 months: 55 (40 now married, 15 unmarried) Women who did not have a birth in the past 12 months: 358 (89 now married, 269 unmarried)
Housing units in zip code 38730 with a mortgage: 104 Median monthly owner costs for units with a mortgage: $1,453 Median monthly owner costs for units without a mortgage: $334
Residents with income below the poverty level in 2022:
This zip code:
17.9%
Whole state:
19.1%
Residents with income below 50% of the poverty level in 2022:
This zip code:
11.7%
Whole state:
10.3%
Median number of rooms in houses and condos:
Here:
6.8
State:
6.3
Median number of rooms in apartments:
Here:
5.1
State:
4.8
Notable locations in this zip code not listed on our city pages
Churches in zip code 38730 include: New Hope Church (A), Poplar Grove Church (B), Saint Paul Church (C), Chesterfield Church (D), Damascus Church (E), El Bethel Church (F), Gospel Temple (G), Magnolia Church (H). Display/hide their locations on the map
In group quarters: 9 (-1 institutionalized population)
Size of family households: 223 2-persons, 86 3-persons, 61 4-persons, 12 5-persons, 47 6-persons
Size of nonfamily households: 193 1-person, 14 2-persons
276 married couples with children.
67 single-parent households (7 men, 60 women).
100.1% of residents of 38730 zip code speak English at home.
0.3% of residents speak Spanish at home (100% very well).
Foreign born population: 71 (4.6%) (98.6% of them are naturalized citizens)
This zip code:
4.6%
Whole state:
2.2%
100%Ukraine
16%German
14%Irish
11%Slovene
10%American
8%English
1%Welsh
0%Scotch-Irish
Year of entry for the foreign-born population
02010 or later
02000 to 2009
11990 to 1999
63Before 1990
Facilities with environmental interests located in this zip code:
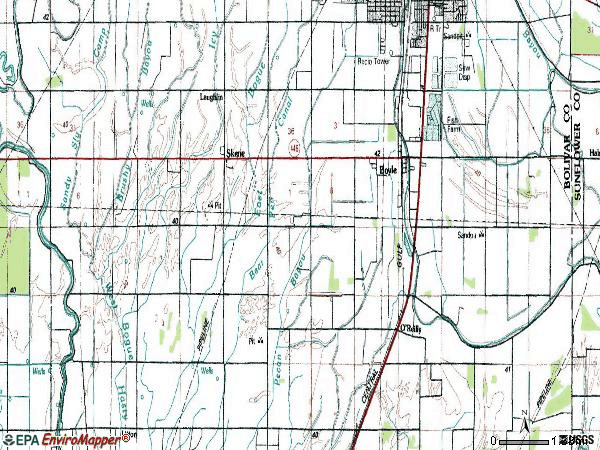
BOYLE FLYING SERVICE INC (2826 HIGHWAY 446 in BOYLE, MS)
STATE MASTER (Mississippi compliance, permits, activity tracking ) - ENSITE-MSU084040, WASTEWATER FACILITY National Pollutant Discharge Elimination System NON-MAJOR (Tracking pollutant discharge elimination systems) - permit Business SIC classification: CROP PLANTING, CULTIVATING, AND PROTECTING Alternative names: BOLIVAR COUNTY
MOSCO TRAILER PARK (2492 HWY 446 in BOYLE, MS)
STATE MASTER (Mississippi compliance, permits, activity tracking ) - ENSITE-MS0047678, National Pollutant Discharge Elimination System Permit National Pollutant Discharge Elimination System NON-MAJOR (Tracking pollutant discharge elimination systems) - permit Business SIC classification: OPERATORS OF RESIDENTIAL MOBILE HOME SITES Alternative names: BOLIVAR COUNTY
BELL ELEMENTARY SCHOOL (TM JONES HWY in BOYLE, MS)
(Geographic Names Information System) (National Center for Education Statistics) - STATE ID-0614004 Organizations: CLEVELAND SCHOOL DIST (SCHOOL DISTRICT)
BOLIVAR (INTERSTATE ROAD AND SNADPIT RD in BOYLE, MS)
National Pollutant Discharge Elimination System NON-MAJOR (Tracking pollutant discharge elimination systems) - permit National Pollutant Discharge Elimination System NON-MAJOR (Tracking pollutant discharge elimination systems) - permit Business SIC classification: NATURAL GAS TRANSMISSION Alternative names: TRUNKLINE GAS COMPANY LLC
2852 HIGHWAY 61 ( in BOYLE, MS)
National Pollutant Discharge Elimination System NON-MAJOR (Tracking pollutant discharge elimination systems) - permit Business SIC classification: CHILD DAY CARE SERVICES Alternative names: FRANK BRANCH DAYCARE FACILTY
Housing units lacking complete plumbing facilities: 3.7% Housing units lacking complete kitchen facilities: 3.6%
52.2%Utility gas
30.4%Electricity
17.7%Bottled, tank, or LP gas
Population in 1990: 1,934.
Place of birth for U.S.-born residents:
This state: 1,277
Midwest: 29
South: 114
West: 50
68% of the 38730 zip code residents lived in the same house 5 years ago. Out of people who lived in different houses, 84% lived in this county. Out of people who lived in different counties, 50% lived in Mississippi.
97% of the 38730 zip code residents lived in the same house 1 year ago. Out of people who lived in different houses, 24% moved from this county. Out of people who lived in different houses, 34% moved from different county within same state. Out of people who lived in different houses, 45% moved from different state.
Private vs. public school enrollment:
Students in private schools in grades 1 to 8 (elementary and middle school): 27
Here:
16.9%
Mississippi:
16.1%
Students in private schools in grades 9 to 12 (high school): 8
Here:
14.6%
Mississippi:
14.6%
Students in private undergraduate colleges:
Here:
0.0%
Mississippi:
12.8%
Occupation by median earnings in the past 12 months ($)
97,318Health diagnosing and treating practitioners and other technical occupations
92,515Management occupations
42,220Office and administrative support occupations
41,684Education, training, and library occupations
36,272Sales and related occupations
33,159Production occupations
Top industries in this zip code by the number of employees in 2005:
Administrative and Support and Waste Management and Remediation Services: Office Administrative Services (10-19 employees: 1 establishment)
Other Services (except Public Administration): Religious Organizations (5-9: 1, 1-4: 1)
Accommodation and Food Services: Full-Service Restaurants (5-9: 1)
People in group quarters in 2010:
14 people in residential treatment centers for adults
Fatal accident statistics in 2014:
Fatal accident count: 2
Vehicles involved in fatal accidents: 3
Fatal accidents caused by drunken drivers: 0
Fatalities: 2
Persons involved in fatal accidents: 4
Pedestrians involved in fatal accidents: 1
Fatal accident statistics in 2012:
Fatal accident count: 1
Vehicles involved in fatal accidents: 1
Fatal accidents caused by drunken drivers: 1
Fatalities: 1
Persons involved in fatal accidents: 1
Pedestrians involved in fatal accidents: 0
2003 - 2018 National Fire Incident Reporting System (NFIRS) incidents
Based on the data from the years 2003 - 2018 the average number of fire incidents per year is 13. The highest number of reported fire incidents - 27 took place in 2007, and the least - 0 in 2004. The data has a growing trend.
When looking into fire subcategories, the most reports belonged to: Structure Fires (40.6%), and Outside Fires (35.6%).
Fire incident types reported to NFIRS in Zip Code 38730


+$231
-$5,673
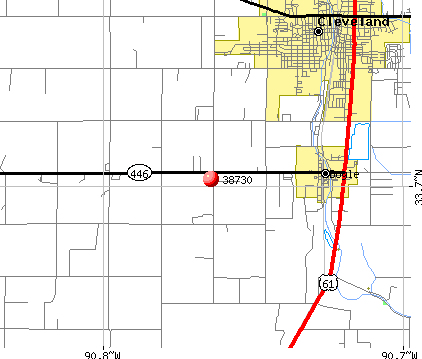 Nearest zip codes: 38773, 38732, 38764, 38759, 38726, 38762.


 Based on the data from the years 2003 - 2018 the average number of fire incidents per year is 13. The highest number of reported fire incidents - 27 took place in 2007, and the least - 0 in 2004. The data has a growing trend.
 When looking into fire subcategories, the most reports belonged to: Structure Fires (40.6%), and Outside Fires (35.6%).