Estimated zip code population in 2022: 3,620 Zip code population in 2010: 3,258 Zip code population in 2000: 3,344
Houses and condos: 1,633 Renter-occupied apartments: 296
% of renters here:
23%
State:
30%
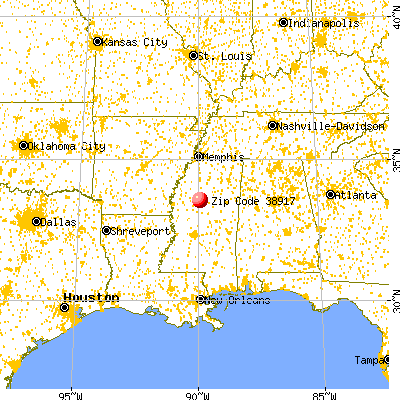
March 2022 cost of living index in zip code 38917: 77.7 (low, U.S. average is 100)
Land area: 166.7 sq. mi. Water area: 3.1 sq. mi.
Population density: 22 people per square mile
(very low).
OSM Map
General Map
Google Map
MSN Map
OSM Map
General Map
Google Map
MSN Map
OSM Map
General Map
Google Map
MSN Map
OSM Map
General Map
Google Map
MSN Map
Please wait while loading the map...
Real estate property taxes paid for housing units in 2022:
This zip code:
0.4% ($400)
Mississippi:
0.7% ($1,161)
Median real estate property taxes paid for housing units with mortgages in 2022: $1,633 (1.3%) Median real estate property taxes paid for housing units with no mortgage in 2022: $344 (0.4%)
Estimated median house/condo value in 2022: $109,876
38917:
$109,876
Mississippi:
$162,500
According to our research of Mississippi and other state lists, there were 5 registered sex offenders living in 38917 zip code as of June 16, 2024. The ratio of all residents to sex offenders in zip code 38917 is 639 to 1. The ratio of registered sex offenders to all residents in this zip code is lower than the state average.
Median resident age:
This zip code:
43.3 years
Mississippi median age:
38.9 years
Average household size:
This zip code:
2.8 people
Mississippi:
2.5 people
Averages for the 2020 tax year for zip code 38917, filed in 2021:
Average Adjusted Gross Income (AGI) in 2020: $61,244 (Individual Income Tax Returns)
Here:
$61,244
State:
$54,084
Salary/wage: $50,595 (reported on 79.4% of returns)
Here:
$50,595
State:
$45,187
(% of AGI for various income ranges: 1272.5% for AGIs below $25k, 3663.9% for AGIs $25k-50k, 7218.5% for AGIs $50k-75k, 10343.8% for AGIs $75k-100k, 15885.0% for AGIs $100k-200k)
Taxable interest for individuals: $1,184 (reported on 29.0% of returns)
This zip code:
$1,184
Mississippi:
$1,434
(% of AGI for various income ranges: 14.7% for AGIs below $25k, 27.4% for AGIs $25k-50k, 74.6% for AGIs $50k-75k, 17.5% for AGIs $75k-100k, 46.0% for AGIs $100k-200k)
Ordinary dividends: $4,200 (reported on 9.9% of returns)
Here:
$4,200
State:
$6,661
(% of AGI for various income ranges: 30.0% for AGIs below $25k, 85.4% for AGIs $50k-75k, 41.0% for AGIs $100k-200k)
Net capital gain/loss in AGI: +$7,600 (reported on 8.4% of returns)
Here:
+$7,600
State:
+$16,833
(% of AGI for various income ranges: 28.7% for AGIs below $25k, 173.1% for AGIs $50k-75k, 519.0% for AGIs $100k-200k)
Profit/loss from business: +$8,371 (reported on 18.3% of returns)
Here:
+$8,371
State:
+$7,724
(% of AGI for various income ranges: 97.8% for AGIs below $25k, 197.4% for AGIs $25k-50k, 258.5% for AGIs $50k-75k, 913.0% for AGIs $100k-200k)
Taxable individual retirement arrangement distribution: $17,178 (reported on 6.9% of returns)
38917:
$17,178
Mississippi:
$17,717
(% of AGI for various income ranges: 58.8% for AGIs below $25k, 90.0% for AGIs $25k-50k, 360.0% for AGIs $50k-75k, 683.0% for AGIs $100k-200k)
Total itemized deductions: $32,312 (reported on 6.1% of returns)
Here:
$32,312
State:
$34,027
(% of AGI for various income ranges: 460.4% for AGIs $25k-50k, 1526.0% for AGIs $100k-200k)
Charity contributions: $15,567 (reported on 4.6% of returns)
Here:
$15,567
State:
$14,997
(% of AGI for various income ranges: 67.0% for AGIs $25k-50k, 780.0% for AGIs $100k-200k)
Taxes paid: $4,938 (reported on 6.1% of returns)
38917:
$4,938
State:
$6,353
(% of AGI for various income ranges: 47.4% for AGIs $25k-50k, 286.0% for AGIs $100k-200k)
Earned income credit: $2,756 (reported on 20.6% of returns)
Here:
$2,756
State:
$2,689
(% of AGI for various income ranges: 163.8% for AGIs below $25k, 95.7% for AGIs $25k-50k)
Percentage of individuals using paid preparers for their 2020 taxes: 89.3%
Here:
89%
State:
94%
(% for various income ranges: 88.9% for AGIs below $25k, 84.8% for AGIs $25k-50k, 90.0% for AGIs $50k-75k, 92.3% for AGIs $75k-100k, 100.0% for AGIs $100k-200k, 75.0% for AGIs over 200k)
Averages for the 2012 tax year for zip code 38917, filed in 2013:
Average Adjusted Gross Income (AGI) in 2012: $51,398 (Individual Income Tax Returns)
Here:
$51,398
State:
$46,197
Salary/wage: $40,911 (reported on 82.8% of returns)
Here:
$40,911
State:
$38,549
(% of AGI for various income ranges: 74.1% for AGIs below $25k, 80.0% for AGIs $25k-50k, 72.4% for AGIs $50k-75k, 81.2% for AGIs $75k-100k, 92.4% for AGIs $100k-200k)
Taxable interest for individuals: $1,444 (reported on 30.5% of returns)
This zip code:
$1,444
Mississippi:
$1,482
(% of AGI for various income ranges: 1.0% for AGIs below $25k, 0.6% for AGIs $25k-50k, 0.7% for AGIs $50k-75k, 0.2% for AGIs $75k-100k, 0.3% for AGIs $100k-200k, 2.2% for AGIs over 200k)
Ordinary dividends: $1,964 (reported on 10.9% of returns)
Here:
$1,964
State:
$5,401
(% of AGI for various income ranges: 0.7% for AGIs below $25k, 0.7% for AGIs $25k-50k, 0.6% for AGIs $50k-75k, 0.2% for AGIs $75k-100k, 0.5% for AGIs $100k-200k)
Net capital gain/loss in AGI: +$18,064 (reported on 8.6% of returns)
Here:
+$18,064
State:
+$12,121
(% of AGI for various income ranges: 2.1% for AGIs $50k-75k, 13.2% for AGIs $100k-200k)
Profit/loss from business: +$6,633 (reported on 18.8% of returns)
Here:
+$6,633
State:
+$10,220
(% of AGI for various income ranges: 10.3% for AGIs below $25k, 2.6% for AGIs $25k-50k, 2.0% for AGIs $50k-75k, 0.8% for AGIs $75k-100k, 2.0% for AGIs $100k-200k)
Taxable individual retirement arrangement distribution: $10,090 (reported on 7.8% of returns)
38917:
$10,090
Mississippi:
$13,665
(% of AGI for various income ranges: 2.8% for AGIs below $25k, 2.3% for AGIs $25k-50k, 1.6% for AGIs $50k-75k, 3.7% for AGIs $75k-100k)
Total itemized deductions: $22,154 (20% of AGI, reported on 21.9% of returns)
Here:
$22,154
State:
$22,078
Here:
19.7% of AGI
State:
21.8% of AGI
(% of AGI for various income ranges: 6.8% for AGIs below $25k, 10.1% for AGIs $25k-50k, 8.1% for AGIs $50k-75k, 8.6% for AGIs $75k-100k, 20.8% for AGIs $100k-200k)
Charity contributions: $7,787 (reported on 18.0% of returns)
Here:
$7,787
State:
$6,081
(% of AGI for various income ranges: 1.4% for AGIs below $25k, 1.9% for AGIs $25k-50k, 2.0% for AGIs $50k-75k, 2.1% for AGIs $75k-100k, 7.8% for AGIs $100k-200k)
Taxes paid: $5,775 (reported on 21.9% of returns)
38917:
$5,775
State:
$5,794
(% of AGI for various income ranges: 0.7% for AGIs below $25k, 1.4% for AGIs $25k-50k, 1.6% for AGIs $50k-75k, 2.0% for AGIs $75k-100k, 7.8% for AGIs $100k-200k)
Earned income credit: $2,338 (reported on 25.0% of returns)
Here:
$2,338
State:
$2,710
(% of AGI for various income ranges: 9.0% for AGIs below $25k, 1.2% for AGIs $25k-50k)
Percentage of individuals using paid preparers for their 2012 taxes: 60.9%
Here:
61%
State:
60%
(% for various income ranges: 59.6% for AGIs below $25k, 54.5% for AGIs $25k-50k, 65.0% for AGIs $50k-75k, 63.6% for AGIs $75k-100k, 90.0% for AGIs $100k-200k)
Averages for the 2004 tax year for zip code 38917, filed in 2005:
Average Adjusted Gross Income (AGI) in 2004: $38,420 (Individual Income Tax Returns)
Here:
$38,420
State:
$36,110
Salary/wage: $33,984 (reported on 86.4% of returns)
Here:
$33,984
State:
$31,757
(% of AGI for various income ranges: 93.9% for AGIs below $10k, 79.4% for AGIs $10k-25k, 84.9% for AGIs $25k-50k, 80.8% for AGIs $50k-75k, 85.6% for AGIs $75k-100k, 54.1% for AGIs over 100k)
Taxable interest for individuals: $1,104 (reported on 33.5% of returns)
This zip code:
$1,104
Mississippi:
$1,649
(% of AGI for various income ranges: 3.1% for AGIs below $10k, 1.1% for AGIs $10k-25k, 1.2% for AGIs $25k-50k, 0.7% for AGIs $50k-75k, 0.2% for AGIs $75k-100k, 1.2% for AGIs over 100k)
Taxable dividends: $910 (reported on 12.2% of returns)
Here:
$910
State:
$3,089
(% of AGI for various income ranges: 1.9% for AGIs below $10k, 0.3% for AGIs $10k-25k, 0.4% for AGIs $25k-50k, 0.1% for AGIs $50k-75k, 0.1% for AGIs $75k-100k, 0.3% for AGIs over 100k)
Net capital gain/loss: +$5,552 (reported on 10.6% of returns)
Here:
+$5,552
State:
+$8,427
(% of AGI for various income ranges: -1.2% for AGIs below $10k, 1.1% for AGIs $10k-25k, 0.0% for AGIs $25k-50k, 0.2% for AGIs $50k-75k, 1.0% for AGIs $75k-100k, 5.2% for AGIs over 100k)
Profit/loss from business: +$11,005 (reported on 14.7% of returns)
Here:
+$11,005
State:
+$8,818
(% of AGI for various income ranges: 13.2% for AGIs below $10k, 5.2% for AGIs $10k-25k, 3.2% for AGIs $25k-50k, 2.8% for AGIs $50k-75k, 8.0% for AGIs over 100k)
IRA payment deduction: $3,625 (reported on 2.5% of returns)
38917:
$3,625
Mississippi:
$3,024
Total itemized deductions: $16,221 (21% of AGI, reported on 21.3% of returns)
Here:
$16,221
State:
$17,896
Here:
21.4% of AGI
State:
22.5% of AGI
(% of AGI for various income ranges: 5.6% for AGIs $10k-25k, 9.3% for AGIs $25k-50k, 9.0% for AGIs $50k-75k, 9.8% for AGIs $75k-100k, 10.9% for AGIs over 100k)
Charity contributions deductions: $4,273 (6% of AGI, reported on 19.1% of returns)
Here:
$4,273
State:
$4,735
Here:
5.8% of AGI
State:
5.7% of AGI
(% of AGI for various income ranges: 1.0% for AGIs $10k-25k, 2.0% for AGIs $25k-50k, 2.0% for AGIs $50k-75k, 2.4% for AGIs $75k-100k, 3.0% for AGIs over 100k)
Total tax: $5,425 (reported on 70.6% of returns)
38917:
$5,425
State:
$5,562
(% of AGI for various income ranges: 3.4% for AGIs below $10k, 3.4% for AGIs $10k-25k, 6.3% for AGIs $25k-50k, 9.0% for AGIs $50k-75k, 10.7% for AGIs $75k-100k, 19.0% for AGIs over 100k)
Earned income credit: $1,897 (reported on 22.8% of returns)
Here:
$1,897
State:
$2,107
Percentage of individuals using paid preparers for their 2004 taxes: 64.6%
Here:
65%
State:
65%
(% for various income ranges: 62.8% for AGIs below $10k, 66.0% for AGIs $10k-25k, 60.4% for AGIs $25k-50k, 65.7% for AGIs $50k-75k, 67.9% for AGIs $75k-100k, 78.5% for AGIs over 100k)
Household received Food Stamps/SNAP in the past 12 months: 133 Household did not receive Food Stamps/SNAP in the past 12 months: 1,139
Women who had a birth in the past 12 months: 27 (0 now married, 26 unmarried) Women who did not have a birth in the past 12 months: 855 (233 now married, 623 unmarried)
Housing units in zip code 38917 with a mortgage: 392 Median monthly owner costs for units with a mortgage: $1,211 Median monthly owner costs for units without a mortgage: $396
Residents with income below the poverty level in 2022:
This zip code:
15.2%
Whole state:
19.1%
Residents with income below 50% of the poverty level in 2022:
This zip code:
10.0%
Whole state:
10.3%
Median number of rooms in houses and condos:
Here:
6.1
State:
6.3
Median number of rooms in apartments:
Here:
5.3
State:
4.8
Notable locations in this zip code not listed on our city pages
Churches in zip code 38917 include: New Jerusalem Church (A), Oak Grove Church (B), Old Union Church (C), Poplar Springs Church (D), Union Grove Church (E), Providence Church (F), Pleasant Grove Church (G), Mitchell Springs Church (H), Liberty Baptist Church (I). Display/hide their locations on the map
Cemeteries: Purnell Cemetery (1), Marshall Cemetery (2), Ebenezer Cemetery (3), Emmons Cemetery (4), Old Salem Cemetery (5), Foreman Cemetery (6), Old Union Cemetery (7). Display/hide their locations on the map
Lakes and reservoirs: Lightline Lake (A), Carpenter Lake (B), Shackelford Lake (C), Gilmore Lake (D), Gee Lake (E), Costilow Lake (F). Display/hide their locations on the map
Streams, rivers, and creeks: Billups Creek (A), Billups Branch (B), Babmore Branch (C), Ashley Creek (D), Carpenter Creek (E), Aikens Creek (F), Wagoner Branch (G), Tanyard Branch (H), Bucksnubby Branch (I). Display/hide their locations on the map
In group quarters: 43 (-1 institutionalized population)
Size of family households: 511 2-persons, 138 3-persons, 99 4-persons, 49 5-persons, 66 6-persons, 28 7-or-more-persons
Size of nonfamily households: 315 1-person, 66 2-persons
383 married couples with children.
174 single-parent households (174 women).
100.1% of residents of 38917 zip code speak English at home.
Foreign born population: 0 (0.0%)
:
0.0%
Whole state:
2.2%
23%American
16%English
2%Irish
1%Scotch-Irish
1%French
1%German
0%Scottish
Facilities with environmental interests located in this zip code:
CARROLL EDUCATIONAL FOUNDATION, CARROLL ACADEMY (COLLEGE STREET in CARROLLTON, MS)
STATE MASTER (Mississippi compliance, permits, activity tracking ) - ENSITE-MS0047775, National Pollutant Discharge Elimination System Permit COMPLIANCE ACTIVITY (Tracking inspections of insecticide, fungicide, and rodenticide, and toxic substances) National Pollutant Discharge Elimination System NON-MAJOR (Tracking pollutant discharge elimination systems) - permit Business SIC classification: ELEMENTARY AND SECONDARY SCHOOLS Alternative names: CARROLL ACADENY, CARROLL COUNTY
CARROLL COUNTY BOARD OF SUPERVISORS, COUNTY COURTHOUSE PROJECT (LEXINGTON STREET in CARROLLTON, MS)
STATE MASTER (Mississippi compliance, permits, activity tracking ) - ENSITE-MS0059242, National Pollutant Discharge Elimination System Permit National Pollutant Discharge Elimination System NON-MAJOR (Tracking pollutant discharge elimination systems) - permit Business SIC classification: SEWERAGE SYSTEMS
FULGHUM FIBRES INC (POOR HOUSE ROAD & HIGHWAY 82 WEST in CARROLLTON, MS)
AIR MINOR (AIRS/AFS) STATE MASTER (Mississippi compliance, permits, activity tracking ) - ENSITE-01500011, AIR PROGRAM, ENSITE-034000011, Business SIC classification: SAWMILLS AND PLANING MILLS, GENERAL
CARROLL COUNTY SCHOOL DISTRICT (LEXINGTON STREET in CARROLLTON, MS)
COMPLIANCE ACTIVITY (Tracking inspections of insecticide, fungicide, and rodenticide, and toxic substances)
Housing units lacking complete plumbing facilities: 12.8% Housing units lacking complete kitchen facilities: 12.4%
40.6%Bottled, tank, or LP gas
31.0%Electricity
28.5%Utility gas
Population in 1990: 2,683. Population change in the 1990s: +661 (+24.6%).
Place of birth for U.S.-born residents:
This state: 3,241
Midwest: 74
South: 277
77% of the 38917 zip code residents lived in the same house 5 years ago. Out of people who lived in different houses, 41% lived in this county. Out of people who lived in different counties, 50% lived in Mississippi.
90% of the 38917 zip code residents lived in the same house 1 year ago. Out of people who lived in different houses, 70% moved from this county. Out of people who lived in different houses, 10% moved from different county within same state. Out of people who lived in different houses, 14% moved from different state.
Private vs. public school enrollment:
Students in private schools in grades 1 to 8 (elementary and middle school): 167
Here:
47.6%
Mississippi:
16.1%
Students in private schools in grades 9 to 12 (high school): 116
Here:
34.9%
Mississippi:
14.6%
Students in private undergraduate colleges: 32
Here:
33.3%
Mississippi:
12.8%
Occupation by median earnings in the past 12 months ($)
111,629Architecture and engineering occupations
67,983Sales and related occupations
66,591Health diagnosing and treating practitioners and other technical occupations
60,787Education, training, and library occupations
56,432Personal care and service occupations
53,789Management occupations
Top industries in this zip code by the number of employees in 2005:
Educational Services: Elementary and Secondary Schools (20-49 employees: 1 establishment)
Other Services (except Public Administration): Religious Organizations (1-4: 5)
Health Care and Social Assistance: Child Day Care Services (5-9: 1)
Administrative and Support and Waste Management and Remediation Services: Landscaping Services (5-9: 1)
Health Care and Social Assistance: Home Health Care Services (5-9: 1)
Construction: New Single-Family Housing Construction (except Operative Builders) (1-4: 2)
Fatal accident statistics in 2014:
Fatal accident count: 3
Vehicles involved in fatal accidents: 5
Fatal accidents caused by drunken drivers: 0
Fatalities: 3
Persons involved in fatal accidents: 10
Pedestrians involved in fatal accidents: 0
Fatal accident statistics in 2013:
Fatal accident count: 1
Vehicles involved in fatal accidents: 1
Fatal accidents caused by drunken drivers: 0
Fatalities: 1
Persons involved in fatal accidents: 1
Pedestrians involved in fatal accidents: 0
2003 - 2018 National Fire Incident Reporting System (NFIRS) incidents
Based on the data from the years 2003 - 2018 the average number of fire incidents per year is 24. The highest number of reported fire incidents - 45 took place in 2011, and the least - 5 in 2018. The data has a dropping trend.
When looking into fire subcategories, the most reports belonged to: Outside Fires (48.3%), and Structure Fires (29.7%).
Fire incident types reported to NFIRS in Zip Code 38917


 Nearest zip codes: 38947, 38930, 38943, 38945, 38923, 38940.


 Based on the data from the years 2003 - 2018 the average number of fire incidents per year is 24. The highest number of reported fire incidents - 45 took place in 2011, and the least - 5 in 2018. The data has a dropping trend.
 When looking into fire subcategories, the most reports belonged to: Outside Fires (48.3%), and Structure Fires (29.7%).