Estimated zip code population in 2022: 3,139 Zip code population in 2010: 3,334 Zip code population in 2000: 3,457
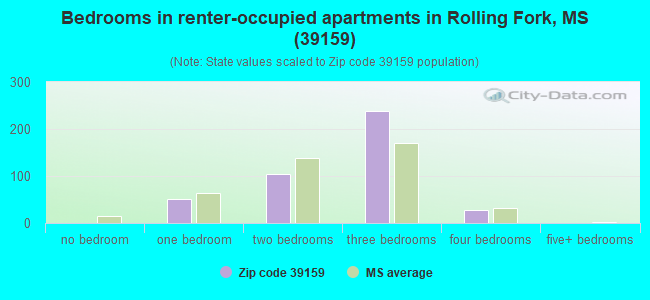
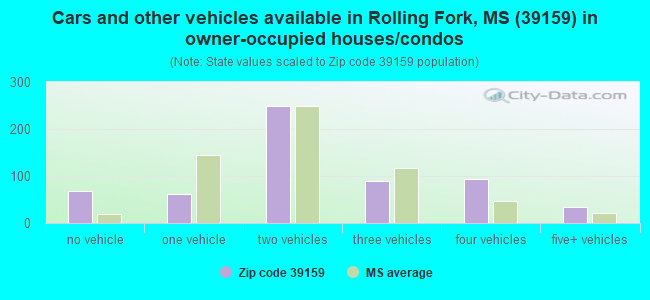
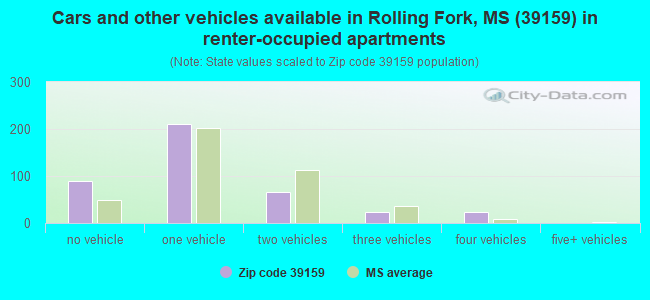
Houses and condos: 1,296 Renter-occupied apartments: 416
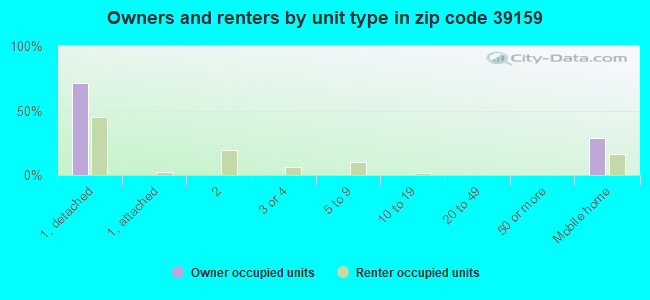
% of renters here:
41%
State:
30%
March 2022 cost of living index in zip code 39159: 77.1 (low, U.S. average is 100)
Land area: 292.3 sq. mi. Water area: 2.2 sq. mi.
Population density: 11 people per square mile
(very low).
OSM Map
General Map
Google Map
MSN Map
OSM Map
General Map
Google Map
MSN Map
OSM Map
General Map
Google Map
MSN Map
OSM Map
General Map
Google Map
MSN Map
Please wait while loading the map...
Real estate property taxes paid for housing units in 2022:
This zip code:
1.2% ($1,135)
Mississippi:
0.7% ($1,161)
Median real estate property taxes paid for housing units with mortgages in 2022: $2,173 (1.4%) Median real estate property taxes paid for housing units with no mortgage in 2022: $498 (0.6%)
Business Search- 14 Million verified businesses
Males: 1,710
(54.5%)
Females: 1,428
(45.5%)
For population 25 years and over in 39159:
High school or higher: 76.4%
Bachelor's degree or higher: 13.0%
Graduate or professional degree: 2.7%
Unemployed: 15.9%
Mean travel time to work (commute): 20.6 minutes
For population 15 years and over in 39159:
Never married: 41.9%
Now married: 34.6%
Separated: 5.0%
Widowed: 7.5%
Divorced: 11.0%
Zip code 39159 compared to state average:
Median house value below state average.
Unemployed percentage significantly above state average.
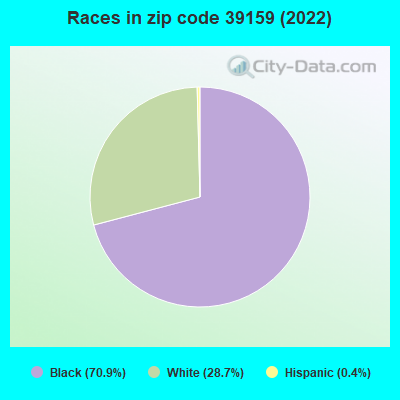
Black race population percentage above state average.
Hispanic race population percentage significantly below state average.
Foreign-born population percentage significantly below state average.
Length of stay since moving in significantly above state average.
Percentage of population with a bachelor's degree or higher below state average.
Estimated median house/condo value in 2022: $98,253
39159:
$98,253
Mississippi:
$162,500
According to our research of Mississippi and other state lists, there were 4 registered sex offenders living in 39159 zip code as of June 16, 2024. The ratio of all residents to sex offenders in zip code 39159 is 878 to 1. The ratio of registered sex offenders to all residents in this zip code is much lower than the state average.
Median resident age:
This zip code:
38.1 years
Mississippi median age:
38.9 years
Average household size:
This zip code:
2.6 people
Mississippi:
2.5 people
Averages for the 2020 tax year for zip code 39159, filed in 2021:
Average Adjusted Gross Income (AGI) in 2020: $41,650 (Individual Income Tax Returns)
Here:
$41,650
State:
$54,084
Salary/wage: $31,387 (reported on 83.0% of returns)
Here:
$31,387
State:
$45,187
(% of AGI for various income ranges: 1298.3% for AGIs below $25k, 4158.9% for AGIs $25k-50k, 6280.0% for AGIs $50k-75k, 37925.0% for AGIs $100k-200k)
Taxable interest for individuals: $1,881 (reported on 18.8% of returns)
This zip code:
$1,881
Mississippi:
$1,434
(% of AGI for various income ranges: 1.7% for AGIs below $25k, 14.7% for AGIs $25k-50k, 28.7% for AGIs $50k-75k, 905.0% for AGIs $100k-200k)
Ordinary dividends: $4,680 (reported on 8.9% of returns)
Here:
$4,680
State:
$6,661
(% of AGI for various income ranges: 8.8% for AGIs below $25k, 127.5% for AGIs $50k-75k, 1645.0% for AGIs $100k-200k)
Net capital gain/loss in AGI: +$9,700 (reported on 7.1% of returns)
Here:
+$9,700
State:
+$16,833
(% of AGI for various income ranges: 205.0% for AGIs $50k-75k, 3060.0% for AGIs $100k-200k)
Profit/loss from business: +$4,057 (reported on 18.8% of returns)
Here:
+$4,057
State:
+$7,724
(% of AGI for various income ranges: 116.0% for AGIs below $25k, 352.5% for AGIs $50k-75k, 920.0% for AGIs $100k-200k)
Taxable individual retirement arrangement distribution: $8,757 (reported on 6.2% of returns)
39159:
$8,757
Mississippi:
$17,717
(% of AGI for various income ranges: 175.3% for AGIs $25k-50k)
Total itemized deductions: $29,583 (reported on 5.4% of returns)
Here:
$29,583
State:
$34,027
(% of AGI for various income ranges: 115.0% for AGIs below $25k, 692.5% for AGIs $50k-75k, 3690.0% for AGIs $100k-200k)
Charity contributions: $12,560 (reported on 4.5% of returns)
Here:
$12,560
State:
$14,997
(% of AGI for various income ranges: 138.9% for AGIs $25k-50k)
Taxes paid: $5,483 (reported on 5.4% of returns)
39159:
$5,483
State:
$6,353
(% of AGI for various income ranges: 12.6% for AGIs below $25k, 126.2% for AGIs $50k-75k, 875.0% for AGIs $100k-200k)
Earned income credit: $2,973 (reported on 40.2% of returns)
Here:
$2,973
State:
$2,689
(% of AGI for various income ranges: 252.1% for AGIs below $25k, 146.8% for AGIs $25k-50k)
Percentage of individuals using paid preparers for their 2020 taxes: 85.7%
Here:
86%
State:
94%
(% for various income ranges: 83.9% for AGIs below $25k, 85.7% for AGIs $25k-50k, 91.7% for AGIs $50k-75k, 83.3% for AGIs $75k-100k, 87.5% for AGIs $100k-200k, 100.0% for AGIs over 200k)
Averages for the 2012 tax year for zip code 39159, filed in 2013:
Average Adjusted Gross Income (AGI) in 2012: $36,233 (Individual Income Tax Returns)
Here:
$36,233
State:
$46,197
Salary/wage: $28,552 (reported on 82.9% of returns)
Here:
$28,552
State:
$38,549
(% of AGI for various income ranges: 78.0% for AGIs below $25k, 82.2% for AGIs $25k-50k, 75.5% for AGIs $50k-75k, 58.4% for AGIs $75k-100k, 42.6% for AGIs $100k-200k)
Taxable interest for individuals: $729 (reported on 21.6% of returns)
This zip code:
$729
Mississippi:
$1,482
(% of AGI for various income ranges: 0.2% for AGIs below $25k, 0.6% for AGIs $25k-50k, 0.6% for AGIs $50k-75k, 0.4% for AGIs $75k-100k, 0.4% for AGIs $100k-200k)
Ordinary dividends: $4,036 (reported on 9.9% of returns)
Here:
$4,036
State:
$5,401
(% of AGI for various income ranges: 0.5% for AGIs below $25k, 0.5% for AGIs $50k-75k, 3.1% for AGIs $100k-200k)
Net capital gain/loss in AGI: +$2,757 (reported on 6.3% of returns)
Here:
+$2,757
State:
+$12,121
Profit/loss from business: +$6,775 (reported on 18.0% of returns)
Here:
+$6,775
State:
+$10,220
(% of AGI for various income ranges: 11.4% for AGIs below $25k, 1.8% for AGIs $25k-50k, 4.3% for AGIs $75k-100k)
Taxable individual retirement arrangement distribution: $5,960 (reported on 4.5% of returns)
39159:
$5,960
Mississippi:
$13,665
Total itemized deductions: $19,531 (21% of AGI, reported on 14.4% of returns)
Here:
$19,531
State:
$22,078
Here:
21.0% of AGI
State:
21.8% of AGI
(% of AGI for various income ranges: 11.3% for AGIs $25k-50k, 9.1% for AGIs $50k-75k, 9.7% for AGIs $75k-100k, 9.3% for AGIs $100k-200k)
Charity contributions: $7,864 (reported on 12.6% of returns)
Here:
$7,864
State:
$6,081
(% of AGI for various income ranges: 2.9% for AGIs $25k-50k, 2.9% for AGIs $50k-75k, 3.0% for AGIs $75k-100k, 4.4% for AGIs $100k-200k)
Taxes paid: $4,775 (reported on 14.4% of returns)
39159:
$4,775
State:
$5,794
(% of AGI for various income ranges: 1.7% for AGIs $25k-50k, 1.9% for AGIs $50k-75k, 2.0% for AGIs $75k-100k, 3.3% for AGIs $100k-200k)
Earned income credit: $3,168 (reported on 45.0% of returns)
Here:
$3,168
State:
$2,710
(% of AGI for various income ranges: 16.7% for AGIs below $25k, 1.9% for AGIs $25k-50k)
Percentage of individuals using paid preparers for their 2012 taxes: 66.7%
Here:
67%
State:
60%
(% for various income ranges: 64.1% for AGIs below $25k, 62.5% for AGIs $25k-50k, 70.0% for AGIs $50k-75k, 83.3% for AGIs $75k-100k, 85.7% for AGIs $100k-200k)
Averages for the 2004 tax year for zip code 39159, filed in 2005:
Average Adjusted Gross Income (AGI) in 2004: $27,739 (Individual Income Tax Returns)
Here:
$27,739
State:
$36,110
Salary/wage: $22,815 (reported on 90.3% of returns)
Here:
$22,815
State:
$31,757
(% of AGI for various income ranges: 126.1% for AGIs below $10k, 88.4% for AGIs $10k-25k, 86.8% for AGIs $25k-50k, 68.4% for AGIs $50k-75k, 71.5% for AGIs $75k-100k, 44.7% for AGIs over 100k)
Taxable interest for individuals: $1,227 (reported on 21.4% of returns)
This zip code:
$1,227
Mississippi:
$1,649
(% of AGI for various income ranges: 3.8% for AGIs below $10k, 0.5% for AGIs $10k-25k, 0.7% for AGIs $25k-50k, 1.0% for AGIs $50k-75k, 0.5% for AGIs $75k-100k, 1.3% for AGIs over 100k)
Taxable dividends: $3,808 (reported on 10.1% of returns)
Here:
$3,808
State:
$3,089
(% of AGI for various income ranges: 0.8% for AGIs below $10k, 0.0% for AGIs $10k-25k, 0.2% for AGIs $25k-50k, 0.6% for AGIs $50k-75k, 1.0% for AGIs $75k-100k, 4.9% for AGIs over 100k)
Net capital gain/loss: +$6,387 (reported on 7.5% of returns)
Here:
+$6,387
State:
+$8,427
(% of AGI for various income ranges: 0.0% for AGIs $10k-25k, 0.0% for AGIs $25k-50k, 1.0% for AGIs $50k-75k, 0.1% for AGIs $75k-100k, 7.0% for AGIs over 100k)
Profit/loss from business: +$4,026 (reported on 9.3% of returns)
Here:
+$4,026
State:
+$8,818
(% of AGI for various income ranges: 9.4% for AGIs below $10k, 2.3% for AGIs $10k-25k, 0.7% for AGIs $25k-50k, 0.4% for AGIs $75k-100k, 1.2% for AGIs over 100k)
Profit/loss from farming: +$4,312 (reported on 2.6% of returns)
Here:
+$4,312
State:
-$5,673
IRA payment deduction: $3,304 (reported on 1.9% of returns)
39159:
$3,304
Mississippi:
$3,024
Total itemized deductions: $17,076 (21% of AGI, reported on 11.7% of returns)
Here:
$17,076
State:
$17,896
Here:
20.7% of AGI
State:
22.5% of AGI
(% of AGI for various income ranges: 3.1% for AGIs $10k-25k, 6.2% for AGIs $25k-50k, 8.9% for AGIs $50k-75k, 12.1% for AGIs $75k-100k, 9.4% for AGIs over 100k)
Charity contributions deductions: $6,250 (7% of AGI, reported on 10.7% of returns)
Here:
$6,250
State:
$4,735
Here:
7.3% of AGI
State:
5.7% of AGI
(% of AGI for various income ranges: 0.5% for AGIs $10k-25k, 1.7% for AGIs $25k-50k, 2.9% for AGIs $50k-75k, 4.0% for AGIs $75k-100k, 4.1% for AGIs over 100k)
Total tax: $5,449 (reported on 45.5% of returns)
39159:
$5,449
State:
$5,562
(% of AGI for various income ranges: 3.7% for AGIs below $10k, 1.7% for AGIs $10k-25k, 5.7% for AGIs $25k-50k, 9.9% for AGIs $50k-75k, 10.5% for AGIs $75k-100k, 18.7% for AGIs over 100k)
Earned income credit: $2,440 (reported on 51.1% of returns)
Here:
$2,440
State:
$2,107
Percentage of individuals using paid preparers for their 2004 taxes: 51.3%
Here:
51%
State:
65%
(% for various income ranges: 41.9% for AGIs below $10k, 44.0% for AGIs $10k-25k, 58.3% for AGIs $25k-50k, 73.6% for AGIs $50k-75k, 80.4% for AGIs $75k-100k, 92.7% for AGIs over 100k)
Household received Food Stamps/SNAP in the past 12 months: 351 Household did not receive Food Stamps/SNAP in the past 12 months: 659
Women who had a birth in the past 12 months: 8 (8 now married, 0 unmarried) Women who did not have a birth in the past 12 months: 559 (236 now married, 323 unmarried)
Housing units in zip code 39159 with a mortgage: 259 Median monthly owner costs for units with a mortgage: $1,433 Median monthly owner costs for units without a mortgage: $381
Residents with income below the poverty level in 2022:
This zip code:
20.2%
Whole state:
19.1%
Residents with income below 50% of the poverty level in 2022:
This zip code:
10.3%
Whole state:
10.3%
Median number of rooms in houses and condos:
Here:
6.2
State:
6.3
Median number of rooms in apartments:
Here:
5.0
State:
4.8
Notable locations in this zip code not listed on our city pages
Notable locations in zip code 39159: Red Rock (A), Rolling Fork Landing (B), Shipland Plantation Landing (C), Baleshed Landing (D), Ben Lomond Landing (E), Holly Ridge Landing (F), Barge Lake Campground (G), Grace Fire Department (H), Rolling Fork Fire Department (I). Display/hide their locations on the map
Churches in zip code 39159 include: New Hope Church (A), Paradise Church (B), Pleasant Green Church (C), Pleasant Grove Church (D), Rock of Mount Zion Church (E), Saint James Church (F), Saint Matthews Church (G), Saint Michaels Church (H), Saint Peters Church (I). Display/hide their locations on the map
Lakes and reservoirs: Whiting Lake (A), Bear Lake (B), Moon Lake (C), Goose Lake (D), Carlisle Lake (E), Fivemile Lake (F), Fitler Lake (G), Sunflower-Greentree Reservoir (H). Display/hide their locations on the map
Streams, rivers, and creeks: Cane Bayou (A), Tillman Bayou (B), American Chute (C), Atchafalaya Bayou (D), Choctaw Bayou (E), Newsom Bayou (F), Little Black Bayou (G), Rolling Fork Creek (H), Indian Bayou (I). Display/hide their locations on the map
Parks in zip code 39159 include: Indian Bayou State Wildlife Area (1), Sunflower Waterfowl Project (2), Anderson-Tully State Wildlife Management Area (3). Display/hide their locations on the map
In group quarters: 484 (-1 institutionalized population)
Size of family households: 222 2-persons, 110 3-persons, 168 4-persons, 58 5-persons, 63 6-persons, 5 7-or-more-persons
Size of nonfamily households: 285 1-person, 88 2-persons, 3 3-persons
246 married couples with children.
202 single-parent households (28 men, 174 women).
99.5% of residents of 39159 zip code speak English at home.
0.3% of residents speak Spanish at home (100% very well).
Foreign born population: 0 (0.0%)
:
0.0%
Whole state:
2.2%
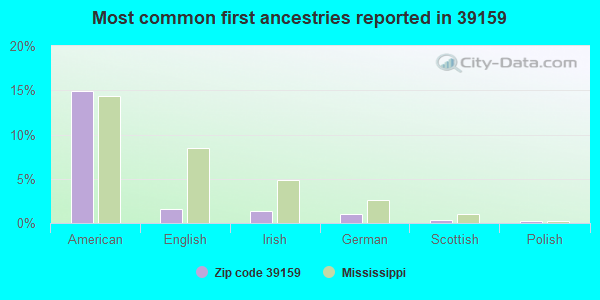
15%American
2%English
1%Irish
1%German
0%Scottish
0%Polish
Year of entry for the foreign-born population
02010 or later
12000 to 2009
01990 to 1999
0Before 1990
Facilities with environmental interests located in this zip code:
JIMMY SANDERS INC (109 HWY 61 N in ROLLING FORK, MS)
COMPLIANCE ACTIVITY (Tracking inspections of insecticide, fungicide, and rodenticide, and toxic substances)
Housing units lacking complete plumbing facilities: 4.8% Housing units lacking complete kitchen facilities: 2.3%
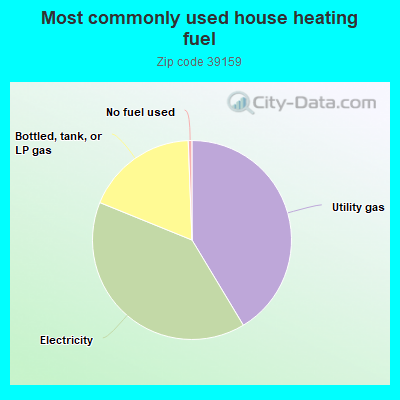
41.5%Utility gas
39.9%Electricity
18.3%Bottled, tank, or LP gas
0.6%No fuel used
Population in 1990: 4,509.
Place of birth for U.S.-born residents:
This state: 2,804
Northeast: 10
Midwest: 85
South: 209
West: 4
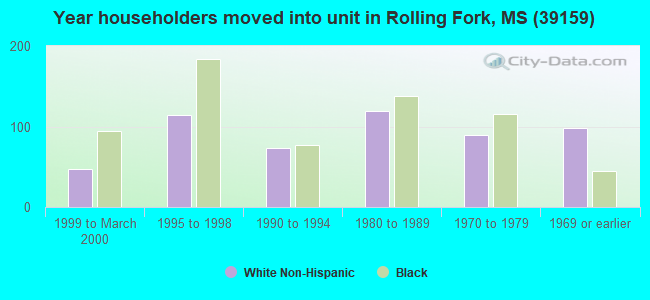
71% of the 39159 zip code residents lived in the same house 5 years ago. Out of people who lived in different houses, 61% lived in this county. Out of people who lived in different counties, 50% lived in Mississippi.
92% of the 39159 zip code residents lived in the same house 1 year ago. Out of people who lived in different houses, 17% moved from this county. Out of people who lived in different houses, 70% moved from different county within same state. Out of people who lived in different houses, 12% moved from different state.
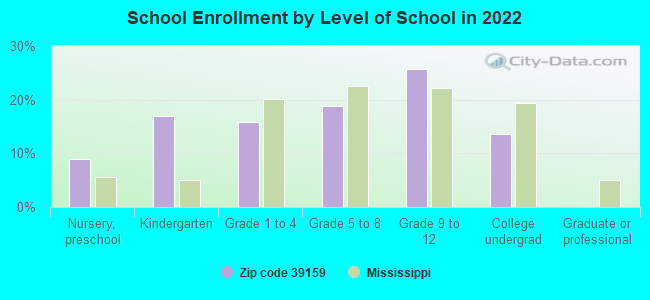
Private vs. public school enrollment:
Students in private schools in grades 1 to 8 (elementary and middle school): 46
Here:
18.1%
Mississippi:
16.1%
Students in private schools in grades 9 to 12 (high school): 37
Here:
20.0%
Mississippi:
14.6%
Students in private undergraduate colleges: 43
Here:
42.3%
Mississippi:
12.8%
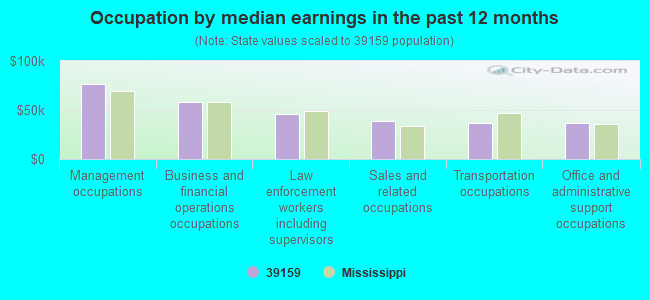
Occupation by median earnings in the past 12 months ($)
76,059Management occupations
58,594Business and financial operations occupations
46,225Law enforcement workers including supervisors
39,035Sales and related occupations
37,229Transportation occupations
36,302Office and administrative support occupations
Companies with federal contracts located in this zip code:
BELL, CHARLES (HWY 61 N in ROLLING FORK, MS; small business) : $1,041,802 in 22 contractsfrom 2001 to 2004
Contracts for Construction of Structures and Facilities -- Other Conservation and Development Facilities, Maintenance, Repair or Alteration of Real Property -- Other Conservation and Development Facilities, Construction of Structures and Facilities -- Other Non-Building Facilities by Natural Resources Conservation Service, Soil Conservation Service (disused code), U.S. Army Corps of Engineers - civil program financing only, Army, and others Signed by year:2000: $0; 2001: $282,000; 2002: $158,470; 2003: $541,734; 2004: $59,598; 2005: $0; 2006: $0.
Biggest contracts:
$232,039 with Natural Resources Conservation Service for Construction of Structures and Facilities -- Other Conservation and Development Facilities. Signed on 2003-09-15. Completion date: 2004-06-15.
$162,000 with Soil Conservation Service (disused code) for Maintenance, Repair or Alteration of Real Property -- Other Conservation and Development Facilities. Signed on 2001-09-15. Completion date: 2001-12-15.
$80,000 with U.S. Army Corps of Engineers - civil program financing only for Construction of Structures and Facilities -- Other Non-Building Facilities. Signed on 2003-06-03. Completion date: 2004-02-26.
$69,000 with Soil Conservation Service (disused code) for Maintenance, Repair or Alteration of Real Property -- Other Conservation and Development Facilities. Signed on 2001-10-15. Completion date: 2002-01-15.
MIDWAY CONSTRUCTION, INC (HWY 61 in ROLLING FORK, MS; small business) 3 employees, $170000 revenue. : $619,900 in 7 contractsfrom 2002 to 2003
Contracts for Fisheries Resources Management Services by Forest Service (disused code: now 12C2), Forest Service Signed by year:2000: $0; 2001: $0; 2002: $590,200; 2003: $29,700; 2004: $0; 2005: $0; 2006: $0.
Biggest contracts:
$450,000 with Forest Service (disused code: now 12C2) for Fisheries Resources Management Services. Signed on 2002-07-15. Completion date: 2002-10-15.
$79,000, same as above.Signed on 2002-08-15. Completion date: 2002-10-15.
$61,200 with Forest Service for Fisheries Resources Management Services. Signed on 2002-12-15. Completion date: 2003-06-15.
$29,700, same as above.Signed on 2003-03-15. Completion date: 2003-06-15.
Top industries in this zip code by the number of employees in 2005:
Health Care and Social Assistance: Nursing Care Facilities (50-99 employees: 1 establishment)
Health Care and Social Assistance: General Medical and Surgical Hospitals (50-99: 1)
Accommodation and Food Services: Limited-Service Restaurants (10-19: 2, 5-9: 1)
Health Care and Social Assistance: Services for the Elderly and Persons with Disabilities (20-49: 1)
Other Services (except Public Administration): Grantmaking Foundations (20-49: 1)
Wholesale Trade: Farm and Garden Machinery and Equipment Merchant Wholesalers (10-19: 2)
59 people in nursing facilities/skilled-nursing facilities
25 people in workers' group living quarters and job corps centers
14 people in residential treatment centers for adults
8 people in hospitals with patients who have no usual home elsewhere
2 people in mental (psychiatric) hospitals and psychiatric units in other hospitals
People in group quarters in 2000:
61 people in nursing homes
17 people in homes for the physically handicapped
14 people in local jails and other confinement facilities (including police lockups)
8 people in other noninstitutional group quarters
5 people in mental (psychiatric) hospitals or wards
Fatal accident statistics in 2012:
Fatal accident count: 3
Vehicles involved in fatal accidents: 4
Fatal accidents caused by drunken drivers: 0
Fatalities: 3
Persons involved in fatal accidents: 4
Pedestrians involved in fatal accidents: 0
Fatal accident statistics in 2011:
Fatal accident count: 1
Vehicles involved in fatal accidents: 2
Fatal accidents caused by drunken drivers: 0
Fatalities: 2
Persons involved in fatal accidents: 6
Pedestrians involved in fatal accidents: 0
2003 - 2018 National Fire Incident Reporting System (NFIRS) incidents
Based on the data from the years 2003 - 2018 the average number of fires per year is 22. The highest number of fire incidents - 37 took place in 2010, and the least - 8 in 2003. The data has a growing trend.
When looking into fire subcategories, the most reports belonged to: Structure Fires (57.4%), and Outside Fires (22.4%).
Fire incident types reported to NFIRS in Zip Code 39159


+$4,312
-$5,673
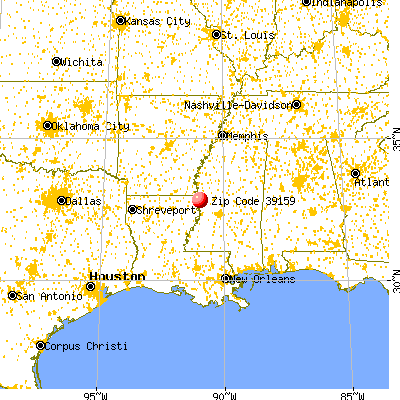
 Nearest zip codes: 39054, 39113, 38745, 38704, 38744, 39088.


 Based on the data from the years 2003 - 2018 the average number of fires per year is 22. The highest number of fire incidents - 37 took place in 2010, and the least - 8 in 2003. The data has a growing trend.
 When looking into fire subcategories, the most reports belonged to: Structure Fires (57.4%), and Outside Fires (22.4%).