Estimated zip code population in 2022: 548 Zip code population in 2010: 564 Zip code population in 2000: 497
Houses and condos: 322 Renter-occupied apartments: 85
% of renters here:
32%
State:
31%
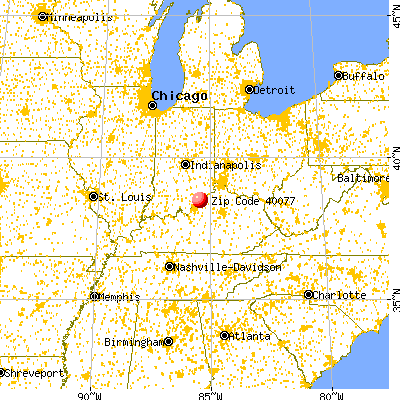
March 2022 cost of living index in zip code 40077: 82.0 (low, U.S. average is 100)
Land area: 8.5 sq. mi. Water area: 1.7 sq. mi.
Population density: 64 people per square mile
(very low).
OSM Map
General Map
Google Map
MSN Map
OSM Map
General Map
Google Map
MSN Map
OSM Map
General Map
Google Map
MSN Map
OSM Map
General Map
Google Map
MSN Map
Please wait while loading the map...
Real estate property taxes paid for housing units in 2022:
This zip code:
0.9% ($1,887)
Kentucky:
0.7% ($1,456)
Median real estate property taxes paid for housing units with mortgages in 2022: $1,878 (0.8%) Median real estate property taxes paid for housing units with no mortgage in 2022: $1,888 (1.0%)
Business Search- 14 Million verified businesses
Males: 265
(48.5%)
Females: 282
(51.5%)
For population 25 years and over in 40077:
High school or higher: 92.9%
Bachelor's degree or higher: 13.3%
Graduate or professional degree: 7.5%
Unemployed: 2.9%
Mean travel time to work (commute): 29.5 minutes
For population 15 years and over in 40077:
Never married: 26.3%
Now married: 58.8%
Separated: 5.4%
Widowed: 7.2%
Divorced: 2.4%
Zip code 40077 compared to state average:
Black race population percentage significantly below state average.
Foreign-born population percentage significantly below state average.
Length of stay since moving in significantly above state average.
Number of college students significantly below state average.
Percentage of population with a bachelor's degree or higher below state average.
Averages for the 2020 tax year for zip code 40077, filed in 2021:
Average Adjusted Gross Income (AGI) in 2020: $77,767 (Individual Income Tax Returns)
Here:
$77,767
State:
$61,342
Salary/wage: $53,423 (reported on 86.7% of returns)
Here:
$53,423
State:
$50,827
(% of AGI for various income ranges: 1270.0% for AGIs below $25k, 3935.0% for AGIs $25k-50k, 6040.0% for AGIs $50k-75k, 10065.0% for AGIs $75k-100k, 24173.3% for AGIs $100k-200k)
Taxable interest for individuals: $462 (reported on 26.7% of returns)
This zip code:
$462
Kentucky:
$1,441
(% of AGI for various income ranges: 8.0% for AGIs below $25k, 5.0% for AGIs $50k-75k, 103.3% for AGIs $100k-200k)
Ordinary dividends: $5,467 (reported on 20.0% of returns)
Here:
$5,467
State:
$7,388
(% of AGI for various income ranges: 88.0% for AGIs below $25k, 946.7% for AGIs $100k-200k)
Net capital gain/loss in AGI: +$14,900 (reported on 16.7% of returns)
Here:
+$14,900
State:
+$19,475
(% of AGI for various income ranges: 14.0% for AGIs below $25k, 2460.0% for AGIs $100k-200k)
Profit/loss from business: +$5,475 (reported on 13.3% of returns)
Here:
+$5,475
State:
+$11,386
(% of AGI for various income ranges: 547.5% for AGIs $50k-75k)
Taxable individual retirement arrangement distribution: $19,100 (reported on 10.0% of returns)
40077:
$19,100
Kentucky:
$18,941
(% of AGI for various income ranges: 1432.5% for AGIs $50k-75k)
Total itemized deductions: $24,767 (reported on 10.0% of returns)
Here:
$24,767
State:
$32,473
(% of AGI for various income ranges: 3715.0% for AGIs $75k-100k)
Taxes paid: $7,633 (reported on 10.0% of returns)
40077:
$7,633
State:
$7,830
(% of AGI for various income ranges: 1145.0% for AGIs $75k-100k)
Earned income credit: $1,567 (reported on 10.0% of returns)
Here:
$1,567
State:
$2,336
(% of AGI for various income ranges: 94.0% for AGIs below $25k)
Percentage of individuals using paid preparers for their 2020 taxes: 90.0%
Here:
90%
State:
94%
(% for various income ranges: 88.9% for AGIs below $25k, 83.3% for AGIs $25k-50k, 100.0% for AGIs $50k-75k, 100.0% for AGIs $75k-100k, 85.7% for AGIs $100k-200k)
Averages for the 2012 tax year for zip code 40077, filed in 2013:
Average Adjusted Gross Income (AGI) in 2012: $57,518 (Individual Income Tax Returns)
Here:
$57,518
State:
$50,814
Salary/wage: $48,417 (reported on 85.7% of returns)
Here:
$48,417
State:
$42,723
(% of AGI for various income ranges: 79.5% for AGIs below $25k, 77.3% for AGIs $25k-50k, 71.3% for AGIs $50k-75k, 83.9% for AGIs $75k-100k, 64.9% for AGIs $100k-200k)
Taxable interest for individuals: $357 (reported on 25.0% of returns)
This zip code:
$357
Kentucky:
$1,381
(% of AGI for various income ranges: 0.3% for AGIs below $25k, 0.2% for AGIs $50k-75k, 0.2% for AGIs $100k-200k)
Ordinary dividends: $1,625 (reported on 14.3% of returns)
Here:
$1,625
State:
$6,239
Profit/loss from business: +$7,325 (reported on 14.3% of returns)
Here:
+$7,325
State:
+$10,862
Taxable individual retirement arrangement distribution: $16,300 (reported on 10.7% of returns)
40077:
$16,300
Kentucky:
$14,296
Total itemized deductions: $20,570 (22% of AGI, reported on 35.7% of returns)
Here:
$20,570
State:
$21,160
Here:
21.7% of AGI
State:
20.0% of AGI
Charity contributions: $3,425 (reported on 28.6% of returns)
Here:
$3,425
State:
$4,303
Taxes paid: $7,730 (reported on 35.7% of returns)
40077:
$7,730
State:
$8,496
Earned income credit: $2,000 (reported on 10.7% of returns)
Here:
$2,000
State:
$2,273
(% of AGI for various income ranges: 5.1% for AGIs below $25k)
Percentage of individuals using paid preparers for their 2012 taxes: 57.1%
Here:
57%
State:
60%
(% for various income ranges: 55.6% for AGIs below $25k, 50.0% for AGIs $25k-50k, 83.3% for AGIs $50k-75k, 75.0% for AGIs $100k-200k)
Averages for the 2004 tax year for zip code 40077, filed in 2005:
Average Adjusted Gross Income (AGI) in 2004: $45,405 (Individual Income Tax Returns)
Here:
$45,405
State:
$41,540
Salary/wage: $38,894 (reported on 87.3% of returns)
Here:
$38,894
State:
$36,432
(% of AGI for various income ranges: 78.7% for AGIs below $10k, 69.2% for AGIs $10k-25k, 81.0% for AGIs $25k-50k, 76.2% for AGIs $50k-75k, 83.9% for AGIs $75k-100k, 67.0% for AGIs over 100k)
Taxable interest for individuals: $570 (reported on 41.6% of returns)
This zip code:
$570
Kentucky:
$1,571
(% of AGI for various income ranges: 1.5% for AGIs below $10k, 0.9% for AGIs $10k-25k, 0.5% for AGIs $25k-50k, 0.6% for AGIs $50k-75k, 0.5% for AGIs over 100k)
Taxable dividends: $2,277 (reported on 16.2% of returns)
Here:
$2,277
State:
$3,453
(% of AGI for various income ranges: 1.5% for AGIs $10k-25k, 0.3% for AGIs $50k-75k, 2.0% for AGIs over 100k)
Net capital gain/loss: +$1,073 (reported on 14.1% of returns)
Here:
+$1,073
State:
+$9,663
(% of AGI for various income ranges: -1.0% for AGIs $10k-25k, 0.3% for AGIs $50k-75k, 1.0% for AGIs over 100k)
Profit/loss from business: +$4,491 (reported on 19.6% of returns)
Here:
+$4,491
State:
+$9,233
(% of AGI for various income ranges: 6.7% for AGIs $10k-25k, 2.2% for AGIs $25k-50k, 3.5% for AGIs $50k-75k, 0.4% for AGIs $75k-100k)
Total itemized deductions: $17,868 (23% of AGI, reported on 41.6% of returns)
Here:
$17,868
State:
$17,474
Here:
23.3% of AGI
State:
21.0% of AGI
(% of AGI for various income ranges: 17.4% for AGIs $25k-50k, 16.9% for AGIs $50k-75k, 21.2% for AGIs $75k-100k, 18.3% for AGIs over 100k)
Charity contributions deductions: $2,362 (3% of AGI, reported on 36.1% of returns)
Here:
$2,362
State:
$3,494
Here:
2.9% of AGI
State:
4.0% of AGI
(% of AGI for various income ranges: 1.3% for AGIs $25k-50k, 1.8% for AGIs $50k-75k, 2.3% for AGIs $75k-100k, 2.7% for AGIs over 100k)
Total tax: $5,508 (reported on 85.2% of returns)
40077:
$5,508
State:
$6,162
(% of AGI for various income ranges: 3.4% for AGIs below $10k, 5.2% for AGIs $10k-25k, 7.0% for AGIs $25k-50k, 8.4% for AGIs $50k-75k, 9.4% for AGIs $75k-100k, 16.4% for AGIs over 100k)
Earned income credit: $1,345 (reported on 10.0% of returns)
Here:
$1,345
State:
$1,723
Percentage of individuals using paid preparers for their 2004 taxes: 67.0%
Here:
67%
State:
66%
(% for various income ranges: 51.9% for AGIs below $10k, 58.9% for AGIs $10k-25k, 75.0% for AGIs $25k-50k, 71.4% for AGIs $50k-75k, 64.7% for AGIs $75k-100k, 80.8% for AGIs over 100k)
Streams, rivers, and creeks: Bells Branch (A), Phillips Branch (B), Sycamore Run (C), Caney Fork (D), Pattons Creek (E), Eighteenmile Creek (F). Display/hide their locations on the map
Size of family households: 81 2-persons, 74 3-persons, 25 4-persons, 7 5-persons
Size of nonfamily households: 79 1-person
56 married couples with children.
30 single-parent households (30 men).
97.2% of residents of 40077 zip code speak English at home.
2.6% of residents speak other Indo-European language at home (100% very well).
Foreign born population: 0 (0.0%)
:
0.0%
Whole state:
4.0%
43%American
13%English
13%German
5%Welsh
2%Scotch-Irish
1%British
1%Czech
Year of entry for the foreign-born population
02010 or later
02000 to 2009
01990 to 1999
14Before 1990
Housing units lacking complete kitchen facilities: 4.9%
82.4%Electricity
11.7%Bottled, tank, or LP gas
3.9%Wood
2.3%Fuel oil, kerosene, etc.
Population in 1990: 500.
Place of birth for U.S.-born residents:
This state: 462
Northeast: 17
Midwest: 16
South: 7
West: 28
67% of the 40077 zip code residents lived in the same house 5 years ago. Out of people who lived in different houses, 38% lived in this county. Out of people who lived in different counties, 50% lived in Kentucky.
100% of the 40077 zip code residents lived in the same house 1 year ago.
Private vs. public school enrollment:
Students in private schools in grades 1 to 8 (elementary and middle school):
Here:
0.0%
Kentucky:
17.2%
Students in private schools in grades 9 to 12 (high school):
Here:
0.0%
Kentucky:
15.2%
Students in private undergraduate colleges:
Here:
0.0%
Kentucky:
19.6%
Occupation by median earnings in the past 12 months ($)
87,287Health diagnosing and treating practitioners and other technical occupations
76,400Production occupations
61,243Computer and mathematical occupations
49,838Office and administrative support occupations
47,405Management occupations
38,148Material moving occupations
Top industries in this zip code by the number of employees in 2005:
Accommodation and Food Services: Full-Service Restaurants (10-19 employees: 1 establishment)
Information: Periodical Publishers (5-9: 1)
Construction: Site Preparation Contractors (5-9: 1)
Professional, Scientific, and Technical Services: Display Advertising (1-4: 1)
Other Services (except Public Administration): Religious Organizations (1-4: 1)
Accommodation and Food Services: Caterers (1-4: 1)
Other Services (except Public Administration): Other Personal and Household Goods Repair and Maintenance (1-4: 1)
Administrative and Support and Waste Management and Remediation Services: Temporary Help Services (1-4: 1)
Construction: Electrical Contractors (1-4: 1)
Fatal accident statistics in 2010:
Fatal accident count: 1
Vehicles involved in fatal accidents: 1
Fatal accidents caused by drunken drivers: 0
Fatalities: 1
Persons involved in fatal accidents: 2
Pedestrians involved in fatal accidents: 0
Home Mortgage Disclosure Act Aggregated Statistics For Year 2009 (Based on 2 partial tracts)
A) FHA, FSA/RHS & VA Home Purchase Loans
B) Conventional Home Purchase Loans
C) Refinancings
D) Home Improvement Loans
F) Non-occupant Loans on < 5 Family Dwellings (A B C & D)
G) Loans On Manufactured Home Dwelling (A B C & D)
Number
Average Value
Number
Average Value
Number
Average Value
Number
Average Value
Number
Average Value
Number
Average Value
LOANS ORIGINATED
3
$138,963
4
$320,930
25
$216,609
2
$77,195
2
$112,570
2
$77,360
APPLICATIONS APPROVED, NOT ACCEPTED
0
$0
0
$0
3
$184,917
1
$33,720
0
$0
0
$0
APPLICATIONS DENIED
1
$75,710
1
$185,470
13
$206,116
1
$12,230
0
$0
1
$59,840
APPLICATIONS WITHDRAWN
1
$119,020
1
$234,060
5
$221,040
0
$0
0
$0
0
$0
FILES CLOSED FOR INCOMPLETENESS
1
$69,760
0
$0
4
$228,610
0
$0
0
$0
1
$106,120
Aggregated Statistics For Year 2008 (Based on 2 partial tracts)
A) FHA, FSA/RHS & VA Home Purchase Loans
B) Conventional Home Purchase Loans
C) Refinancings
D) Home Improvement Loans
F) Non-occupant Loans on < 5 Family Dwellings (A B C & D)
G) Loans On Manufactured Home Dwelling (A B C & D)
Number
Average Value
Number
Average Value
Number
Average Value
Number
Average Value
Number
Average Value
Number
Average Value
LOANS ORIGINATED
1
$150,090
5
$233,998
15
$211,694
3
$39,783
1
$105,790
0
$0
APPLICATIONS APPROVED, NOT ACCEPTED
0
$0
0
$0
3
$271,203
1
$35,700
0
$0
0
$0
APPLICATIONS DENIED
1
$75,050
2
$96,700
7
$207,711
1
$36,370
0
$0
2
$55,045
APPLICATIONS WITHDRAWN
0
$0
0
$0
5
$159,350
0
$0
0
$0
0
$0
FILES CLOSED FOR INCOMPLETENESS
0
$0
0
$0
1
$111,080
0
$0
0
$0
0
$0
Aggregated Statistics For Year 2007 (Based on 2 partial tracts)
A) FHA, FSA/RHS & VA Home Purchase Loans
B) Conventional Home Purchase Loans
C) Refinancings
D) Home Improvement Loans
F) Non-occupant Loans on < 5 Family Dwellings (A B C & D)
G) Loans On Manufactured Home Dwelling (A B C & D)
Number
Average Value
Number
Average Value
Number
Average Value
Number
Average Value
Number
Average Value
Number
Average Value
LOANS ORIGINATED
1
$88,600
13
$231,649
23
$179,976
4
$50,830
2
$121,990
3
$53,777
APPLICATIONS APPROVED, NOT ACCEPTED
0
$0
1
$156,040
3
$119,897
0
$0
0
$0
1
$44,960
APPLICATIONS DENIED
0
$0
1
$108,110
12
$173,510
2
$106,950
0
$0
1
$60,500
APPLICATIONS WITHDRAWN
0
$0
2
$234,560
2
$143,315
0
$0
0
$0
0
$0
FILES CLOSED FOR INCOMPLETENESS
0
$0
0
$0
0
$0
0
$0
0
$0
0
$0
Aggregated Statistics For Year 2006 (Based on 2 partial tracts)
A) FHA, FSA/RHS & VA Home Purchase Loans
B) Conventional Home Purchase Loans
C) Refinancings
D) Home Improvement Loans
F) Non-occupant Loans on < 5 Family Dwellings (A B C & D)
G) Loans On Manufactured Home Dwelling (A B C & D)
Number
Average Value
Number
Average Value
Number
Average Value
Number
Average Value
Number
Average Value
Number
Average Value
LOANS ORIGINATED
1
$151,410
14
$215,906
20
$182,806
4
$76,865
2
$284,975
2
$68,105
APPLICATIONS APPROVED, NOT ACCEPTED
0
$0
3
$151,747
5
$181,764
1
$56,860
1
$191,750
1
$62,150
APPLICATIONS DENIED
0
$0
4
$202,492
10
$180,078
3
$71,960
1
$283,650
1
$99,510
APPLICATIONS WITHDRAWN
0
$0
1
$361,350
6
$220,180
0
$0
0
$0
0
$0
FILES CLOSED FOR INCOMPLETENESS
0
$0
0
$0
2
$231,750
0
$0
0
$0
0
$0
Aggregated Statistics For Year 2005 (Based on 2 partial tracts)
B) Conventional Home Purchase Loans
C) Refinancings
D) Home Improvement Loans
F) Non-occupant Loans on < 5 Family Dwellings (A B C & D)
G) Loans On Manufactured Home Dwelling (A B C & D)
Number
Average Value
Number
Average Value
Number
Average Value
Number
Average Value
Number
Average Value
LOANS ORIGINATED
13
$186,636
32
$215,438
3
$101,383
2
$156,540
1
$68,760
APPLICATIONS APPROVED, NOT ACCEPTED
2
$342,170
3
$171,140
0
$0
0
$0
0
$0
APPLICATIONS DENIED
2
$138,520
16
$153,378
2
$38,185
1
$90,580
2
$93,395
APPLICATIONS WITHDRAWN
1
$212,580
7
$162,136
1
$447,960
1
$71,410
1
$39,340
FILES CLOSED FOR INCOMPLETENESS
1
$272,410
1
$469,780
0
$0
0
$0
0
$0
Aggregated Statistics For Year 2004 (Based on 2 partial tracts)
B) Conventional Home Purchase Loans
C) Refinancings
D) Home Improvement Loans
F) Non-occupant Loans on < 5 Family Dwellings (A B C & D)
G) Loans On Manufactured Home Dwelling (A B C & D)
Number
Average Value
Number
Average Value
Number
Average Value
Number
Average Value
Number
Average Value
LOANS ORIGINATED
8
$175,384
28
$165,867
2
$33,720
3
$117,473
1
$71,080
APPLICATIONS APPROVED, NOT ACCEPTED
4
$178,028
3
$169,157
2
$39,670
0
$0
2
$51,905
APPLICATIONS DENIED
4
$143,728
16
$163,213
2
$90,420
1
$72,400
4
$85,295
APPLICATIONS WITHDRAWN
2
$219,355
9
$174,116
0
$0
0
$0
1
$117,360
FILES CLOSED FOR INCOMPLETENESS
1
$62,810
1
$151,750
0
$0
0
$0
0
$0
Aggregated Statistics For Year 2003 (Based on 2 partial tracts)
A) FHA, FSA/RHS & VA Home Purchase Loans
B) Conventional Home Purchase Loans
C) Refinancings
D) Home Improvement Loans
F) Non-occupant Loans on < 5 Family Dwellings (A B C & D)
Number
Average Value
Number
Average Value
Number
Average Value
Number
Average Value
Number
Average Value
LOANS ORIGINATED
1
$122,980
8
$171,375
69
$158,444
3
$58,517
2
$102,485
APPLICATIONS APPROVED, NOT ACCEPTED
0
$0
1
$303,160
8
$130,174
1
$37,360
0
$0
APPLICATIONS DENIED
0
$0
3
$160,120
17
$124,364
2
$11,900
0
$0
APPLICATIONS WITHDRAWN
0
$0
1
$114,060
11
$190,515
1
$20,170
0
$0
FILES CLOSED FOR INCOMPLETENESS
0
$0
0
$0
6
$149,707
0
$0
0
$0
Aggregated Statistics For Year 2002 (Based on 2 partial tracts)
A) FHA, FSA/RHS & VA Home Purchase Loans
B) Conventional Home Purchase Loans
C) Refinancings
D) Home Improvement Loans
F) Non-occupant Loans on < 5 Family Dwellings (A B C & D)
Number
Average Value
Number
Average Value
Number
Average Value
Number
Average Value
Number
Average Value
LOANS ORIGINATED
1
$121,660
11
$179,756
48
$156,319
2
$16,860
2
$166,455
APPLICATIONS APPROVED, NOT ACCEPTED
0
$0
2
$137,530
7
$153,399
1
$17,520
0
$0
APPLICATIONS DENIED
1
$76,370
3
$241,890
11
$127,822
2
$32,235
0
$0
APPLICATIONS WITHDRAWN
1
$92,240
1
$184,470
10
$153,696
1
$38,020
0
$0
FILES CLOSED FOR INCOMPLETENESS
0
$0
1
$65,460
2
$125,795
0
$0
0
$0
Aggregated Statistics For Year 2001 (Based on 2 partial tracts)
A) FHA, FSA/RHS & VA Home Purchase Loans
B) Conventional Home Purchase Loans
C) Refinancings
D) Home Improvement Loans
F) Non-occupant Loans on < 5 Family Dwellings (A B C & D)
Number
Average Value
Number
Average Value
Number
Average Value
Number
Average Value
Number
Average Value
LOANS ORIGINATED
2
$107,775
11
$171,131
43
$131,525
5
$35,572
2
$125,960
APPLICATIONS APPROVED, NOT ACCEPTED
0
$0
1
$48,930
7
$87,656
0
$0
0
$0
APPLICATIONS DENIED
0
$0
4
$97,692
10
$92,535
1
$19,840
0
$0
APPLICATIONS WITHDRAWN
0
$0
2
$143,975
8
$118,644
0
$0
0
$0
FILES CLOSED FOR INCOMPLETENESS
0
$0
0
$0
2
$146,455
0
$0
0
$0
Aggregated Statistics For Year 2000 (Based on 2 partial tracts)
A) FHA, FSA/RHS & VA Home Purchase Loans
B) Conventional Home Purchase Loans
C) Refinancings
D) Home Improvement Loans
F) Non-occupant Loans on < 5 Family Dwellings (A B C & D)
Number
Average Value
Number
Average Value
Number
Average Value
Number
Average Value
Number
Average Value
LOANS ORIGINATED
2
$101,165
9
$141,864
18
$113,322
6
$25,070
1
$170,590
APPLICATIONS APPROVED, NOT ACCEPTED
0
$0
2
$120,670
5
$75,442
3
$9,807
0
$0
APPLICATIONS DENIED
0
$0
8
$72,608
12
$142,737
3
$15,317
0
$0
APPLICATIONS WITHDRAWN
0
$0
1
$163,320
5
$98,518
1
$8,600
1
$72,400
FILES CLOSED FOR INCOMPLETENESS
0
$0
0
$0
1
$110,750
0
$0
0
$0
Aggregated Statistics For Year 1999 (Based on 1 partial tract)
A) FHA, FSA/RHS & VA Home Purchase Loans
B) Conventional Home Purchase Loans
C) Refinancings
D) Home Improvement Loans
F) Non-occupant Loans on < 5 Family Dwellings (A B C & D)


 Nearest zip codes: 47104, 47162, 40031, 40026, 40055, 40010.


