Estimated zip code population in 2022: 1,761 Zip code population in 2010: 1,813 Zip code population in 2000: 1,629
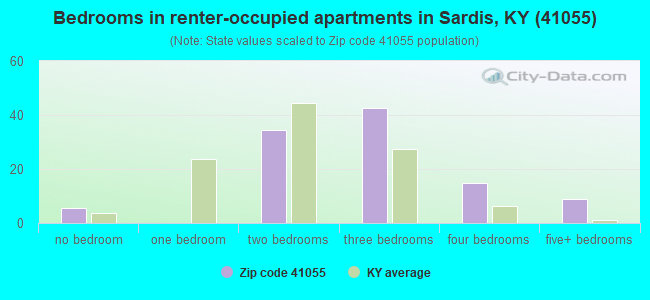
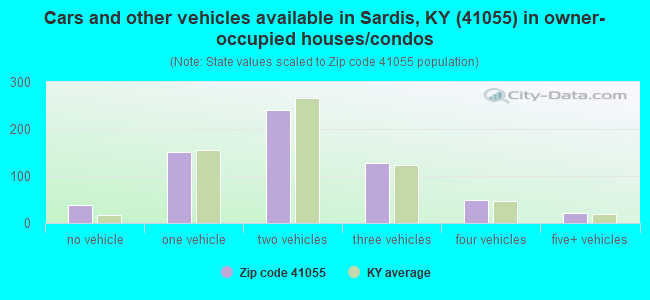
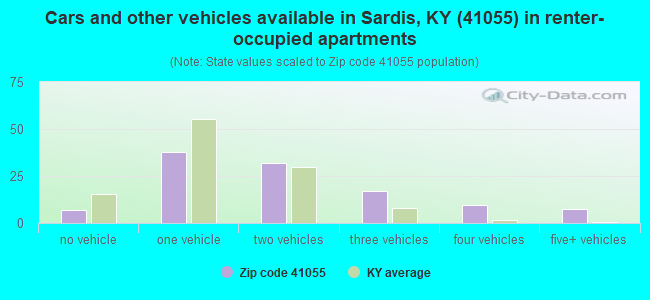
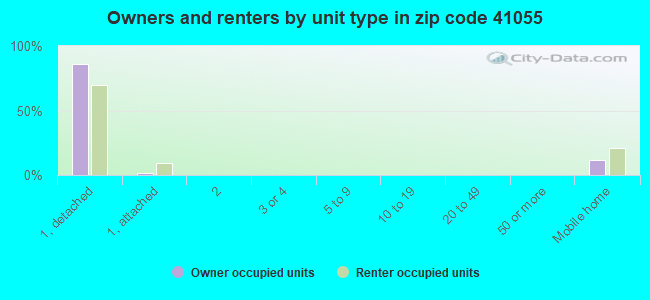
Houses and condos: 965 Renter-occupied apartments: 111
% of renters here:
15%
State:
31%
March 2022 cost of living index in zip code 41055: 80.1 (low, U.S. average is 100)
Land area: 63.0 sq. mi. Water area: 0.2 sq. mi.
Population density: 28 people per square mile
(very low).
OSM Map
General Map
Google Map
MSN Map
OSM Map
General Map
Google Map
MSN Map
OSM Map
General Map
Google Map
MSN Map
OSM Map
General Map
Google Map
MSN Map
Please wait while loading the map...
Real estate property taxes paid for housing units in 2022:
This zip code:
0.4% ($879)
Kentucky:
0.7% ($1,456)
Median real estate property taxes paid for housing units with mortgages in 2022: $1,060 (0.3%) Median real estate property taxes paid for housing units with no mortgage in 2022: $663 (0.8%)
Business Search- 14 Million verified businesses
Males: 903
(51.3%)
Females: 857
(48.7%)
For population 25 years and over in 41055:
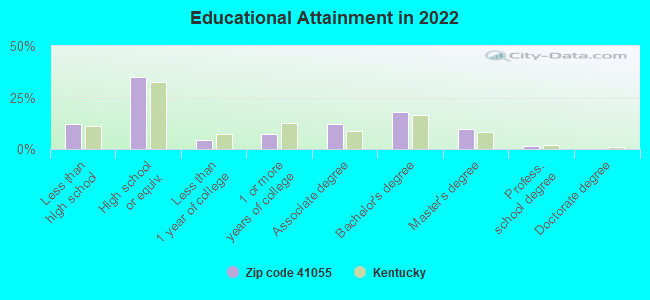
High school or higher: 87.7%
Bachelor's degree or higher: 29.0%
Graduate or professional degree: 11.3%
Unemployed: 1.1%
Mean travel time to work (commute): 32.0 minutes
For population 15 years and over in 41055:
Never married: 23.5%
Now married: 61.8%
Separated: 1.8%
Widowed: 9.7%
Divorced: 3.3%
Zip code 41055 compared to state average:
Unemployed percentage significantly below state average.
Black race population percentage significantly below state average.
Foreign-born population percentage significantly below state average.
Renting percentage below state average.
Length of stay since moving in significantly above state average.
Averages for the 2020 tax year for zip code 41055, filed in 2021:
Average Adjusted Gross Income (AGI) in 2020: $55,649 (Individual Income Tax Returns)
Here:
$55,649
State:
$61,342
Salary/wage: $48,872 (reported on 77.3% of returns)
Here:
$48,872
State:
$50,827
(% of AGI for various income ranges: 1205.6% for AGIs below $25k, 3800.0% for AGIs $25k-50k, 6241.7% for AGIs $50k-75k, 7620.0% for AGIs $75k-100k, 22570.0% for AGIs $100k-200k)
Taxable interest for individuals: $891 (reported on 30.7% of returns)
This zip code:
$891
Kentucky:
$1,441
(% of AGI for various income ranges: 33.8% for AGIs below $25k, 10.0% for AGIs $25k-50k, 131.7% for AGIs $50k-75k, 34.0% for AGIs $75k-100k, 68.3% for AGIs $100k-200k)
Ordinary dividends: $2,855 (reported on 14.7% of returns)
Here:
$2,855
State:
$7,388
(% of AGI for various income ranges: 31.2% for AGIs below $25k, 44.3% for AGIs $25k-50k, 138.3% for AGIs $50k-75k, 198.3% for AGIs $100k-200k)
Net capital gain/loss in AGI: +$4,723 (reported on 17.3% of returns)
Here:
+$4,723
State:
+$19,475
(% of AGI for various income ranges: 34.4% for AGIs below $25k, 75.0% for AGIs $25k-50k, 476.7% for AGIs $50k-75k, 280.0% for AGIs $100k-200k)
Profit/loss from business: +$21,333 (reported on 20.0% of returns)
Here:
+$21,333
State:
+$11,386
(% of AGI for various income ranges: 126.2% for AGIs below $25k, 324.3% for AGIs $25k-50k, 2200.0% for AGIs $50k-75k, 2040.0% for AGIs $100k-200k)
Taxable individual retirement arrangement distribution: $21,817 (reported on 8.0% of returns)
41055:
$21,817
Kentucky:
$18,941
(% of AGI for various income ranges: 103.1% for AGIs below $25k, 711.7% for AGIs $50k-75k, 1195.0% for AGIs $100k-200k)
Total itemized deductions: $31,000 (reported on 2.7% of returns)
Here:
$31,000
State:
$32,473
(% of AGI for various income ranges: 442.9% for AGIs $25k-50k)
Earned income credit: $2,114 (reported on 18.7% of returns)
Here:
$2,114
State:
$2,336
(% of AGI for various income ranges: 115.6% for AGIs below $25k, 79.3% for AGIs $25k-50k)
Percentage of individuals using paid preparers for their 2020 taxes: 93.3%
Here:
93%
State:
94%
(% for various income ranges: 88.9% for AGIs below $25k, 94.7% for AGIs $25k-50k, 100.0% for AGIs $50k-75k, 100.0% for AGIs $75k-100k, 90.0% for AGIs $100k-200k, 100.0% for AGIs over 200k)
Averages for the 2012 tax year for zip code 41055, filed in 2013:
Average Adjusted Gross Income (AGI) in 2012: $47,840 (Individual Income Tax Returns)
Here:
$47,840
State:
$50,814
Salary/wage: $44,050 (reported on 77.8% of returns)
Here:
$44,050
State:
$42,723
(% of AGI for various income ranges: 66.9% for AGIs below $25k, 72.7% for AGIs $25k-50k, 74.8% for AGIs $50k-75k, 78.9% for AGIs $75k-100k, 67.4% for AGIs $100k-200k)
Taxable interest for individuals: $780 (reported on 34.7% of returns)
This zip code:
$780
Kentucky:
$1,381
(% of AGI for various income ranges: 2.0% for AGIs below $25k, 0.5% for AGIs $25k-50k, 0.6% for AGIs $50k-75k, 0.4% for AGIs $75k-100k, 0.3% for AGIs $100k-200k)
Ordinary dividends: $2,330 (reported on 13.9% of returns)
Here:
$2,330
State:
$6,239
(% of AGI for various income ranges: 1.0% for AGIs below $25k, 0.3% for AGIs $25k-50k, 1.5% for AGIs $50k-75k, 0.7% for AGIs $100k-200k)
Net capital gain/loss in AGI: +$8,162 (reported on 18.1% of returns)
Here:
+$8,162
State:
+$11,336
(% of AGI for various income ranges: 2.2% for AGIs below $25k, 1.7% for AGIs $25k-50k, 4.0% for AGIs $50k-75k, 5.1% for AGIs $100k-200k)
Profit/loss from business: +$14,857 (reported on 19.4% of returns)
Here:
+$14,857
State:
+$10,862
(% of AGI for various income ranges: 15.7% for AGIs below $25k, 8.8% for AGIs $25k-50k, 15.2% for AGIs $75k-100k)
Taxable individual retirement arrangement distribution: $11,867 (reported on 8.3% of returns)
41055:
$11,867
Kentucky:
$14,296
Total itemized deductions: $19,261 (20% of AGI, reported on 25.0% of returns)
Here:
$19,261
State:
$21,160
Here:
20.3% of AGI
State:
20.0% of AGI
(% of AGI for various income ranges: 7.2% for AGIs $25k-50k, 7.9% for AGIs $50k-75k, 12.9% for AGIs $75k-100k, 14.2% for AGIs $100k-200k)
Charity contributions: $3,425 (reported on 16.7% of returns)
Here:
$3,425
State:
$4,303
(% of AGI for various income ranges: 1.8% for AGIs below $25k, 1.0% for AGIs $50k-75k, 1.1% for AGIs $75k-100k, 1.8% for AGIs $100k-200k)
Taxes paid: $7,389 (reported on 25.0% of returns)
41055:
$7,389
State:
$8,496
(% of AGI for various income ranges: 1.7% for AGIs $25k-50k, 2.3% for AGIs $50k-75k, 4.7% for AGIs $75k-100k, 6.4% for AGIs $100k-200k)
Earned income credit: $2,014 (reported on 19.4% of returns)
Here:
$2,014
State:
$2,273
(% of AGI for various income ranges: 5.6% for AGIs below $25k, 1.1% for AGIs $25k-50k)
Percentage of individuals using paid preparers for their 2012 taxes: 69.4%
Here:
69%
State:
60%
(% for various income ranges: 66.7% for AGIs below $25k, 76.5% for AGIs $25k-50k, 60.0% for AGIs $50k-75k, 71.4% for AGIs $75k-100k, 75.0% for AGIs $100k-200k)
Averages for the 2004 tax year for zip code 41055, filed in 2005:
Average Adjusted Gross Income (AGI) in 2004: $35,618 (Individual Income Tax Returns)
Here:
$35,618
State:
$41,540
Salary/wage: $33,913 (reported on 81.0% of returns)
Here:
$33,913
State:
$36,432
(% of AGI for various income ranges: 149.6% for AGIs below $10k, 76.8% for AGIs $10k-25k, 79.9% for AGIs $25k-50k, 75.6% for AGIs $50k-75k, 84.8% for AGIs $75k-100k, 61.7% for AGIs over 100k)
Taxable interest for individuals: $1,151 (reported on 44.6% of returns)
This zip code:
$1,151
Kentucky:
$1,571
(% of AGI for various income ranges: 15.1% for AGIs below $10k, 3.0% for AGIs $10k-25k, 0.8% for AGIs $25k-50k, 1.9% for AGIs $50k-75k, 0.8% for AGIs $75k-100k, 0.2% for AGIs over 100k)
Taxable dividends: $2,016 (reported on 19.0% of returns)
Here:
$2,016
State:
$3,453
(% of AGI for various income ranges: 4.0% for AGIs below $10k, 0.5% for AGIs $10k-25k, 1.3% for AGIs $25k-50k, 2.2% for AGIs $50k-75k, 0.2% for AGIs $75k-100k, 0.8% for AGIs over 100k)
Net capital gain/loss: +$4,336 (reported on 18.3% of returns)
Here:
+$4,336
State:
+$9,663
(% of AGI for various income ranges: 1.5% for AGIs below $10k, 2.8% for AGIs $10k-25k, 2.9% for AGIs $25k-50k, 2.7% for AGIs $50k-75k, 1.7% for AGIs $75k-100k, 1.1% for AGIs over 100k)
Profit/loss from business: +$6,556 (reported on 16.2% of returns)
Here:
+$6,556
State:
+$9,233
(% of AGI for various income ranges: -0.8% for AGIs below $10k, 6.3% for AGIs $10k-25k, 1.3% for AGIs $25k-50k, 1.6% for AGIs $50k-75k, 7.3% for AGIs $75k-100k)
Total itemized deductions: $15,993 (22% of AGI, reported on 22.3% of returns)
Here:
$15,993
State:
$17,474
Here:
22.0% of AGI
State:
21.0% of AGI
(% of AGI for various income ranges: 4.7% for AGIs $10k-25k, 7.3% for AGIs $25k-50k, 11.7% for AGIs $50k-75k, 13.1% for AGIs $75k-100k, 12.8% for AGIs over 100k)
Charity contributions deductions: $2,602 (3% of AGI, reported on 18.4% of returns)
Here:
$2,602
State:
$3,494
Here:
3.4% of AGI
State:
4.0% of AGI
(% of AGI for various income ranges: 3.5% for AGIs below $10k, 1.2% for AGIs $25k-50k, 1.2% for AGIs $50k-75k, 1.3% for AGIs $75k-100k, 2.4% for AGIs over 100k)
Total tax: $4,548 (reported on 72.9% of returns)
41055:
$4,548
State:
$6,162
(% of AGI for various income ranges: 10.1% for AGIs below $10k, 4.4% for AGIs $10k-25k, 6.3% for AGIs $25k-50k, 8.4% for AGIs $50k-75k, 9.9% for AGIs $75k-100k, 16.4% for AGIs over 100k)
Earned income credit: $1,653 (reported on 22.5% of returns)
Here:
$1,653
State:
$1,723
Percentage of individuals using paid preparers for their 2004 taxes: 79.2%
Here:
79%
State:
66%
(% for various income ranges: 81.2% for AGIs below $10k, 76.8% for AGIs $10k-25k, 80.0% for AGIs $25k-50k, 75.6% for AGIs $50k-75k, 77.2% for AGIs $75k-100k, 90.6% for AGIs over 100k)
Likely homosexual households (counted as self-reported same-sex unmarried-partner households)
Lesbian couples: 0.0% of all households
Gay men: 0.6% of all households
Household received Food Stamps/SNAP in the past 12 months: 134 Household did not receive Food Stamps/SNAP in the past 12 months: 603
Women who had a birth in the past 12 months: 10 (10 now married, 0 unmarried) Women who did not have a birth in the past 12 months: 342 (209 now married, 134 unmarried)
Housing units in zip code 41055 with a mortgage: 356 (23 second mortgage, 12 both second mortgage and home equity loan) Houses without a mortgage: 4
Median monthly owner costs for units with a mortgage: $1,386 Median monthly owner costs for units without a mortgage: $344
Residents with income below the poverty level in 2022:
This zip code:
19.5%
Whole state:
16.5%
Residents with income below 50% of the poverty level in 2022:
This zip code:
13.5%
Whole state:
9.0%
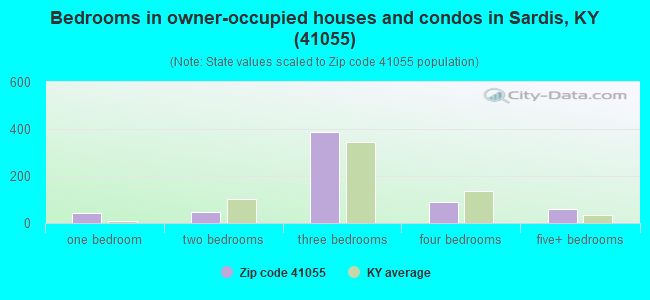
Median number of rooms in houses and condos:
Here:
7.1
State:
6.4
Median number of rooms in apartments:
Here:
5.1
State:
4.4
Notable locations in this zip code not listed on our city pages
Notable locations in zip code 41055: Sardis Volunteer Fire Department (A), May's Lick Volunteer Fire Department (B). Display/hide their locations on the map
Streams, rivers, and creeks: Clarks Run (A), Smith Branch (B), Plugtown Branch (C), Shannon Creek (D), Flat Fork (E). Display/hide their locations on the map
Size of family households: 313 2-persons, 72 3-persons, 70 4-persons, 19 5-persons, 18 6-persons, 24 7-or-more-persons
Size of nonfamily households: 216 1-person, 1 2-persons
403 married couples with children.
1 single-parent households (1 men).
90.6% of residents of 41055 zip code speak English at home.
3.7% of residents speak Spanish at home (46% very well, 54% well).
5.7% of residents speak other Indo-European language at home (57% very well, 43% well).
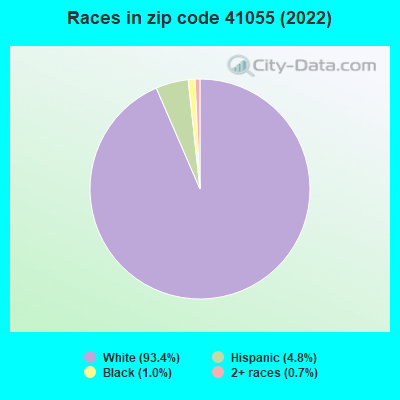
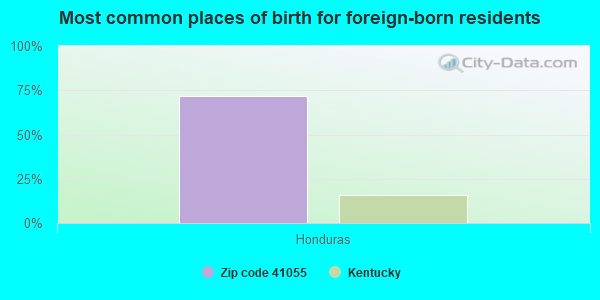
Foreign born population: 24 (1.4%) (25.6% of them are naturalized citizens)
This zip code:
1.4%
Whole state:
4.0%
72%Honduras
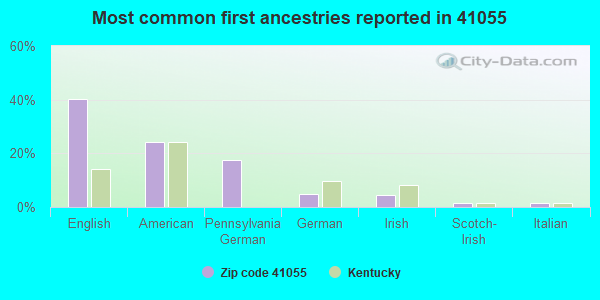
40%English
24%American
18%Pennsylvania German
5%German
5%Irish
2%Scotch-Irish
1%Italian
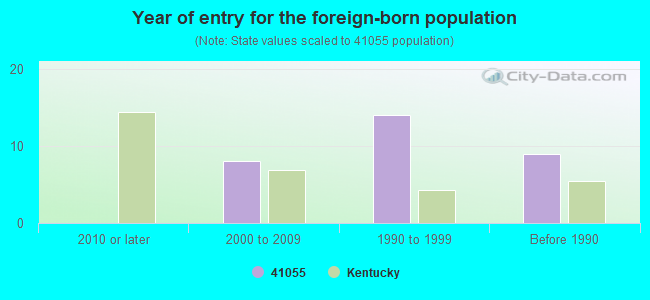
Year of entry for the foreign-born population
02010 or later
82000 to 2009
141990 to 1999
9Before 1990
Facilities with environmental interests located in this zip code:
COLLINS ESTATE (5036 MAIN ST in MAYSLICK, KY)
(Resource Conservation and Recovery Act (tracking hazardous waste)) Organizations: BILL COLLINS (CONTACT/OWNER)
MAYSLICK HERITAGE APTS (5016 MAIN ST in MAYSLICK, KY)
National Pollutant Discharge Elimination System NON-MAJOR (Tracking pollutant discharge elimination systems) - permit Business SIC classification: OPERATORS OF APARTMENT BUILDINGS
Housing units lacking complete kitchen facilities: 1.4%
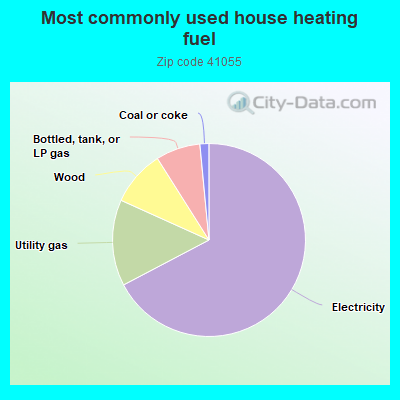
67.5%Electricity
14.5%Utility gas
9.3%Wood
7.5%Bottled, tank, or LP gas
1.5%Coal or coke
Population in 1990: 1,786.
Place of birth for U.S.-born residents:
This state: 1,373
Northeast: 57
Midwest: 208
South: 77
69% of the 41055 zip code residents lived in the same house 5 years ago. Out of people who lived in different houses, 65% lived in this county. Out of people who lived in different counties, 50% lived in Kentucky.
98% of the 41055 zip code residents lived in the same house 1 year ago. Out of people who lived in different houses, 84% moved from this county. Out of people who lived in different houses, 26% moved from different state.
Private vs. public school enrollment:
Students in private schools in grades 1 to 8 (elementary and middle school): 42
Here:
17.8%
Kentucky:
17.2%
Students in private schools in grades 9 to 12 (high school): 8
Here:
10.3%
Kentucky:
15.2%
Students in private undergraduate colleges: 12
Here:
29.1%
Kentucky:
19.6%
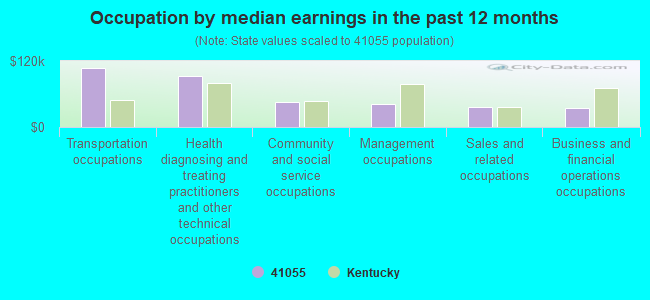
Occupation by median earnings in the past 12 months ($)
107,671Transportation occupations
92,540Health diagnosing and treating practitioners and other technical occupations
46,278Community and social service occupations
42,512Management occupations
37,190Sales and related occupations
33,773Business and financial operations occupations
Top industries in this zip code by the number of employees in 2005:
Health Care and Social Assistance: Child Day Care Services (5-9 employees: 1 establishment)
Other Services (except Public Administration): Religious Organizations (1-4: 2)
Administrative and Support and Waste Management and Remediation Services: All Other Support Services (1-4: 1)
Other Services (except Public Administration): General Automotive Repair (1-4: 1)
Other Services (except Public Administration): Civic and Social Organizations (1-4: 1)
People in group quarters in 2000:
4 people in nursing homes
Fatal accident statistics in 2013:
Fatal accident count: 1
Vehicles involved in fatal accidents: 3
Fatal accidents caused by drunken drivers: 0
Fatalities: 2
Persons involved in fatal accidents: 9
Pedestrians involved in fatal accidents: 0
Fatal accident statistics in 2012:
Fatal accident count: 1
Vehicles involved in fatal accidents: 1
Fatal accidents caused by drunken drivers: 1
Fatalities: 1
Persons involved in fatal accidents: 1
Pedestrians involved in fatal accidents: 0
2002 - 2018 National Fire Incident Reporting System (NFIRS) incidents
According to the data from the years 2002 - 2018 the average number of fire incidents per year is 12. The highest number of reported fire incidents - 19 took place in 2010, and the least - 2 in 2018. The data has a declining trend.
When looking into fire subcategories, the most incidents belonged to: Structure Fires (48.5%), and Outside Fires (31.0%).
Fire incident types reported to NFIRS in Zip Code 41055


 Nearest zip codes: 41039, 41056, 41044, 41062, 41041, 41064.
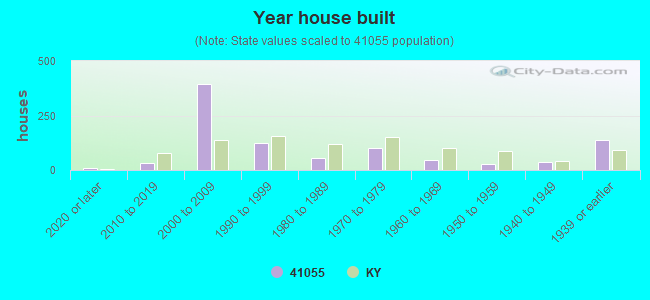


 According to the data from the years 2002 - 2018 the average number of fire incidents per year is 12. The highest number of reported fire incidents - 19 took place in 2010, and the least - 2 in 2018. The data has a declining trend.
 When looking into fire subcategories, the most incidents belonged to: Structure Fires (48.5%), and Outside Fires (31.0%).