Estimated zip code population in 2022: 2,673 Zip code population in 2010: 3,378 Zip code population in 2000: 3,873
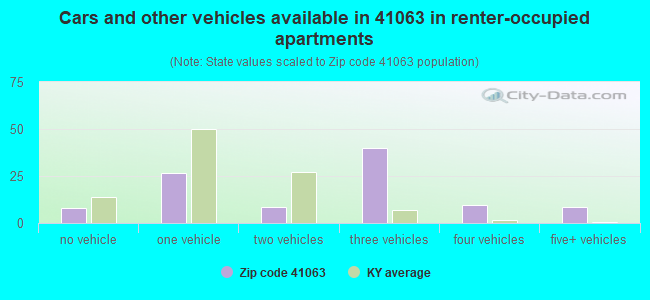
Houses and condos: 1,108 Renter-occupied apartments: 100
% of renters here:
9%
State:
31%
March 2022 cost of living index in zip code 41063: 80.1 (low, U.S. average is 100)
Land area: 36.1 sq. mi. Water area: 0.6 sq. mi.
Population density: 74 people per square mile
(very low).
OSM Map
General Map
Google Map
MSN Map
OSM Map
General Map
Google Map
MSN Map
OSM Map
General Map
Google Map
MSN Map
OSM Map
General Map
Google Map
MSN Map
Please wait while loading the map...
Real estate property taxes paid for housing units in 2022:
This zip code:
0.9% ($1,723)
Kentucky:
0.7% ($1,456)
Median real estate property taxes paid for housing units with mortgages in 2022: $1,890 (0.9%) Median real estate property taxes paid for housing units with no mortgage in 2022: $1,416 (0.9%)
Business Search- 14 Million verified businesses
Males: 1,304
(48.8%)
Females: 1,369
(51.2%)
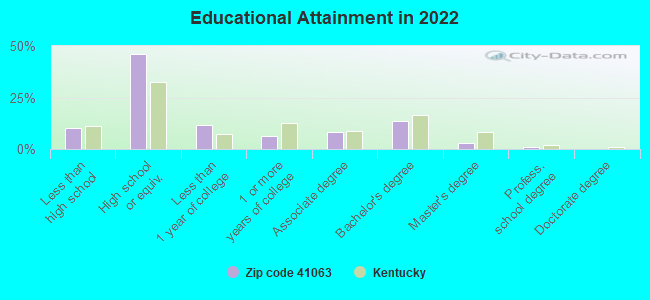
For population 25 years and over in 41063:
High school or higher: 90.1%
Bachelor's degree or higher: 17.6%
Graduate or professional degree: 4.1%
Unemployed: 3.7%
Mean travel time to work (commute): 36.0 minutes
For population 15 years and over in 41063:
Never married: 18.4%
Now married: 65.9%
Separated: 0.0%
Widowed: 9.4%
Divorced: 6.3%
Zip code 41063 compared to state average:
Black race population percentage significantly below state average.
Hispanic race population percentage below state average.
Median age above state average.
Foreign-born population percentage significantly below state average.
Renting percentage significantly below state average.
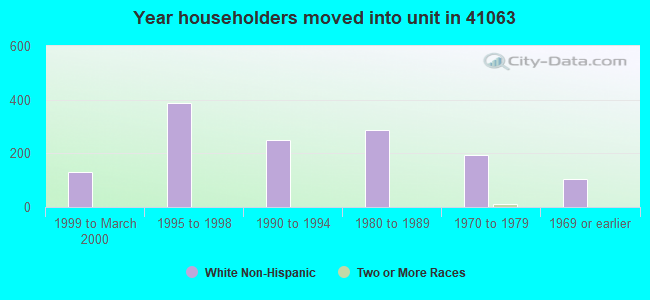
Length of stay since moving in significantly above state average.
Number of college students significantly below state average.
Estimated median house/condo value in 2022: $198,407
41063:
$198,407
Kentucky:
$196,300
According to our research of Kentucky and other state lists, there were 3 registered sex offenders living in 41063 zip code as of June 16, 2024. The ratio of all residents to sex offenders in zip code 41063 is 1,116 to 1. The ratio of registered sex offenders to all residents in this zip code is much lower than the state average.
Median resident age:
This zip code:
44.8 years
Kentucky median age:
39.4 years
Average household size:
This zip code:
2.5 people
Kentucky:
2.4 people
Averages for the 2020 tax year for zip code 41063, filed in 2021:
Average Adjusted Gross Income (AGI) in 2020: $69,560 (Individual Income Tax Returns)
Here:
$69,560
State:
$61,342
Salary/wage: $58,352 (reported on 84.2% of returns)
Here:
$58,352
State:
$50,827
(% of AGI for various income ranges: 1147.9% for AGIs below $25k, 3746.9% for AGIs $25k-50k, 5838.9% for AGIs $50k-75k, 8745.7% for AGIs $75k-100k, 13050.5% for AGIs $100k-200k)
Taxable interest for individuals: $843 (reported on 24.0% of returns)
This zip code:
$843
Kentucky:
$1,441
(% of AGI for various income ranges: 7.9% for AGIs below $25k, 10.3% for AGIs $25k-50k, 16.7% for AGIs $50k-75k, 7.1% for AGIs $75k-100k, 25.3% for AGIs $100k-200k)
Ordinary dividends: $2,484 (reported on 17.1% of returns)
Here:
$2,484
State:
$7,388
(% of AGI for various income ranges: 27.5% for AGIs below $25k, 23.4% for AGIs $25k-50k, 35.6% for AGIs $50k-75k, 34.3% for AGIs $75k-100k, 108.4% for AGIs $100k-200k)
Net capital gain/loss in AGI: +$13,461 (reported on 12.3% of returns)
Here:
+$13,461
State:
+$19,475
(% of AGI for various income ranges: 21.8% for AGIs below $25k, 9.0% for AGIs $25k-50k, 56.7% for AGIs $50k-75k, 339.5% for AGIs $100k-200k)
Profit/loss from business: +$13,781 (reported on 14.4% of returns)
Here:
+$13,781
State:
+$11,386
(% of AGI for various income ranges: 96.1% for AGIs below $25k, 112.8% for AGIs $25k-50k, 157.2% for AGIs $50k-75k, 156.4% for AGIs $75k-100k, 945.3% for AGIs $100k-200k)
Taxable individual retirement arrangement distribution: $17,500 (reported on 8.9% of returns)
41063:
$17,500
Kentucky:
$18,941
(% of AGI for various income ranges: 136.4% for AGIs below $25k, 272.2% for AGIs $50k-75k, 350.0% for AGIs $75k-100k, 480.5% for AGIs $100k-200k)
Total itemized deductions: $26,614 (reported on 4.8% of returns)
Here:
$26,614
State:
$32,473
(% of AGI for various income ranges: 184.1% for AGIs $25k-50k, 699.5% for AGIs $100k-200k)
Charity contributions: $9,220 (reported on 3.4% of returns)
Here:
$9,220
State:
$13,472
(% of AGI for various income ranges: 242.6% for AGIs $100k-200k)
Taxes paid: $10,300 (reported on 4.8% of returns)
41063:
$10,300
State:
$7,830
(% of AGI for various income ranges: 57.9% for AGIs $25k-50k, 291.1% for AGIs $100k-200k)
Earned income credit: $2,065 (reported on 11.6% of returns)
Here:
$2,065
State:
$2,336
(% of AGI for various income ranges: 77.1% for AGIs below $25k, 46.6% for AGIs $25k-50k)
Percentage of individuals using paid preparers for their 2020 taxes: 95.2%
Here:
95%
State:
94%
(% for various income ranges: 97.4% for AGIs below $25k, 94.4% for AGIs $25k-50k, 95.7% for AGIs $50k-75k, 94.4% for AGIs $75k-100k, 96.0% for AGIs $100k-200k, 83.3% for AGIs over 200k)
Averages for the 2012 tax year for zip code 41063, filed in 2013:
Average Adjusted Gross Income (AGI) in 2012: $49,363 (Individual Income Tax Returns)
Here:
$49,363
State:
$50,814
Salary/wage: $44,652 (reported on 87.0% of returns)
Here:
$44,652
State:
$42,723
(% of AGI for various income ranges: 75.4% for AGIs below $25k, 80.1% for AGIs $25k-50k, 79.5% for AGIs $50k-75k, 85.9% for AGIs $75k-100k, 73.5% for AGIs $100k-200k)
Taxable interest for individuals: $470 (reported on 31.9% of returns)
This zip code:
$470
Kentucky:
$1,381
(% of AGI for various income ranges: 0.9% for AGIs below $25k, 0.5% for AGIs $25k-50k, 0.2% for AGIs $50k-75k, 0.2% for AGIs $75k-100k, 0.2% for AGIs $100k-200k)
Ordinary dividends: $2,070 (reported on 16.7% of returns)
Here:
$2,070
State:
$6,239
(% of AGI for various income ranges: 0.9% for AGIs below $25k, 0.6% for AGIs $25k-50k, 0.3% for AGIs $50k-75k, 1.0% for AGIs $75k-100k, 0.7% for AGIs $100k-200k)
Net capital gain/loss in AGI: +$1,611 (reported on 13.0% of returns)
Here:
+$1,611
State:
+$11,336
(% of AGI for various income ranges: 0.2% for AGIs below $25k, 0.6% for AGIs $50k-75k, 0.1% for AGIs $75k-100k, 0.8% for AGIs $100k-200k)
Profit/loss from business: +$7,784 (reported on 13.8% of returns)
Here:
+$7,784
State:
+$10,862
(% of AGI for various income ranges: 6.2% for AGIs below $25k, 3.0% for AGIs $25k-50k, 2.1% for AGIs $50k-75k, 3.3% for AGIs $75k-100k)
Taxable individual retirement arrangement distribution: $15,564 (reported on 8.0% of returns)
41063:
$15,564
Kentucky:
$14,296
(% of AGI for various income ranges: 2.6% for AGIs below $25k, 2.2% for AGIs $25k-50k, 2.6% for AGIs $50k-75k, 6.6% for AGIs $75k-100k)
Total itemized deductions: $18,504 (22% of AGI, reported on 35.5% of returns)
Here:
$18,504
State:
$21,160
Here:
22.4% of AGI
State:
20.0% of AGI
(% of AGI for various income ranges: 9.7% for AGIs below $25k, 8.8% for AGIs $25k-50k, 13.7% for AGIs $50k-75k, 15.9% for AGIs $75k-100k, 14.9% for AGIs $100k-200k)
Charity contributions: $2,337 (reported on 25.4% of returns)
Here:
$2,337
State:
$4,303
(% of AGI for various income ranges: 0.7% for AGIs $25k-50k, 1.2% for AGIs $50k-75k, 1.3% for AGIs $75k-100k, 1.8% for AGIs $100k-200k)
Taxes paid: $7,192 (reported on 35.5% of returns)
41063:
$7,192
State:
$8,496
(% of AGI for various income ranges: 1.5% for AGIs below $25k, 2.8% for AGIs $25k-50k, 4.6% for AGIs $50k-75k, 6.3% for AGIs $75k-100k, 7.1% for AGIs $100k-200k)
Earned income credit: $1,900 (reported on 18.1% of returns)
Here:
$1,900
State:
$2,273
(% of AGI for various income ranges: 6.3% for AGIs below $25k, 0.9% for AGIs $25k-50k)
Percentage of individuals using paid preparers for their 2012 taxes: 58.0%
Here:
58%
State:
60%
(% for various income ranges: 51.0% for AGIs below $25k, 60.6% for AGIs $25k-50k, 60.9% for AGIs $50k-75k, 68.8% for AGIs $75k-100k, 60.0% for AGIs $100k-200k)
Averages for the 2004 tax year for zip code 41063, filed in 2005:
Average Adjusted Gross Income (AGI) in 2004: $39,530 (Individual Income Tax Returns)
Here:
$39,530
State:
$41,540
Salary/wage: $37,725 (reported on 87.6% of returns)
Here:
$37,725
State:
$36,432
(% of AGI for various income ranges: 125.2% for AGIs below $10k, 78.8% for AGIs $10k-25k, 84.4% for AGIs $25k-50k, 89.0% for AGIs $50k-75k, 87.1% for AGIs $75k-100k, 70.1% for AGIs over 100k)
Taxable interest for individuals: $672 (reported on 36.1% of returns)
This zip code:
$672
Kentucky:
$1,571
(% of AGI for various income ranges: 5.5% for AGIs below $10k, 1.0% for AGIs $10k-25k, 0.8% for AGIs $25k-50k, 0.3% for AGIs $50k-75k, 0.2% for AGIs $75k-100k, 0.7% for AGIs over 100k)
Taxable dividends: $1,324 (reported on 17.8% of returns)
Here:
$1,324
State:
$3,453
(% of AGI for various income ranges: 1.9% for AGIs below $10k, 0.5% for AGIs $10k-25k, 0.7% for AGIs $25k-50k, 0.3% for AGIs $50k-75k, 1.0% for AGIs $75k-100k, 0.5% for AGIs over 100k)
Net capital gain/loss: +$4,253 (reported on 11.1% of returns)
Here:
+$4,253
State:
+$9,663
(% of AGI for various income ranges: 1.3% for AGIs below $10k, -0.2% for AGIs $10k-25k, 0.5% for AGIs $25k-50k, 1.2% for AGIs $50k-75k, 1.2% for AGIs $75k-100k, 2.7% for AGIs over 100k)
Profit/loss from business: +$7,994 (reported on 13.2% of returns)
Here:
+$7,994
State:
+$9,233
(% of AGI for various income ranges: 15.7% for AGIs below $10k, 5.0% for AGIs $10k-25k, 2.0% for AGIs $25k-50k, -0.1% for AGIs $50k-75k, 0.2% for AGIs $75k-100k, 7.9% for AGIs over 100k)
IRA payment deduction: $2,750 (reported on 1.2% of returns)
41063:
$2,750
Kentucky:
$2,955
Total itemized deductions: $15,835 (24% of AGI, reported on 35.9% of returns)
Here:
$15,835
State:
$17,474
Here:
23.6% of AGI
State:
21.0% of AGI
(% of AGI for various income ranges: 8.4% for AGIs $10k-25k, 12.7% for AGIs $25k-50k, 15.7% for AGIs $50k-75k, 17.1% for AGIs $75k-100k, 16.1% for AGIs over 100k)
Charity contributions deductions: $2,370 (3% of AGI, reported on 29.6% of returns)
Here:
$2,370
State:
$3,494
Here:
3.4% of AGI
State:
4.0% of AGI
(% of AGI for various income ranges: 0.7% for AGIs $10k-25k, 1.3% for AGIs $25k-50k, 1.8% for AGIs $50k-75k, 2.2% for AGIs $75k-100k, 2.6% for AGIs over 100k)
Total tax: $4,764 (reported on 74.7% of returns)
41063:
$4,764
State:
$6,162
(% of AGI for various income ranges: 4.1% for AGIs below $10k, 3.9% for AGIs $10k-25k, 6.5% for AGIs $25k-50k, 8.1% for AGIs $50k-75k, 9.2% for AGIs $75k-100k, 16.3% for AGIs over 100k)
Earned income credit: $1,720 (reported on 13.7% of returns)
Here:
$1,720
State:
$1,723
Percentage of individuals using paid preparers for their 2004 taxes: 59.5%
Here:
59%
State:
66%
(% for various income ranges: 51.6% for AGIs below $10k, 61.5% for AGIs $10k-25k, 57.8% for AGIs $25k-50k, 66.2% for AGIs $50k-75k, 59.3% for AGIs $75k-100k, 67.6% for AGIs over 100k)
Household received Food Stamps/SNAP in the past 12 months: 74 Household did not receive Food Stamps/SNAP in the past 12 months: 991
Women who had a birth in the past 12 months: 8 (8 now married, 0 unmarried) Women who did not have a birth in the past 12 months: 463 (297 now married, 168 unmarried)
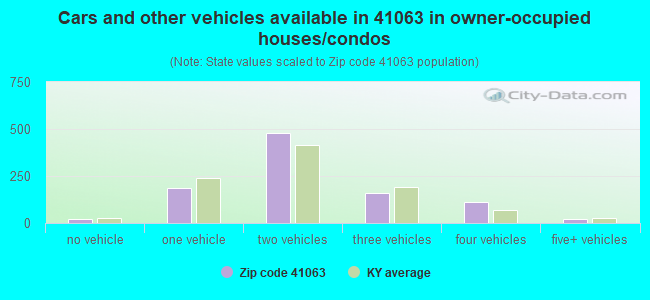
Housing units in zip code 41063 with a mortgage: 543 (97 second mortgage, 88 both second mortgage and home equity loan) Houses without a mortgage: 33
Median monthly owner costs for units with a mortgage: $1,481 Median monthly owner costs for units without a mortgage: $494
Residents with income below the poverty level in 2022:
This zip code:
7.5%
Whole state:
16.5%
Residents with income below 50% of the poverty level in 2022:
This zip code:
6.5%
Whole state:
9.0%
Median number of rooms in houses and condos:
Here:
6.3
State:
6.4
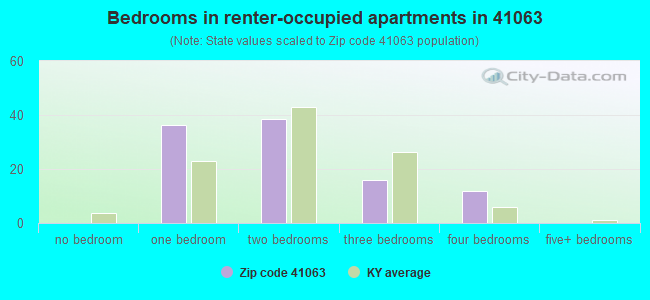
Median number of rooms in apartments:
Here:
4.4
State:
4.4
Notable locations in this zip code not listed on our city pages
Notable locations in zip code 41063: Thorn Hill Drag Strip (A), Piner - Fiskburg Fire Protection District (B), Kenton Fire Protection District (C). Display/hide their locations on the map
Churches in zip code 41063 include: Goshen Church (A), Oak Island Church (B), Saint Matthew Church (C), Saint Marys Church (D), Wilmington Baptist Church (E). Display/hide their locations on the map
Cemeteries: Tucker Cemetery (1), Wilmington Baptist Church Cemetery (2), Adams Cemetery (3), Rapp Cemetery (4), Young Cemetery (5), Fishback Cemetery (6). Display/hide their locations on the map
Streams, rivers, and creeks: Bowman Creek (A), Cruises Creek (B), Vance Branch (C), Trace Run (D), Redmond Branch (E), Sawyers Fork (F). Display/hide their locations on the map
Size of family households: 410 2-persons, 131 3-persons, 237 4-persons, 16 5-persons, 23 6-persons
Size of nonfamily households: 246 1-person
441 married couples with children.
28 single-parent households (11 men, 17 women).
97.7% of residents of 41063 zip code speak English at home.
1.9% of residents speak Spanish at home (42% very well, 50% well, 8% not well).
Foreign born population: 32 (1.2%) (100.0% of them are naturalized citizens)
This zip code:
1.2%
Whole state:
4.0%
35%Chile
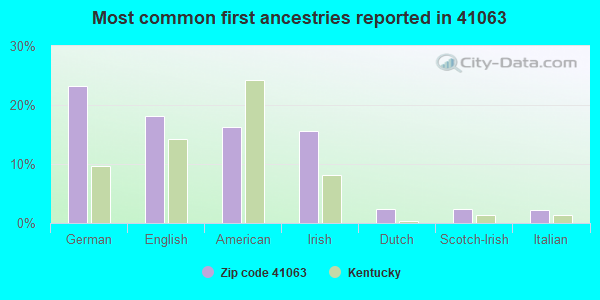
23%German
18%English
16%American
16%Irish
2%Dutch
2%Scotch-Irish
2%Italian
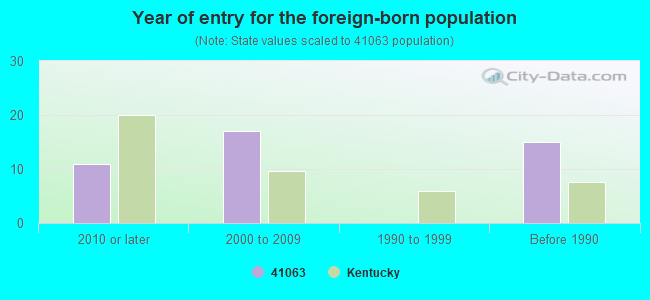
Year of entry for the foreign-born population
112010 or later
172000 to 2009
01990 to 1999
15Before 1990
Facilities with environmental interests located in this zip code:
PINER ELEMENTARY SCHOOL (2845 RICH RD in MORNING VIEW, KY)
(National Center for Education Statistics) - STATE ID-059291070 Organizations: KENTON COUNTY (SCHOOL DISTRICT)
ASHCRAFT RESIDENCE (RECTOR RD in MORNING VIEW, KY)
National Pollutant Discharge Elimination System NON-MAJOR (Tracking pollutant discharge elimination systems) - permit Business SIC classification: OPERATORS OF DWELLINGS OTHER THAN APARTMENT BUILDINGS
BACK RESIDENCE (15102 MADISON PK in MORNING VIEW, KY)
National Pollutant Discharge Elimination System NON-MAJOR (Tracking pollutant discharge elimination systems) - permit Business SIC classification: OPERATORS OF DWELLINGS OTHER THAN APARTMENT BUILDINGS
NIEKAMP RESIDENCE (2278 HEMPFLING RD in MORNINGVIEW, KY)
National Pollutant Discharge Elimination System NON-MAJOR (Tracking pollutant discharge elimination systems) - permit Business SIC classification: OPERATORS OF DWELLINGS OTHER THAN APARTMENT BUILDINGS
ORME RESIDENCE (3183 RICH RD in MORNING VIEW, KY)
National Pollutant Discharge Elimination System NON-MAJOR (Tracking pollutant discharge elimination systems) - permit Business SIC classification: OPERATORS OF DWELLINGS OTHER THAN APARTMENT BUILDINGS
PERRY RESIDENCE (2775 HEMPFLING RD in MORNINGVIEW, KY)
National Pollutant Discharge Elimination System NON-MAJOR (Tracking pollutant discharge elimination systems) - permit Business SIC classification: OPERATORS OF DWELLINGS OTHER THAN APARTMENT BUILDINGS
KINMAN RESIDENCE (3409 RECTOR RD in MORNING VIEW, KY)
National Pollutant Discharge Elimination System NON-MAJOR (Tracking pollutant discharge elimination systems) - permit Business SIC classification: OPERATORS OF DWELLINGS OTHER THAN APARTMENT BUILDINGS
MAGEE RESIDENCE (3464 MOFFETT RDQ in MORNINGVIEW, KY)
National Pollutant Discharge Elimination System NON-MAJOR (Tracking pollutant discharge elimination systems) - permit Business SIC classification: OPERATORS OF DWELLINGS OTHER THAN APARTMENT BUILDINGS
MAGEE RESIDENCE (3460 MOFFETT RD in MORNING VIEW, KY)
National Pollutant Discharge Elimination System NON-MAJOR (Tracking pollutant discharge elimination systems) - permit Business SIC classification: OPERATORS OF DWELLINGS OTHER THAN APARTMENT BUILDINGS
C AND C KORNER MARKET (1991 BRACHT PINER ROAD in MORNING VIEW, KY)
CRITERIA AND HAZARDOUS AIR POLLUTANT INVENTORY (Inventory of air pollution sources) Business SIC classification: GASOLINE SERVICE STATIONS
Housing units lacking complete plumbing facilities: 2.7% Housing units lacking complete kitchen facilities: 2.7%
46.2%Electricity
36.0%Bottled, tank, or LP gas
8.4%Fuel oil, kerosene, etc.
6.1%Wood
1.7%Utility gas
1.7%Other fuel
Population in 1990: 3,938.
Place of birth for U.S.-born residents:
This state: 2,017
Northeast: 35
Midwest: 412
South: 134
West: 12
60% of the 41063 zip code residents lived in the same house 5 years ago. Out of people who lived in different houses, 73% lived in this county. Out of people who lived in different counties, 50% lived in Kentucky.
99% of the 41063 zip code residents lived in the same house 1 year ago. Out of people who lived in different houses, 89% moved from this county. Out of people who lived in different houses, 37% moved from different state.
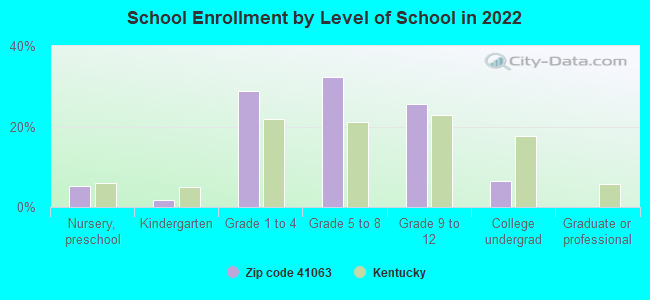
Private vs. public school enrollment:
Students in private schools in grades 1 to 8 (elementary and middle school): 62
Here:
19.4%
Kentucky:
17.2%
Students in private schools in grades 9 to 12 (high school): 35
Here:
25.6%
Kentucky:
15.2%
Students in private undergraduate colleges:
Here:
0.0%
Kentucky:
19.6%
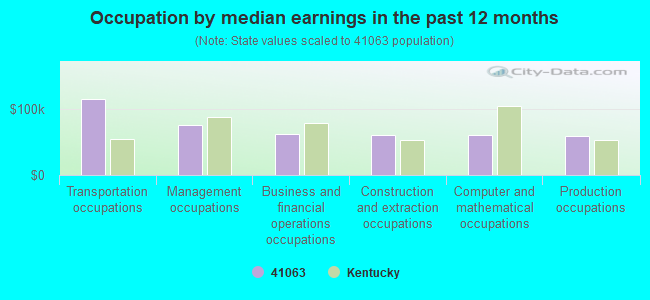
Occupation by median earnings in the past 12 months ($)
114,660Transportation occupations
74,924Management occupations
61,505Business and financial operations occupations
60,935Construction and extraction occupations
59,725Computer and mathematical occupations
58,328Production occupations
Top industries in this zip code by the number of employees in 2005:
Other Services (except Public Administration): General Automotive Repair (10-19 employees: 1 establishment)
Construction: Site Preparation Contractors (10-19: 1)
Construction: Water and Sewer Line and Related Structures Construction (5-9: 2)
Construction: Painting and Wall Covering Contractors (5-9: 1)
Other Services (except Public Administration): Religious Organizations (5-9: 1)
Construction: Framing Contractors (1-4: 3)
Construction: All Other Specialty Trade Contractors (1-4: 3)
Fatal accident statistics in 2014:
Fatal accident count: 1
Vehicles involved in fatal accidents: 1
Fatal accidents caused by drunken drivers: 1
Fatalities: 1
Persons involved in fatal accidents: 1
Pedestrians involved in fatal accidents: 0
Fatal accident statistics in 2011:
Fatal accident count: 1
Vehicles involved in fatal accidents: 1
Fatal accidents caused by drunken drivers: 1
Fatalities: 1
Persons involved in fatal accidents: 2
Pedestrians involved in fatal accidents: 0
Home Mortgage Disclosure Act Aggregated Statistics For Year 2009 (Based on 4 partial tracts)
A) FHA, FSA/RHS & VA Home Purchase Loans
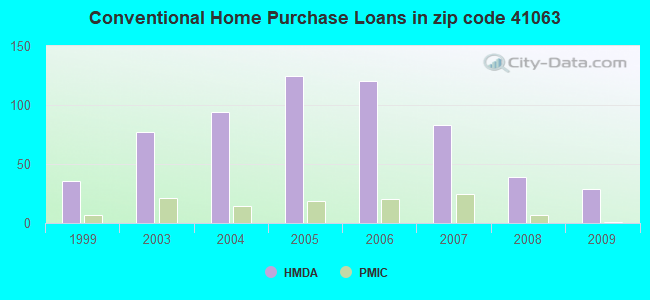
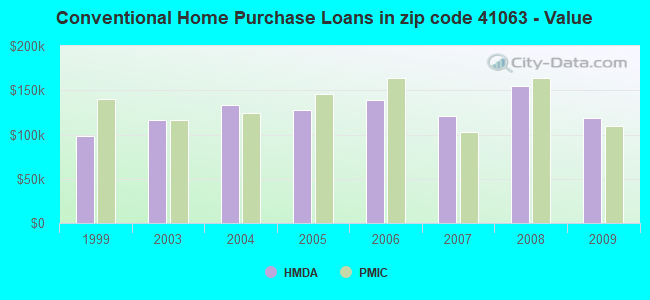
B) Conventional Home Purchase Loans
C) Refinancings
D) Home Improvement Loans
F) Non-occupant Loans on < 5 Family Dwellings (A B C & D)
G) Loans On Manufactured Home Dwelling (A B C & D)
Number
Average Value
Number
Average Value
Number
Average Value
Number
Average Value
Number
Average Value
Number
Average Value
LOANS ORIGINATED
45
$136,855
29
$118,710
297
$153,911
7
$47,504
9
$101,414
20
$96,512
APPLICATIONS APPROVED, NOT ACCEPTED
2
$79,335
5
$62,642
15
$141,436
4
$16,212
1
$142,210
5
$64,414
APPLICATIONS DENIED
8
$101,545
12
$82,532
113
$135,780
4
$38,280
4
$75,568
18
$77,163
APPLICATIONS WITHDRAWN
6
$93,822
3
$136,893
44
$148,574
2
$88,155
0
$0
4
$78,145
FILES CLOSED FOR INCOMPLETENESS
1
$231,100
0
$0
7
$150,034
0
$0
0
$0
0
$0
Aggregated Statistics For Year 2008 (Based on 4 partial tracts)
A) FHA, FSA/RHS & VA Home Purchase Loans
B) Conventional Home Purchase Loans
C) Refinancings
D) Home Improvement Loans
E) Loans on Dwellings For 5+ Families
F) Non-occupant Loans on < 5 Family Dwellings (A B C & D)
G) Loans On Manufactured Home Dwelling (A B C & D)
Number
Average Value
Number
Average Value
Number
Average Value
Number
Average Value
Number
Average Value
Number
Average Value
Number
Average Value
LOANS ORIGINATED
20
$132,164
39
$154,953
179
$133,234
17
$114,036
1
$35,460
15
$107,301
15
$89,728
APPLICATIONS APPROVED, NOT ACCEPTED
0
$0
8
$97,861
21
$129,558
2
$51,575
0
$0
1
$225,150
5
$57,814
APPLICATIONS DENIED
3
$114,560
23
$147,010
138
$154,450
27
$37,846
0
$0
6
$137,245
27
$92,305
APPLICATIONS WITHDRAWN
0
$0
5
$108,990
35
$132,000
1
$1,770
0
$0
2
$174,545
1
$132,960
FILES CLOSED FOR INCOMPLETENESS
0
$0
0
$0
7
$177,946
2
$53,270
0
$0
0
$0
0
$0
Aggregated Statistics For Year 2007 (Based on 4 partial tracts)
A) FHA, FSA/RHS & VA Home Purchase Loans
B) Conventional Home Purchase Loans
C) Refinancings
D) Home Improvement Loans
F) Non-occupant Loans on < 5 Family Dwellings (A B C & D)
G) Loans On Manufactured Home Dwelling (A B C & D)
Number
Average Value
Number
Average Value
Number
Average Value
Number
Average Value
Number
Average Value
Number
Average Value
LOANS ORIGINATED
12
$129,692
83
$120,535
172
$131,690
30
$63,333
21
$117,836
31
$74,425
APPLICATIONS APPROVED, NOT ACCEPTED
1
$110,800
7
$117,764
50
$119,956
4
$128,512
5
$106,062
2
$65,595
APPLICATIONS DENIED
3
$181,423
20
$97,230
168
$121,516
33
$64,478
8
$77,230
20
$68,343
APPLICATIONS WITHDRAWN
3
$112,573
9
$194,840
44
$132,135
10
$130,356
0
$0
0
$0
FILES CLOSED FOR INCOMPLETENESS
0
$0
11
$113,506
12
$152,320
3
$76,627
1
$136,290
0
$0
Aggregated Statistics For Year 2006 (Based on 4 partial tracts)
A) FHA, FSA/RHS & VA Home Purchase Loans
B) Conventional Home Purchase Loans
C) Refinancings
D) Home Improvement Loans
F) Non-occupant Loans on < 5 Family Dwellings (A B C & D)
G) Loans On Manufactured Home Dwelling (A B C & D)
Number
Average Value
Number
Average Value
Number
Average Value
Number
Average Value
Number
Average Value
Number
Average Value
LOANS ORIGINATED
13
$113,235
120
$138,853
208
$115,261
40
$59,039
29
$88,083
20
$81,332
APPLICATIONS APPROVED, NOT ACCEPTED
2
$115,340
15
$140,571
50
$105,122
6
$43,840
8
$152,170
4
$83,225
APPLICATIONS DENIED
3
$74,563
45
$149,265
120
$121,380
55
$56,663
5
$34,752
28
$47,230
APPLICATIONS WITHDRAWN
7
$126,554
12
$143,515
51
$109,755
4
$72,632
7
$96,926
9
$80,752
FILES CLOSED FOR INCOMPLETENESS
0
$0
4
$88,512
16
$100,205
0
$0
0
$0
0
$0
Aggregated Statistics For Year 2005 (Based on 4 partial tracts)
A) FHA, FSA/RHS & VA Home Purchase Loans
B) Conventional Home Purchase Loans
C) Refinancings
D) Home Improvement Loans
F) Non-occupant Loans on < 5 Family Dwellings (A B C & D)
G) Loans On Manufactured Home Dwelling (A B C & D)
Number
Average Value
Number
Average Value
Number
Average Value
Number
Average Value
Number
Average Value
Number
Average Value
LOANS ORIGINATED
15
$109,525
125
$127,496
204
$133,820
28
$38,258
14
$91,871
28
$83,797
APPLICATIONS APPROVED, NOT ACCEPTED
1
$157,030
25
$152,219
44
$112,106
5
$28,878
1
$1,266,600
13
$72,054
APPLICATIONS DENIED
3
$44,617
40
$71,662
201
$144,625
24
$36,701
10
$72,950
43
$63,333
APPLICATIONS WITHDRAWN
1
$182,210
20
$112,945
58
$141,021
5
$156,894
3
$97,013
9
$107,032
FILES CLOSED FOR INCOMPLETENESS
1
$93,070
2
$160,550
20
$128,931
1
$28,150
0
$0
1
$28,150
Aggregated Statistics For Year 2004 (Based on 4 partial tracts)
A) FHA, FSA/RHS & VA Home Purchase Loans
B) Conventional Home Purchase Loans
C) Refinancings
D) Home Improvement Loans
F) Non-occupant Loans on < 5 Family Dwellings (A B C & D)
G) Loans On Manufactured Home Dwelling (A B C & D)
Number
Average Value
Number
Average Value
Number
Average Value
Number
Average Value
Number
Average Value
Number
Average Value
LOANS ORIGINATED
13
$105,498
94
$133,006
264
$116,711
20
$45,196
13
$60,740
25
$76,988
APPLICATIONS APPROVED, NOT ACCEPTED
4
$85,562
15
$97,167
40
$115,686
4
$55,382
1
$15,070
6
$50,872
APPLICATIONS DENIED
2
$125,050
32
$94,568
165
$111,074
28
$37,621
13
$72,423
35
$79,921
APPLICATIONS WITHDRAWN
2
$89,970
16
$99,297
117
$117,864
4
$28,360
10
$132,086
12
$88,353
FILES CLOSED FOR INCOMPLETENESS
2
$111,425
3
$91,213
16
$125,295
1
$37,030
2
$92,500
2
$45,965
Aggregated Statistics For Year 2003 (Based on 4 partial tracts)
A) FHA, FSA/RHS & VA Home Purchase Loans
B) Conventional Home Purchase Loans
C) Refinancings
D) Home Improvement Loans
E) Loans on Dwellings For 5+ Families
F) Non-occupant Loans on < 5 Family Dwellings (A B C & D)
Number
Average Value
Number
Average Value
Number
Average Value
Number
Average Value
Number
Average Value
Number
Average Value
LOANS ORIGINATED
16
$103,771
77
$116,027
487
$117,799
23
$35,663
0
$0
15
$50,918
APPLICATIONS APPROVED, NOT ACCEPTED
0
$0
15
$62,332
53
$117,223
7
$38,101
0
$0
1
$71,800
APPLICATIONS DENIED
2
$127,835
21
$60,550
152
$114,893
26
$15,177
1
$74,070
7
$38,894
APPLICATIONS WITHDRAWN
1
$122,320
11
$152,640
65
$115,365
1
$51,850
0
$0
1
$124,440
FILES CLOSED FOR INCOMPLETENESS
0
$0
2
$70,380
15
$144,989
3
$28,660
0
$0
1
$124,440
Aggregated Statistics For Year 1999 (Based on 1 partial tract)
A) FHA, FSA/RHS & VA Home Purchase Loans
B) Conventional Home Purchase Loans
C) Refinancings
D) Home Improvement Loans
F) Non-occupant Loans on < 5 Family Dwellings (A B C & D)
Detailed PMIC statistics for the following Tracts:0637.01
, 0637.02
2002 - 2018 National Fire Incident Reporting System (NFIRS) incidents
According to the data from the years 2002 - 2018 the average number of fire incidents per year is 20. The highest number of reported fires - 37 took place in 2014, and the least - 7 in 2003. The data has a rising trend.
When looking into fire subcategories, the most incidents belonged to: Outside Fires (43.9%), and Structure Fires (37.0%).
Fire incident types reported to NFIRS in Zip Code 41063

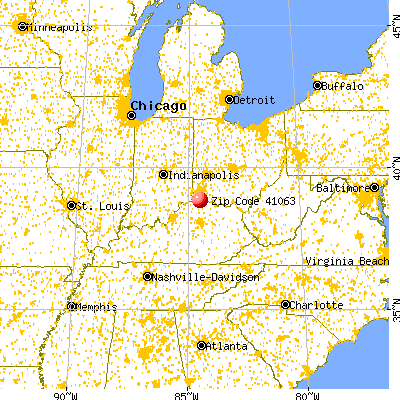


 Nearest zip codes: 41033, 41051, 41030, 41001, 41094, 41015.


 According to the data from the years 2002 - 2018 the average number of fire incidents per year is 20. The highest number of reported fires - 37 took place in 2014, and the least - 7 in 2003. The data has a rising trend.
 When looking into fire subcategories, the most incidents belonged to: Outside Fires (43.9%), and Structure Fires (37.0%).