Estimated zip code population in 2022: 1,380 Zip code population in 2010: 1,403 Zip code population in 2000: 1,360
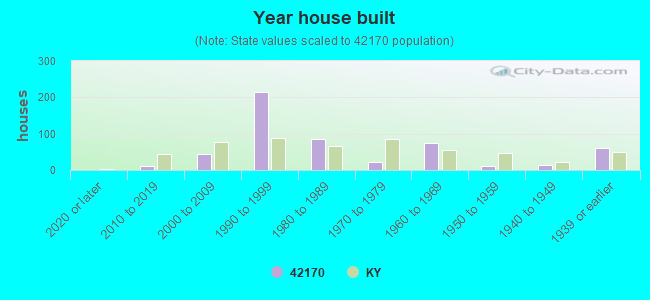
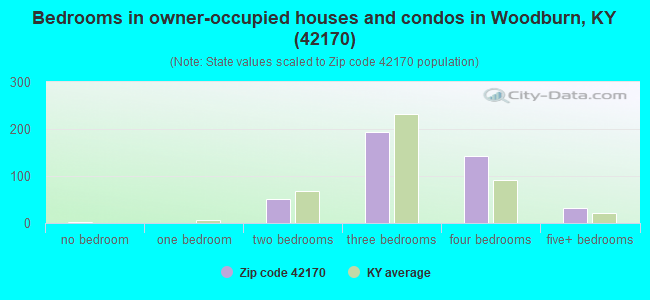
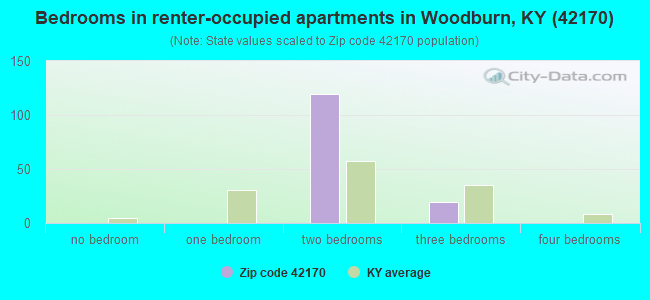
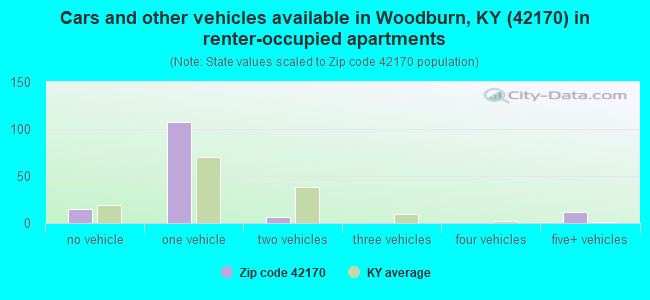
Houses and condos: 560 Renter-occupied apartments: 135
% of renters here:
24%
State:
31%
March 2022 cost of living index in zip code 42170: 85.7 (less than average, U.S. average is 100)
Land area: 32.6 sq. mi. Water area: 0.3 sq. mi.
Population density: 42 people per square mile
(very low).
OSM Map
General Map
Google Map
MSN Map
OSM Map
General Map
Google Map
MSN Map
OSM Map
General Map
Google Map
MSN Map
OSM Map
General Map
Google Map
MSN Map
Please wait while loading the map...
Real estate property taxes paid for housing units in 2022:
This zip code:
0.6% ($1,741)
Kentucky:
0.7% ($1,456)
Median real estate property taxes paid for housing units with mortgages in 2022: $1,695 (0.5%) Median real estate property taxes paid for housing units with no mortgage in 2022: $1,966 (0.6%)
Business Search- 14 Million verified businesses
Males: 664
(48.1%)
Females: 716
(51.9%)
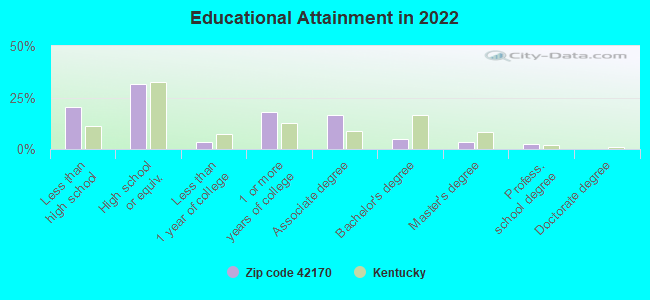
For population 25 years and over in 42170:
High school or higher: 77.4%
Bachelor's degree or higher: 10.5%
Graduate or professional degree: 5.8%
Unemployed: 4.3%
Mean travel time to work (commute): 24.6 minutes
For population 15 years and over in 42170:
Never married: 16.3%
Now married: 58.6%
Separated: 0.3%
Widowed: 8.8%
Divorced: 15.9%
Zip code 42170 compared to state average:
Median house value above state average.
Black race population percentage significantly below state average.
Hispanic race population percentage significantly below state average.
Median age above state average.
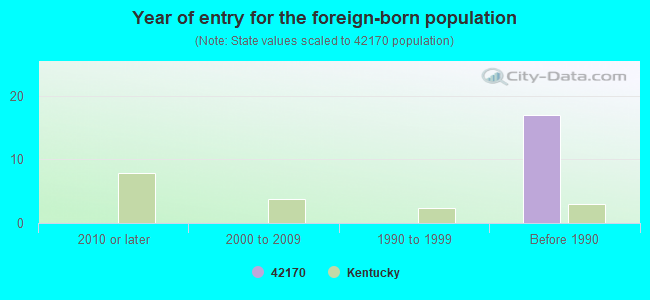
Foreign-born population percentage significantly below state average.
Length of stay since moving in significantly above state average.
Percentage of population with a bachelor's degree or higher significantly below state average.
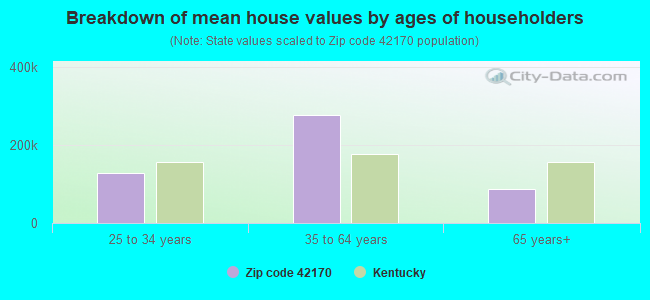
Estimated median house/condo value in 2022: $309,977
42170:
$309,977
Kentucky:
$196,300
According to our research of Kentucky and other state lists, there was 1 registered sex offender living in 42170 zip code as of June 16, 2024. The ratio of all residents to sex offenders in zip code 42170 is 1,503 to 1. The ratio of registered sex offenders to all residents in this zip code is much lower than the state average.
Median resident age:
This zip code:
45.9 years
Kentucky median age:
39.4 years
Average household size:
This zip code:
2.4 people
Kentucky:
2.4 people
Averages for the 2020 tax year for zip code 42170, filed in 2021:
Average Adjusted Gross Income (AGI) in 2020: $61,544 (Individual Income Tax Returns)
Here:
$61,544
State:
$61,342
Salary/wage: $50,042 (reported on 81.9% of returns)
Here:
$50,042
State:
$50,827
(% of AGI for various income ranges: 941.9% for AGIs below $25k, 3722.3% for AGIs $25k-50k, 6308.9% for AGIs $50k-75k, 11770.0% for AGIs $75k-100k, 23232.0% for AGIs $100k-200k)
Taxable interest for individuals: $519 (reported on 29.2% of returns)
This zip code:
$519
Kentucky:
$1,441
(% of AGI for various income ranges: 9.4% for AGIs below $25k, 3.8% for AGIs $25k-50k, 22.2% for AGIs $50k-75k, 24.0% for AGIs $75k-100k, 114.0% for AGIs $100k-200k)
Ordinary dividends: $1,973 (reported on 15.3% of returns)
Here:
$1,973
State:
$7,388
(% of AGI for various income ranges: 31.2% for AGIs below $25k, 71.1% for AGIs $50k-75k, 206.0% for AGIs $100k-200k)
Net capital gain/loss in AGI: +$11,610 (reported on 13.9% of returns)
Here:
+$11,610
State:
+$19,475
(% of AGI for various income ranges: 71.2% for AGIs below $25k, 163.3% for AGIs $50k-75k, 1800.0% for AGIs $100k-200k)
Profit/loss from business: +$7,127 (reported on 20.8% of returns)
Here:
+$7,127
State:
+$11,386
(% of AGI for various income ranges: 114.4% for AGIs below $25k, 196.9% for AGIs $25k-50k, 371.1% for AGIs $50k-75k, 38.0% for AGIs $75k-100k, 554.0% for AGIs $100k-200k)
Taxable individual retirement arrangement distribution: $17,167 (reported on 8.3% of returns)
42170:
$17,167
Kentucky:
$18,941
(% of AGI for various income ranges: 183.1% for AGIs below $25k, 1474.0% for AGIs $75k-100k)
Total itemized deductions: $35,367 (reported on 4.2% of returns)
Here:
$35,367
State:
$32,473
(% of AGI for various income ranges: 2122.0% for AGIs $100k-200k)
Charity contributions: $10,300 (reported on 2.8% of returns)
Here:
$10,300
State:
$13,472
(% of AGI for various income ranges: 412.0% for AGIs $75k-100k)
Taxes paid: $8,200 (reported on 4.2% of returns)
42170:
$8,200
State:
$7,830
(% of AGI for various income ranges: 492.0% for AGIs $100k-200k)
Earned income credit: $2,190 (reported on 13.9% of returns)
Here:
$2,190
State:
$2,336
(% of AGI for various income ranges: 90.0% for AGIs below $25k, 57.7% for AGIs $25k-50k)
Percentage of individuals using paid preparers for their 2020 taxes: 97.2%
Here:
97%
State:
94%
(% for various income ranges: 95.5% for AGIs below $25k, 100.0% for AGIs $25k-50k, 91.7% for AGIs $50k-75k, 100.0% for AGIs $75k-100k, 100.0% for AGIs $100k-200k, 100.0% for AGIs over 200k)
Averages for the 2012 tax year for zip code 42170, filed in 2013:
Average Adjusted Gross Income (AGI) in 2012: $47,391 (Individual Income Tax Returns)
Here:
$47,391
State:
$50,814
Salary/wage: $41,496 (reported on 80.6% of returns)
Here:
$41,496
State:
$42,723
(% of AGI for various income ranges: 65.0% for AGIs below $25k, 81.8% for AGIs $25k-50k, 76.7% for AGIs $50k-75k, 72.7% for AGIs $75k-100k, 60.6% for AGIs $100k-200k)
Taxable interest for individuals: $971 (reported on 31.3% of returns)
This zip code:
$971
Kentucky:
$1,381
(% of AGI for various income ranges: 0.5% for AGIs below $25k, 0.3% for AGIs $25k-50k, 1.7% for AGIs $50k-75k, 0.3% for AGIs $75k-100k, 0.3% for AGIs $100k-200k)
Ordinary dividends: $1,200 (reported on 11.9% of returns)
Here:
$1,200
State:
$6,239
(% of AGI for various income ranges: 0.3% for AGIs below $25k, 1.0% for AGIs $25k-50k, 0.5% for AGIs $75k-100k)
Net capital gain/loss in AGI: +$5,443 (reported on 10.4% of returns)
Here:
+$5,443
State:
+$11,336
(% of AGI for various income ranges: 0.5% for AGIs below $25k, 0.3% for AGIs $50k-75k, 3.3% for AGIs $100k-200k)
Profit/loss from business: +$7,733 (reported on 17.9% of returns)
Here:
+$7,733
State:
+$10,862
(% of AGI for various income ranges: 9.7% for AGIs below $25k, 4.1% for AGIs $25k-50k, 3.6% for AGIs $50k-75k, 2.4% for AGIs $75k-100k)
Taxable individual retirement arrangement distribution: $9,683 (reported on 9.0% of returns)
42170:
$9,683
Kentucky:
$14,296
Total itemized deductions: $18,568 (23% of AGI, reported on 32.8% of returns)
Here:
$18,568
State:
$21,160
Here:
23.1% of AGI
State:
20.0% of AGI
(% of AGI for various income ranges: 12.9% for AGIs below $25k, 8.0% for AGIs $25k-50k, 14.1% for AGIs $50k-75k, 15.1% for AGIs $75k-100k, 13.7% for AGIs $100k-200k)
Charity contributions: $3,767 (reported on 26.9% of returns)
Here:
$3,767
State:
$4,303
(% of AGI for various income ranges: 1.8% for AGIs $25k-50k, 1.7% for AGIs $50k-75k, 2.7% for AGIs $75k-100k, 2.9% for AGIs $100k-200k)
Taxes paid: $5,686 (reported on 32.8% of returns)
42170:
$5,686
State:
$8,496
(% of AGI for various income ranges: 1.3% for AGIs below $25k, 2.0% for AGIs $25k-50k, 3.8% for AGIs $50k-75k, 5.0% for AGIs $75k-100k, 5.5% for AGIs $100k-200k)
Earned income credit: $1,892 (reported on 19.4% of returns)
Here:
$1,892
State:
$2,273
(% of AGI for various income ranges: 5.1% for AGIs below $25k, 1.4% for AGIs $25k-50k)
Percentage of individuals using paid preparers for their 2012 taxes: 71.6%
Here:
72%
State:
60%
(% for various income ranges: 73.1% for AGIs below $25k, 62.5% for AGIs $25k-50k, 66.7% for AGIs $50k-75k, 83.3% for AGIs $75k-100k, 85.7% for AGIs $100k-200k)
Averages for the 2004 tax year for zip code 42170, filed in 2005:
Average Adjusted Gross Income (AGI) in 2004: $37,818 (Individual Income Tax Returns)
Here:
$37,818
State:
$41,540
Salary/wage: $36,473 (reported on 84.1% of returns)
Here:
$36,473
State:
$36,432
(% of AGI for various income ranges: 155.0% for AGIs below $10k, 71.4% for AGIs $10k-25k, 86.2% for AGIs $25k-50k, 85.6% for AGIs $50k-75k, 81.0% for AGIs $75k-100k, 62.8% for AGIs over 100k)
Taxable interest for individuals: $1,278 (reported on 41.0% of returns)
This zip code:
$1,278
Kentucky:
$1,571
(% of AGI for various income ranges: 2.4% for AGIs below $10k, 3.9% for AGIs $10k-25k, 0.9% for AGIs $25k-50k, 1.6% for AGIs $50k-75k, 0.4% for AGIs $75k-100k, 0.5% for AGIs over 100k)
Taxable dividends: $466 (reported on 14.5% of returns)
Here:
$466
State:
$3,453
(% of AGI for various income ranges: 0.3% for AGIs below $10k, 0.4% for AGIs $10k-25k, 0.3% for AGIs $25k-50k, 0.0% for AGIs $50k-75k, 0.3% for AGIs $75k-100k)
Net capital gain/loss: +$1,486 (reported on 12.2% of returns)
Here:
+$1,486
State:
+$9,663
(% of AGI for various income ranges: 1.4% for AGIs $10k-25k, 0.1% for AGIs $25k-50k, 0.2% for AGIs $50k-75k, 1.1% for AGIs $75k-100k, 0.4% for AGIs over 100k)
Profit/loss from business: +$3,235 (reported on 19.7% of returns)
Here:
+$3,235
State:
+$9,233
(% of AGI for various income ranges: 1.2% for AGIs below $10k, 6.3% for AGIs $10k-25k, 2.4% for AGIs $25k-50k, 0.6% for AGIs $50k-75k, 0.9% for AGIs $75k-100k)
IRA payment deduction: $1,909 (reported on 1.8% of returns)
42170:
$1,909
Kentucky:
$2,955
Total itemized deductions: $14,246 (24% of AGI, reported on 32.9% of returns)
Here:
$14,246
State:
$17,474
Here:
24.1% of AGI
State:
21.0% of AGI
(% of AGI for various income ranges: 14.7% for AGIs $10k-25k, 10.9% for AGIs $25k-50k, 11.7% for AGIs $50k-75k, 14.0% for AGIs $75k-100k, 14.2% for AGIs over 100k)
Charity contributions deductions: $2,844 (5% of AGI, reported on 28.6% of returns)
Here:
$2,844
State:
$3,494
Here:
4.7% of AGI
State:
4.0% of AGI
(% of AGI for various income ranges: 1.7% for AGIs $10k-25k, 1.4% for AGIs $25k-50k, 1.8% for AGIs $50k-75k, 2.3% for AGIs $75k-100k, 4.7% for AGIs over 100k)
Total tax: $4,178 (reported on 78.0% of returns)
42170:
$4,178
State:
$6,162
(% of AGI for various income ranges: 4.2% for AGIs below $10k, 4.5% for AGIs $10k-25k, 6.0% for AGIs $25k-50k, 7.8% for AGIs $50k-75k, 10.9% for AGIs $75k-100k, 16.5% for AGIs over 100k)
Earned income credit: $1,554 (reported on 16.7% of returns)
Here:
$1,554
State:
$1,723
Percentage of individuals using paid preparers for their 2004 taxes: 70.9%
Here:
71%
State:
66%
(% for various income ranges: 55.3% for AGIs below $10k, 74.8% for AGIs $10k-25k, 74.8% for AGIs $25k-50k, 68.9% for AGIs $50k-75k, 80.5% for AGIs $75k-100k, 80.0% for AGIs over 100k)
Household received Food Stamps/SNAP in the past 12 months: 10 Household did not receive Food Stamps/SNAP in the past 12 months: 544
Women who had a birth in the past 12 months: 43 (40 now married, 2 unmarried) Women who did not have a birth in the past 12 months: 236 (115 now married, 121 unmarried)
Housing units in zip code 42170 with a mortgage: 220 (3 second mortgage, 3 both second mortgage and home equity loan) Houses without a mortgage: 24
Median monthly owner costs for units with a mortgage: $1,452 Median monthly owner costs for units without a mortgage: $643
Residents with income below the poverty level in 2022:
This zip code:
11.3%
Whole state:
16.5%
Residents with income below 50% of the poverty level in 2022:
This zip code:
1.2%
Whole state:
9.0%
Median number of rooms in houses and condos:
Here:
6.3
State:
6.4
Median number of rooms in apartments:
Here:
3.3
State:
4.4
Notable locations in this zip code not listed on our city pages
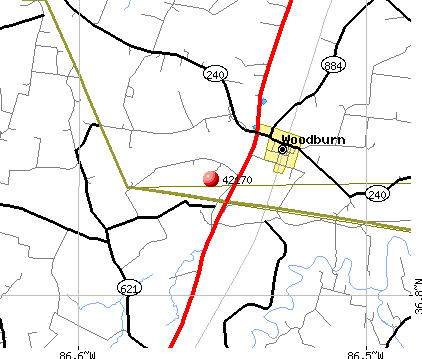
Churches in zip code 42170 include: Millikens Chapel (A), Old Zion Church (B), Pilot Knob Church (C), Woodburn Church (D). Display/hide their locations on the map
In group quarters: 46 (-1 institutionalized population)
Size of family households: 176 2-persons, 98 3-persons, 26 4-persons, 29 5-persons, 12 6-persons, 11 7-or-more-persons
Size of nonfamily households: 202 1-person
264 married couples with children.
1 single-parent households (1 men).
98.8% of residents of 42170 zip code speak English at home.
1.2% of residents speak other Indo-European language at home (100% very well).
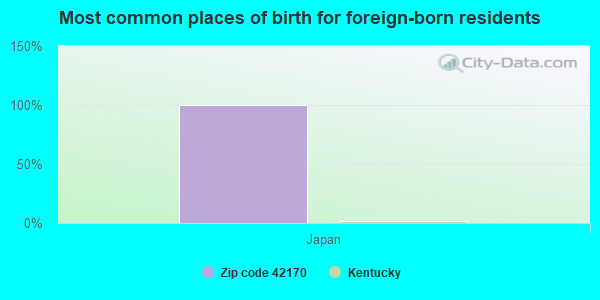
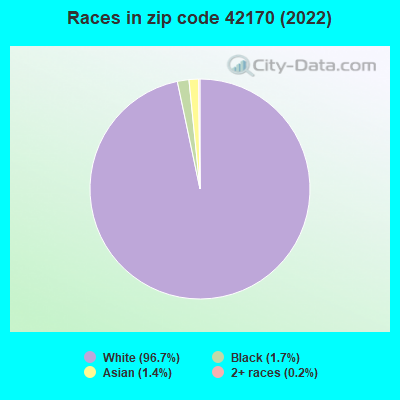
Foreign born population: 19 (1.4%) (100.0% of them are naturalized citizens)
This zip code:
1.4%
Whole state:
4.0%
100%Japan
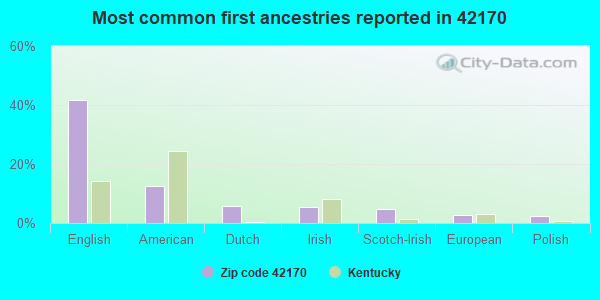
42%English
13%American
6%Dutch
5%Irish
5%Scotch-Irish
3%European
2%Polish
Year of entry for the foreign-born population
02010 or later
02000 to 2009
01990 to 1999
17Before 1990
Facilities with environmental interests located in this zip code:
LEE CRAFTON FARM (2000 S. CEDAR BLUFF ROAD in WOODBURN, KY)
(Resource Conservation and Recovery Act (tracking hazardous waste))
Housing units lacking complete plumbing facilities: 0.7% Housing units lacking complete kitchen facilities: 0.6%
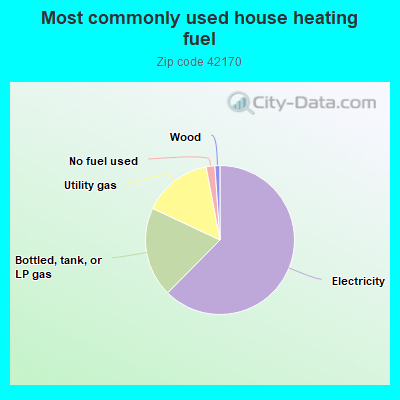
62.7%Electricity
19.6%Bottled, tank, or LP gas
15.1%Utility gas
1.9%No fuel used
1.1%Wood
Population in 1990: 1,573.
Place of birth for U.S.-born residents:
This state: 1,008
Midwest: 94
South: 177
West: 83
71% of the 42170 zip code residents lived in the same house 5 years ago. Out of people who lived in different houses, 52% lived in this county. Out of people who lived in different counties, 50% lived in Kentucky.
95% of the 42170 zip code residents lived in the same house 1 year ago. Out of people who lived in different houses, 16% moved from this county. Out of people who lived in different houses, 52% moved from different county within same state. Out of people who lived in different houses, 36% moved from different state.
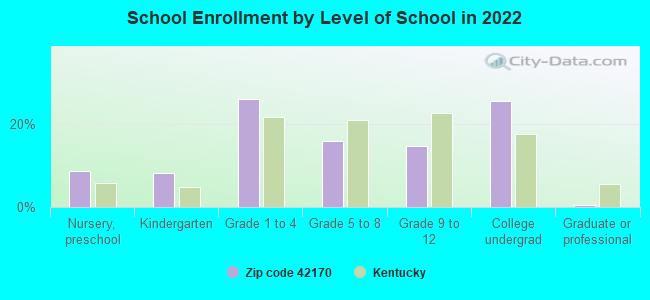
Private vs. public school enrollment:
Students in private schools in grades 1 to 8 (elementary and middle school): 65
Here:
43.6%
Kentucky:
17.2%
Students in private schools in grades 9 to 12 (high school): 3
Here:
6.8%
Kentucky:
15.2%
Students in private undergraduate colleges: 14
Here:
17.5%
Kentucky:
19.6%
Occupation by median earnings in the past 12 months ($)
129,087Health diagnosing and treating practitioners and other technical occupations
87,972Management occupations
70,001Construction and extraction occupations
57,908Transportation occupations
35,603Production occupations
33,903Material moving occupations
Top industries in this zip code by the number of employees in 2005:
Health Care and Social Assistance: Nursing Care Facilities (50-99 employees: 1 establishment)
Construction: Plumbing, Heating, and Air-Conditioning Contractors (10-19: 1)
Mining: Crushed and Broken Limestone Mining and Quarrying (10-19: 1)
Construction: Commercial and Institutional Building Construction (10-19: 1)
Construction: New Single-Family Housing Construction (except Operative Builders) (5-9: 1, 1-4: 1)
Construction: Residential Remodelers (5-9: 1)
Educational Services: Sports and Recreation Instruction (5-9: 1)
People in group quarters in 2010:
50 people in nursing facilities/skilled-nursing facilities
People in group quarters in 2000:
48 people in nursing homes
Home Mortgage Disclosure Act Aggregated Statistics For Year 2009 (Based on 2 partial tracts)
A) FHA, FSA/RHS & VA Home Purchase Loans
B) Conventional Home Purchase Loans
C) Refinancings
D) Home Improvement Loans
F) Non-occupant Loans on < 5 Family Dwellings (A B C & D)
G) Loans On Manufactured Home Dwelling (A B C & D)
Number
Average Value
Number
Average Value
Number
Average Value
Number
Average Value
Number
Average Value
Number
Average Value
LOANS ORIGINATED
15
$124,890
20
$114,161
81
$138,975
4
$31,585
11
$85,525
2
$25,075
APPLICATIONS APPROVED, NOT ACCEPTED
0
$0
2
$168,770
6
$122,800
0
$0
0
$0
0
$0
APPLICATIONS DENIED
1
$127,780
5
$73,198
24
$138,894
3
$56,900
0
$0
1
$73,290
APPLICATIONS WITHDRAWN
1
$96,440
2
$88,245
18
$153,581
0
$0
1
$228,560
0
$0
FILES CLOSED FOR INCOMPLETENESS
1
$107,050
0
$0
3
$184,843
0
$0
0
$0
0
$0
Aggregated Statistics For Year 2008 (Based on 2 partial tracts)
A) FHA, FSA/RHS & VA Home Purchase Loans
B) Conventional Home Purchase Loans
C) Refinancings
D) Home Improvement Loans
F) Non-occupant Loans on < 5 Family Dwellings (A B C & D)
G) Loans On Manufactured Home Dwelling (A B C & D)
Number
Average Value
Number
Average Value
Number
Average Value
Number
Average Value
Number
Average Value
Number
Average Value
LOANS ORIGINATED
15
$140,449
28
$130,849
63
$139,027
10
$45,182
16
$154,515
2
$46,290
APPLICATIONS APPROVED, NOT ACCEPTED
1
$133,090
1
$175,040
7
$114,350
1
$27,970
0
$0
0
$0
APPLICATIONS DENIED
2
$175,280
3
$185,327
25
$141,728
5
$47,062
2
$104,395
1
$100,780
APPLICATIONS WITHDRAWN
0
$0
2
$181,550
11
$152,814
1
$143,210
1
$155,270
0
$0
FILES CLOSED FOR INCOMPLETENESS
0
$0
0
$0
2
$121,755
0
$0
0
$0
0
$0
Aggregated Statistics For Year 2007 (Based on 2 partial tracts)
A) FHA, FSA/RHS & VA Home Purchase Loans
B) Conventional Home Purchase Loans
C) Refinancings
D) Home Improvement Loans
F) Non-occupant Loans on < 5 Family Dwellings (A B C & D)
G) Loans On Manufactured Home Dwelling (A B C & D)
Number
Average Value
Number
Average Value
Number
Average Value
Number
Average Value
Number
Average Value
Number
Average Value
LOANS ORIGINATED
11
$115,070
40
$112,642
56
$125,053
15
$32,372
11
$83,640
1
$73,290
APPLICATIONS APPROVED, NOT ACCEPTED
0
$0
3
$113,640
7
$116,761
1
$47,260
0
$0
0
$0
APPLICATIONS DENIED
1
$139,840
5
$128,362
27
$116,460
8
$51,595
0
$0
0
$0
APPLICATIONS WITHDRAWN
0
$0
5
$141,284
16
$139,024
0
$0
3
$87,760
0
$0
FILES CLOSED FOR INCOMPLETENESS
0
$0
0
$0
4
$142,128
0
$0
0
$0
0
$0
Aggregated Statistics For Year 2006 (Based on 2 partial tracts)
A) FHA, FSA/RHS & VA Home Purchase Loans
B) Conventional Home Purchase Loans
C) Refinancings
D) Home Improvement Loans
F) Non-occupant Loans on < 5 Family Dwellings (A B C & D)
G) Loans On Manufactured Home Dwelling (A B C & D)
Number
Average Value
Number
Average Value
Number
Average Value
Number
Average Value
Number
Average Value
Number
Average Value
LOANS ORIGINATED
11
$109,109
50
$113,818
43
$97,438
13
$17,582
7
$89,414
3
$43,077
APPLICATIONS APPROVED, NOT ACCEPTED
0
$0
4
$95,475
4
$122,118
3
$13,020
0
$0
0
$0
APPLICATIONS DENIED
1
$156,710
8
$105,782
26
$118,362
6
$25,397
0
$0
1
$57,860
APPLICATIONS WITHDRAWN
0
$0
4
$129,712
19
$125,524
0
$0
0
$0
0
$0
FILES CLOSED FOR INCOMPLETENESS
0
$0
1
$184,200
5
$144,082
0
$0
0
$0
0
$0
Aggregated Statistics For Year 2005 (Based on 2 partial tracts)
A) FHA, FSA/RHS & VA Home Purchase Loans
B) Conventional Home Purchase Loans
C) Refinancings
D) Home Improvement Loans
F) Non-occupant Loans on < 5 Family Dwellings (A B C & D)
G) Loans On Manufactured Home Dwelling (A B C & D)
Number
Average Value
Number
Average Value
Number
Average Value
Number
Average Value
Number
Average Value
Number
Average Value
LOANS ORIGINATED
9
$101,583
61
$106,471
63
$114,396
9
$65,043
12
$97,525
2
$64,615
APPLICATIONS APPROVED, NOT ACCEPTED
0
$0
7
$97,197
7
$91,273
0
$0
1
$92,580
0
$0
APPLICATIONS DENIED
0
$0
7
$109,529
34
$116,352
7
$35,614
1
$202,520
2
$88,485
APPLICATIONS WITHDRAWN
0
$0
6
$136,222
21
$131,893
2
$104,395
1
$419,030
0
$0
FILES CLOSED FOR INCOMPLETENESS
0
$0
2
$82,455
9
$122,640
1
$45,810
0
$0
0
$0
Aggregated Statistics For Year 2004 (Based on 2 partial tracts)
A) FHA, FSA/RHS & VA Home Purchase Loans
B) Conventional Home Purchase Loans
C) Refinancings
D) Home Improvement Loans
F) Non-occupant Loans on < 5 Family Dwellings (A B C & D)
G) Loans On Manufactured Home Dwelling (A B C & D)

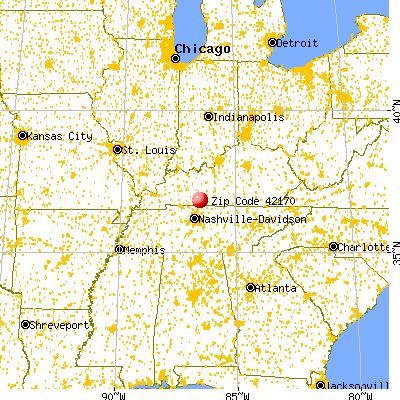


 Nearest zip codes: 42274, 42134, 42104, 42206, 42122, 42102.