Estimated zip code population in 2022: 531 Zip code population in 2010: 664 Zip code population in 2000: 621
Houses and condos: 207 Renter-occupied apartments: 63
% of renters here:
36%
State:
33%
March 2022 cost of living index in zip code 43029: 81.9 (low, U.S. average is 100)
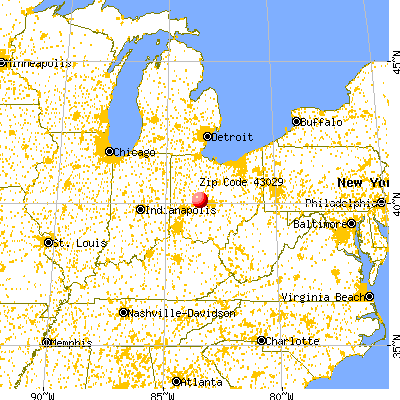
Land area: 23.6 sq. mi. Water area: 0.0 sq. mi.
Population density: 22 people per square mile
(very low).
OSM Map
General Map
Google Map
MSN Map
OSM Map
General Map
Google Map
MSN Map
OSM Map
General Map
Google Map
MSN Map
OSM Map
General Map
Google Map
MSN Map
Please wait while loading the map...
Real estate property taxes paid for housing units in 2022:
This zip code:
0.9% ($2,573)
Ohio:
1.3% ($2,639)
Median real estate property taxes paid for housing units with mortgages in 2022: $3,308 (0.9%) Median real estate property taxes paid for housing units with no mortgage in 2022: $2,175 (1.0%)
Business Search- 14 Million verified businesses
Males: 343
(64.7%)
Females: 187
(35.3%)
For population 25 years and over in 43029:
High school or higher: 91.5%
Bachelor's degree or higher: 33.7%
Graduate or professional degree: 10.2%
Unemployed: 2.3%
Mean travel time to work (commute): 21.6 minutes
For population 15 years and over in 43029:
Never married: 48.3%
Now married: 47.3%
Separated: 0.0%
Widowed: 4.4%
Divorced: 0.0%
Zip code 43029 compared to state average:
Median household income above state average.
Black race population percentage significantly below state average.
Hispanic race population percentage below state average.
Foreign-born population percentage significantly below state average.
Length of stay since moving in significantly above state average.
Estimated median house/condo value in 2022: $295,628
43029:
$295,628
Ohio:
$204,100
Median resident age:
This zip code:
37.4 years
Ohio median age:
39.9 years
Average household size:
This zip code:
2.7 people
Ohio:
2.4 people
Averages for the 2020 tax year for zip code 43029, filed in 2021:
Average Adjusted Gross Income (AGI) in 2020: $60,700 (Individual Income Tax Returns)
Here:
$60,700
State:
$67,288
Salary/wage: $45,730 (reported on 88.5% of returns)
Here:
$45,730
State:
$55,628
(% of AGI for various income ranges: 1306.0% for AGIs below $25k, 4346.0% for AGIs $25k-50k, 7063.3% for AGIs $50k-75k, 4640.0% for AGIs $75k-100k)
Taxable interest for individuals: $283 (reported on 23.1% of returns)
This zip code:
$283
Ohio:
$1,518
(% of AGI for various income ranges: 16.7% for AGIs $50k-75k)
Ordinary dividends: $740 (reported on 19.2% of returns)
Here:
$740
State:
$7,167
(% of AGI for various income ranges: 14.0% for AGIs below $25k, 75.0% for AGIs $75k-100k)
Net capital gain/loss in AGI: +$4,125 (reported on 15.4% of returns)
Here:
+$4,125
State:
+$18,919
(% of AGI for various income ranges: 412.5% for AGIs $75k-100k)
Profit/loss from business: +$6,375 (reported on 15.4% of returns)
Here:
+$6,375
State:
+$13,744
(% of AGI for various income ranges: 510.0% for AGIs $25k-50k)
Earned income credit: $2,233 (reported on 11.5% of returns)
Here:
$2,233
State:
$2,304
(% of AGI for various income ranges: 134.0% for AGIs $25k-50k)
Percentage of individuals using paid preparers for their 2020 taxes: 96.2%
Here:
96%
State:
94%
(% for various income ranges: 87.5% for AGIs below $25k, 100.0% for AGIs $25k-50k, 100.0% for AGIs $50k-75k, 100.0% for AGIs $75k-100k, 100.0% for AGIs $100k-200k)
Averages for the 2012 tax year for zip code 43029, filed in 2013:
Average Adjusted Gross Income (AGI) in 2012: $44,088 (Individual Income Tax Returns)
Here:
$44,088
State:
$54,926
Salary/wage: $39,129 (reported on 80.8% of returns)
Here:
$39,129
State:
$45,869
(% of AGI for various income ranges: 74.4% for AGIs below $25k, 81.5% for AGIs $25k-50k, 77.7% for AGIs $50k-75k, 58.8% for AGIs $100k-200k)
Taxable interest for individuals: $388 (reported on 30.8% of returns)
This zip code:
$388
Ohio:
$1,297
(% of AGI for various income ranges: 0.5% for AGIs below $25k, 0.7% for AGIs $25k-50k, 0.2% for AGIs $50k-75k)
Ordinary dividends: $425 (reported on 15.4% of returns)
Here:
$425
State:
$5,821
(% of AGI for various income ranges: 0.4% for AGIs $50k-75k)
Profit/loss from business: +$6,550 (reported on 15.4% of returns)
Here:
+$6,550
State:
+$12,773
(% of AGI for various income ranges: 10.7% for AGIs $25k-50k)
Total itemized deductions: $16,783 (18% of AGI, reported on 23.1% of returns)
Here:
$16,783
State:
$21,278
Here:
18.3% of AGI
State:
18.8% of AGI
(% of AGI for various income ranges: 25.8% for AGIs $50k-75k)
Charity contributions: $3,580 (reported on 19.2% of returns)
Here:
$3,580
State:
$3,943
(% of AGI for various income ranges: 4.6% for AGIs $50k-75k)
Taxes paid: $6,717 (reported on 23.1% of returns)
43029:
$6,717
State:
$9,568
(% of AGI for various income ranges: 4.4% for AGIs $50k-75k, 5.8% for AGIs $100k-200k)
Earned income credit: $1,575 (reported on 15.4% of returns)
Here:
$1,575
State:
$2,285
(% of AGI for various income ranges: 5.4% for AGIs below $25k)
Percentage of individuals using paid preparers for their 2012 taxes: 42.3%
Here:
42%
State:
51%
(% for various income ranges: 27.3% for AGIs below $25k, 42.9% for AGIs $25k-50k, 50.0% for AGIs $50k-75k, 100.0% for AGIs $100k-200k)
Averages for the 2004 tax year for zip code 43029, filed in 2005:
Average Adjusted Gross Income (AGI) in 2004: $37,818 (Individual Income Tax Returns)
Here:
$37,818
State:
$44,480
Salary/wage: $34,071 (reported on 86.8% of returns)
Here:
$34,071
State:
$39,198
(% of AGI for various income ranges: 83.8% for AGIs below $10k, 76.9% for AGIs $10k-25k, 83.8% for AGIs $25k-50k, 87.5% for AGIs $50k-75k, 123.9% for AGIs $75k-100k)
Taxable interest for individuals: $883 (reported on 45.9% of returns)
This zip code:
$883
Ohio:
$1,532
(% of AGI for various income ranges: 2.8% for AGIs below $10k, 5.8% for AGIs $10k-25k, 0.5% for AGIs $25k-50k, 0.1% for AGIs $50k-75k, 1.0% for AGIs $75k-100k)
Taxable dividends: $1,106 (reported on 19.4% of returns)
Here:
$1,106
State:
$3,496
Net capital gain/loss: +$2,618 (reported on 14.0% of returns)
Here:
+$2,618
State:
+$8,582
Profit/loss from business: +$4,625 (reported on 16.5% of returns)
Here:
+$4,625
State:
+$10,813
Total itemized deductions: $15,138 (22% of AGI, reported on 24.0% of returns)
Here:
$15,138
State:
$17,503
Here:
22.1% of AGI
State:
20.8% of AGI
Charity contributions deductions: $2,878 (4% of AGI, reported on 16.9% of returns)
Here:
$2,878
State:
$3,087
Here:
4.3% of AGI
State:
3.4% of AGI
Total tax: $4,600 (reported on 76.4% of returns)
43029:
$4,600
State:
$6,781
(% of AGI for various income ranges: 4.9% for AGIs below $10k, 5.8% for AGIs $10k-25k, 6.2% for AGIs $25k-50k, 9.5% for AGIs $50k-75k, 10.4% for AGIs $75k-100k, 15.9% for AGIs over 100k)
Earned income credit: $1,741 (reported on 11.2% of returns)
Here:
$1,741
State:
$1,696
Percentage of individuals using paid preparers for their 2004 taxes: 56.6%
Here:
57%
State:
55%
(% for various income ranges: 57.4% for AGIs below $10k, 51.9% for AGIs $10k-25k, 59.1% for AGIs $25k-50k, 54.1% for AGIs $50k-75k, 90.5% for AGIs $75k-100k)
In group quarters: 58 (-1 institutionalized population)
Size of family households: 72 2-persons, 40 3-persons, 11 4-persons, 10 5-persons, 6 6-persons
Size of nonfamily households: 26 1-person, 5 2-persons
47 married couples with children.
45 single-parent households (45 women).
98.9% of residents of 43029 zip code speak English at home.
0.8% of residents speak Asian or Pacific Island language at home (100% very well).
Foreign born population: 5 (1.0%) (100.0% of them are naturalized citizens)
This zip code:
1.0%
Whole state:
5.0%
80%Bhutan
34%German
12%American
11%European
10%English
6%Irish
3%Scotch-Irish
3%Italian
Year of entry for the foreign-born population
02010 or later
42000 to 2009
01990 to 1999
0Before 1990
Housing units lacking complete plumbing facilities: 8.3% Housing units lacking complete kitchen facilities: 13.7%
64.2%Bottled, tank, or LP gas
25.9%Electricity
5.9%Fuel oil, kerosene, etc.
4.7%No fuel used
Population in 1990: 498. Population change in the 1990s: +123 (+24.7%).
Place of birth for U.S.-born residents:
This state: 431
Northeast: 23
Midwest: 44
South: 6
West: 19
48% of the 43029 zip code residents lived in the same house 5 years ago. Out of people who lived in different houses, 12% lived in this county. Out of people who lived in different counties, 50% lived in Ohio.
101% of the 43029 zip code residents lived in the same house 1 year ago.
Private vs. public school enrollment:
Students in private schools in grades 1 to 8 (elementary and middle school):
Here:
0.0%
Ohio:
16.0%
Students in private schools in grades 9 to 12 (high school):
Here:
0.0%
Ohio:
13.1%
Students in private undergraduate colleges: 18
Here:
29.0%
Ohio:
22.3%
Occupation by median earnings in the past 12 months ($)
83,033Education, training, and library occupations
60,180Construction and extraction occupations
56,454Installation, maintenance, and repair occupations
38,536Management occupations
Top industries in this zip code by the number of employees in 2005:
Other Services (except Public Administration): Religious Organizations (20-49 employees: 1 establishment, 1-4 employees: 1 establishment)
People in group quarters in 2010:
74 people in college/university student housing
People in group quarters in 2000:
117 people in college dormitories (includes college quarters off campus)
Fatal accident statistics in 2010:
Fatal accident count: 1
Vehicles involved in fatal accidents: 1
Fatal accidents caused by drunken drivers: 1
Fatalities: 1
Persons involved in fatal accidents: 1
Pedestrians involved in fatal accidents: 0
Home Mortgage Disclosure Act Aggregated Statistics For Year 2009 (Based on 2 partial tracts)
A) FHA, FSA/RHS & VA Home Purchase Loans
B) Conventional Home Purchase Loans
C) Refinancings
D) Home Improvement Loans
F) Non-occupant Loans on < 5 Family Dwellings (A B C & D)
G) Loans On Manufactured Home Dwelling (A B C & D)
Number
Average Value
Number
Average Value
Number
Average Value
Number
Average Value
Number
Average Value
Number
Average Value
LOANS ORIGINATED
6
$171,063
11
$182,075
73
$178,469
2
$65,495
3
$134,803
0
$0
APPLICATIONS APPROVED, NOT ACCEPTED
0
$0
0
$0
5
$183,932
0
$0
0
$0
0
$0
APPLICATIONS DENIED
1
$235,870
3
$117,553
16
$161,331
3
$43,053
0
$0
1
$36,180
APPLICATIONS WITHDRAWN
2
$197,400
1
$249,150
8
$218,008
0
$0
0
$0
0
$0
FILES CLOSED FOR INCOMPLETENESS
0
$0
0
$0
3
$204,880
0
$0
0
$0
0
$0
Aggregated Statistics For Year 2008 (Based on 2 partial tracts)
A) FHA, FSA/RHS & VA Home Purchase Loans
B) Conventional Home Purchase Loans
C) Refinancings
D) Home Improvement Loans
F) Non-occupant Loans on < 5 Family Dwellings (A B C & D)
G) Loans On Manufactured Home Dwelling (A B C & D)
Number
Average Value
Number
Average Value
Number
Average Value
Number
Average Value
Number
Average Value
Number
Average Value
LOANS ORIGINATED
5
$160,666
16
$179,221
27
$187,526
5
$21,526
5
$121,096
2
$78,775
APPLICATIONS APPROVED, NOT ACCEPTED
0
$0
4
$122,515
5
$245,946
0
$0
0
$0
2
$58,855
APPLICATIONS DENIED
1
$239,080
3
$143,660
14
$194,486
5
$12,916
1
$128,700
2
$22,215
APPLICATIONS WITHDRAWN
1
$285,790
2
$276,630
8
$170,204
0
$0
0
$0
0
$0
FILES CLOSED FOR INCOMPLETENESS
0
$0
0
$0
0
$0
0
$0
0
$0
0
$0
Aggregated Statistics For Year 2007 (Based on 2 partial tracts)
A) FHA, FSA/RHS & VA Home Purchase Loans
B) Conventional Home Purchase Loans
C) Refinancings
D) Home Improvement Loans
F) Non-occupant Loans on < 5 Family Dwellings (A B C & D)
G) Loans On Manufactured Home Dwelling (A B C & D)
Number
Average Value
Number
Average Value
Number
Average Value
Number
Average Value
Number
Average Value
Number
Average Value
LOANS ORIGINATED
4
$166,368
38
$160,179
33
$164,547
8
$34,865
7
$80,936
1
$9,160
APPLICATIONS APPROVED, NOT ACCEPTED
0
$0
1
$251,440
11
$155,012
1
$39,850
0
$0
0
$0
APPLICATIONS DENIED
1
$192,360
6
$103,050
30
$176,956
5
$17,404
2
$127,095
3
$22,443
APPLICATIONS WITHDRAWN
0
$0
3
$145,643
11
$199,771
0
$0
0
$0
0
$0
FILES CLOSED FOR INCOMPLETENESS
0
$0
0
$0
4
$200,718
0
$0
0
$0
0
$0
Aggregated Statistics For Year 2006 (Based on 2 partial tracts)
A) FHA, FSA/RHS & VA Home Purchase Loans
B) Conventional Home Purchase Loans
C) Refinancings
D) Home Improvement Loans
F) Non-occupant Loans on < 5 Family Dwellings (A B C & D)
G) Loans On Manufactured Home Dwelling (A B C & D)
Number
Average Value
Number
Average Value
Number
Average Value
Number
Average Value
Number
Average Value
Number
Average Value
LOANS ORIGINATED
1
$176,790
42
$168,926
47
$133,453
5
$72,914
4
$118,278
4
$42,822
APPLICATIONS APPROVED, NOT ACCEPTED
0
$0
3
$123,660
10
$149,354
2
$15,115
0
$0
1
$13,280
APPLICATIONS DENIED
1
$194,190
5
$105,890
30
$127,477
6
$27,557
1
$110,840
5
$37,372
APPLICATIONS WITHDRAWN
0
$0
2
$256,250
17
$156,097
1
$85,650
1
$365,940
0
$0
FILES CLOSED FOR INCOMPLETENESS
0
$0
0
$0
5
$159,658
0
$0
0
$0
0
$0
Aggregated Statistics For Year 2005 (Based on 2 partial tracts)
A) FHA, FSA/RHS & VA Home Purchase Loans
B) Conventional Home Purchase Loans
C) Refinancings
D) Home Improvement Loans
F) Non-occupant Loans on < 5 Family Dwellings (A B C & D)
G) Loans On Manufactured Home Dwelling (A B C & D)
Number
Average Value
Number
Average Value
Number
Average Value
Number
Average Value
Number
Average Value
Number
Average Value
LOANS ORIGINATED
5
$158,468
44
$164,078
49
$166,478
5
$26,930
5
$143,904
3
$39,693
APPLICATIONS APPROVED, NOT ACCEPTED
0
$0
9
$99,640
10
$113,905
1
$71,910
0
$0
3
$27,787
APPLICATIONS DENIED
1
$159,840
13
$119,644
32
$135,740
5
$22,442
1
$32,520
5
$26,290
APPLICATIONS WITHDRAWN
0
$0
10
$122,194
14
$130,039
3
$140,300
1
$51,750
0
$0
FILES CLOSED FOR INCOMPLETENESS
0
$0
1
$132,360
4
$236,558
0
$0
0
$0
0
$0
Aggregated Statistics For Year 2004 (Based on 2 partial tracts)
A) FHA, FSA/RHS & VA Home Purchase Loans
B) Conventional Home Purchase Loans
C) Refinancings
D) Home Improvement Loans
F) Non-occupant Loans on < 5 Family Dwellings (A B C & D)
G) Loans On Manufactured Home Dwelling (A B C & D)
Number
Average Value
Number
Average Value
Number
Average Value
Number
Average Value
Number
Average Value
Number
Average Value
LOANS ORIGINATED
5
$172,850
65
$160,843
68
$152,460
5
$75,570
2
$149,310
3
$14,047
APPLICATIONS APPROVED, NOT ACCEPTED
0
$0
5
$141,522
13
$151,211
1
$16,030
0
$0
1
$39,390
APPLICATIONS DENIED
0
$0
16
$85,761
32
$131,747
7
$59,933
4
$85,990
6
$18,778
APPLICATIONS WITHDRAWN
1
$282,130
5
$148,484
22
$164,235
0
$0
0
$0
0
$0
FILES CLOSED FOR INCOMPLETENESS
0
$0
2
$96,410
5
$184,848
1
$12,370
0
$0
0
$0
Aggregated Statistics For Year 2003 (Based on 2 partial tracts)
A) FHA, FSA/RHS & VA Home Purchase Loans
B) Conventional Home Purchase Loans
C) Refinancings
D) Home Improvement Loans
F) Non-occupant Loans on < 5 Family Dwellings (A B C & D)
Number
Average Value
Number
Average Value
Number
Average Value
Number
Average Value
Number
Average Value
LOANS ORIGINATED
10
$181,322
42
$160,191
153
$151,320
4
$34,008
3
$53,740
APPLICATIONS APPROVED, NOT ACCEPTED
1
$206,560
6
$158,850
18
$140,377
0
$0
0
$0
APPLICATIONS DENIED
4
$185,720
6
$112,973
37
$120,083
6
$18,855
0
$0
APPLICATIONS WITHDRAWN
1
$274,340
5
$95,264
26
$154,716
0
$0
1
$45,800
FILES CLOSED FOR INCOMPLETENESS
0
$0
3
$113,127
9
$158,316
0
$0
0
$0
Aggregated Statistics For Year 2002 (Based on 2 partial tracts)
A) FHA, FSA/RHS & VA Home Purchase Loans
B) Conventional Home Purchase Loans
C) Refinancings
D) Home Improvement Loans
F) Non-occupant Loans on < 5 Family Dwellings (A B C & D)
Number
Average Value
Number
Average Value
Number
Average Value
Number
Average Value
Number
Average Value
LOANS ORIGINATED
19
$176,571
47
$146,472
88
$139,544
6
$83,738
3
$67,020
APPLICATIONS APPROVED, NOT ACCEPTED
1
$242,740
14
$110,607
12
$123,049
1
$11,450
0
$0
APPLICATIONS DENIED
3
$158,163
13
$56,510
21
$103,399
3
$6,717
1
$59,540
APPLICATIONS WITHDRAWN
3
$180,147
4
$95,035
16
$137,514
0
$0
1
$74,650
FILES CLOSED FOR INCOMPLETENESS
0
$0
0
$0
6
$158,545
0
$0
0
$0
Aggregated Statistics For Year 2001 (Based on 2 partial tracts)
A) FHA, FSA/RHS & VA Home Purchase Loans
B) Conventional Home Purchase Loans
C) Refinancings
D) Home Improvement Loans
F) Non-occupant Loans on < 5 Family Dwellings (A B C & D)
Number
Average Value
Number
Average Value
Number
Average Value
Number
Average Value
Number
Average Value
LOANS ORIGINATED
16
$168,945
38
$123,552
84
$129,968
6
$20,533
11
$80,442
APPLICATIONS APPROVED, NOT ACCEPTED
0
$0
6
$29,998
11
$114,208
3
$43,663
1
$99,390
APPLICATIONS DENIED
0
$0
19
$28,444
29
$100,049
5
$13,924
0
$0
APPLICATIONS WITHDRAWN
1
$257,400
3
$87,937
14
$125,034
1
$17,860
1
$86,100
FILES CLOSED FOR INCOMPLETENESS
0
$0
0
$0
6
$198,008
0
$0
0
$0
Aggregated Statistics For Year 2000 (Based on 2 partial tracts)
A) FHA, FSA/RHS & VA Home Purchase Loans
B) Conventional Home Purchase Loans
C) Refinancings
D) Home Improvement Loans
F) Non-occupant Loans on < 5 Family Dwellings (A B C & D)
Number
Average Value
Number
Average Value
Number
Average Value
Number
Average Value
Number
Average Value
LOANS ORIGINATED
1
$135,110
43
$104,200
22
$104,715
8
$15,515
2
$91,370
APPLICATIONS APPROVED, NOT ACCEPTED
1
$89,770
11
$35,765
9
$84,119
5
$13,282
1
$84,730
APPLICATIONS DENIED
2
$78,320
47
$26,087
12
$67,059
4
$8,472
0
$0
APPLICATIONS WITHDRAWN
2
$125,720
3
$61,523
8
$75,112
2
$17,860
0
$0
FILES CLOSED FOR INCOMPLETENESS
0
$0
0
$0
0
$0
0
$0
0
$0
Aggregated Statistics For Year 1999 (Based on 1 partial tract)
A) FHA, FSA/RHS & VA Home Purchase Loans
B) Conventional Home Purchase Loans
C) Refinancings
D) Home Improvement Loans
F) Non-occupant Loans on < 5 Family Dwellings (A B C & D)


 Nearest zip codes: 43045, 43077, 43044, 43084, 43064, 43060.


