Estimated zip code population in 2022: 19,963
Zip code population in 2010: 20,149
Zip code population in 2000: 20,796
Houses and condos: 9,920
Renter-occupied apartments: 3,172
% of renters here:
34%State:
33%
March 2022 cost of living index in zip code 43623: 92.3
(less than average, U.S. average is 100)
Land area: 6.7
sq. mi.
Water area: 0.0
sq. mi.
Population density: 2,969 people per square mile (average).
OSM Map
General Map
Google Map
MSN Map
OSM Map
General Map
Google Map
MSN Map
OSM Map
General Map
Google Map
MSN Map
OSM Map
General Map
Google Map
MSN Map
Please wait while loading the map...
Real estate property taxes paid for housing units in 2022:
This zip code:
1.6% ($2,900)Ohio:
1.3% ($2,639)
Median real estate property taxes paid for housing units with mortgages in 2022: $2,846 (1.6%)
Median real estate property taxes paid for housing units with no mortgage in 2022: $3,023 (1.6%)
Profiles of local businesses
Business Search - 14 Million verified businesses
Males: 9,934 Females: 10,029
For population 25 years and over in 43623:
High school or higher: 92.5%Bachelor's degree or higher: 35.2%Graduate or professional degree: 13.2%Unemployed: 4.9%Mean travel time to work (commute): 21.4 minutes
For population 15 years and over in 43623:
Never married: 35.6%Now married: 45.5%Separated: 1.8%Widowed: 4.7%Divorced: 12.5%
Zip code 43623 compared to state average:
Black race population percentage below state average. Hispanic race population percentage above state average. Length of stay since moving in significantly above state average. 15,495 77.6% White 1,716 8.6% Hispanic or Latino 1,225 6.1% Black 934 4.7% Two or more races 555 2.8% Asian 24 0.1% Some other race 6 0.03% American Indian 4 0.02% Native Hawaiian and Other
Data:
Median household income ($)
Median household income (% change since 2000)
Household income diversity
Ratio of average income to average house value (%)
Ratio of average income to average rent
Median household income ($) - White
Median household income ($) - Black or African American
Median household income ($) - Asian
Median household income ($) - Hispanic or Latino
Median household income ($) - American Indian and Alaska Native
Median household income ($) - Multirace
Median household income ($) - Other Race
Median household income for houses/condos with a mortgage ($)
Median household income for apartments without a mortgage ($)
Races - White alone (%)
Races - White alone (% change since 2000)
Races - Black alone (%)
Races - Black alone (% change since 2000)
Races - American Indian alone (%)
Races - American Indian alone (% change since 2000)
Races - Asian alone (%)
Races - Asian alone (% change since 2000)
Races - Hispanic (%)
Races - Hispanic (% change since 2000)
Races - Native Hawaiian and Other Pacific Islander alone (%)
Races - Native Hawaiian and Other Pacific Islander alone (% change since 2000)
Races - Two or more races (%)
Races - Two or more races (% change since 2000)
Races - Other race alone (%)
Races - Other race alone (% change since 2000)
Racial diversity
Unemployment (%)
Unemployment (% change since 2000)
Unemployment (%) - White
Unemployment (%) - Black or African American
Unemployment (%) - Asian
Unemployment (%) - Hispanic or Latino
Unemployment (%) - American Indian and Alaska Native
Unemployment (%) - Multirace
Unemployment (%) - Other Race
Population density (people per square mile)
Population - Males (%)
Population - Females (%)
Population - Males (%) - White
Population - Males (%) - Black or African American
Population - Males (%) - Asian
Population - Males (%) - Hispanic or Latino
Population - Males (%) - American Indian and Alaska Native
Population - Males (%) - Multirace
Population - Males (%) - Other Race
Population - Females (%) - White
Population - Females (%) - Black or African American
Population - Females (%) - Asian
Population - Females (%) - Hispanic or Latino
Population - Females (%) - American Indian and Alaska Native
Population - Females (%) - Multirace
Population - Females (%) - Other Race
Coronavirus confirmed cases (Jun 16, 2024)
Deaths caused by coronavirus (Jun 16, 2024)
Coronavirus confirmed cases (per 100k population) (Jun 16, 2024)
Deaths caused by coronavirus (per 100k population) (Jun 16, 2024)
Daily increase in number of cases (Jun 16, 2024)
Weekly increase in number of cases (Jun 16, 2024)
Cases doubled (in days) (Jun 16, 2024)
Hospitalized patients (Apr 18, 2022)
Negative test results (Apr 18, 2022)
Total test results (Apr 18, 2022)
COVID Vaccine doses distributed (per 100k population) (Sep 19, 2023)
COVID Vaccine doses administered (per 100k population) (Sep 19, 2023)
COVID Vaccine doses distributed (Sep 19, 2023)
COVID Vaccine doses administered (Sep 19, 2023)
Likely homosexual households (%)
Likely homosexual households (% change since 2000)
Likely homosexual households - Lesbian couples (%)
Likely homosexual households - Lesbian couples (% change since 2000)
Likely homosexual households - Gay men (%)
Likely homosexual households - Gay men (% change since 2000)
Cost of living index
Median gross rent ($)
Median contract rent ($)
Median monthly housing costs ($)
Median house or condo value ($)
Median house or condo value ($ change since 2000)
Mean house or condo value by units in structure - 1, detached ($)
Mean house or condo value by units in structure - 1, attached ($)
Mean house or condo value by units in structure - 2 ($)
Mean house or condo value by units in structure by units in structure - 3 or 4 ($)
Mean house or condo value by units in structure - 5 or more ($)
Mean house or condo value by units in structure - Boat, RV, van, etc. ($)
Mean house or condo value by units in structure - Mobile home ($)
Median house or condo value ($) - White
Median house or condo value ($) - Black or African American
Median house or condo value ($) - Asian
Median house or condo value ($) - Hispanic or Latino
Median house or condo value ($) - American Indian and Alaska Native
Median house or condo value ($) - Multirace
Median house or condo value ($) - Other Race
Median resident age
Resident age diversity
Median resident age - Males
Median resident age - Females
Median resident age - White
Median resident age - Black or African American
Median resident age - Asian
Median resident age - Hispanic or Latino
Median resident age - American Indian and Alaska Native
Median resident age - Multirace
Median resident age - Other Race
Median resident age - Males - White
Median resident age - Males - Black or African American
Median resident age - Males - Asian
Median resident age - Males - Hispanic or Latino
Median resident age - Males - American Indian and Alaska Native
Median resident age - Males - Multirace
Median resident age - Males - Other Race
Median resident age - Females - White
Median resident age - Females - Black or African American
Median resident age - Females - Asian
Median resident age - Females - Hispanic or Latino
Median resident age - Females - American Indian and Alaska Native
Median resident age - Females - Multirace
Median resident age - Females - Other Race
Commute - mean travel time to work (minutes)
Travel time to work - Less than 5 minutes (%)
Travel time to work - Less than 5 minutes (% change since 2000)
Travel time to work - 5 to 9 minutes (%)
Travel time to work - 5 to 9 minutes (% change since 2000)
Travel time to work - 10 to 19 minutes (%)
Travel time to work - 10 to 19 minutes (% change since 2000)
Travel time to work - 20 to 29 minutes (%)
Travel time to work - 20 to 29 minutes (% change since 2000)
Travel time to work - 30 to 39 minutes (%)
Travel time to work - 30 to 39 minutes (% change since 2000)
Travel time to work - 40 to 59 minutes (%)
Travel time to work - 40 to 59 minutes (% change since 2000)
Travel time to work - 60 to 89 minutes (%)
Travel time to work - 60 to 89 minutes (% change since 2000)
Travel time to work - 90 or more minutes (%)
Travel time to work - 90 or more minutes (% change since 2000)
Marital status - Never married (%)
Marital status - Now married (%)
Marital status - Separated (%)
Marital status - Widowed (%)
Marital status - Divorced (%)
Median family income ($)
Median family income (% change since 2000)
Median non-family income ($)
Median non-family income (% change since 2000)
Median per capita income ($)
Median per capita income (% change since 2000)
Median family income ($) - White
Median family income ($) - Black or African American
Median family income ($) - Asian
Median family income ($) - Hispanic or Latino
Median family income ($) - American Indian and Alaska Native
Median family income ($) - Multirace
Median family income ($) - Other Race
Median year house/condo built
Median year apartment built
Year house built - Built 2005 or later (%)
Year house built - Built 2000 to 2004 (%)
Year house built - Built 1990 to 1999 (%)
Year house built - Built 1980 to 1989 (%)
Year house built - Built 1970 to 1979 (%)
Year house built - Built 1960 to 1969 (%)
Year house built - Built 1950 to 1959 (%)
Year house built - Built 1940 to 1949 (%)
Year house built - Built 1939 or earlier (%)
Average household size
Household density (households per square mile)
Average household size - White
Average household size - Black or African American
Average household size - Asian
Average household size - Hispanic or Latino
Average household size - American Indian and Alaska Native
Average household size - Multirace
Average household size - Other Race
Occupied housing units (%)
Vacant housing units (%)
Owner occupied housing units (%)
Renter occupied housing units (%)
Vacancy status - For rent (%)
Vacancy status - For sale only (%)
Vacancy status - Rented or sold, not occupied (%)
Vacancy status - For seasonal, recreational, or occasional use (%)
Vacancy status - For migrant workers (%)
Vacancy status - Other vacant (%)
Residents with income below the poverty level (%)
Residents with income below 50% of the poverty level (%)
Children below poverty level (%)
Poor families by family type - Married-couple family (%)
Poor families by family type - Male, no wife present (%)
Poor families by family type - Female, no husband present (%)
Poverty status for native-born residents (%)
Poverty status for foreign-born residents (%)
Poverty among high school graduates not in families (%)
Poverty among people who did not graduate high school not in families (%)
Residents with income below the poverty level (%) - White
Residents with income below the poverty level (%) - Black or African American
Residents with income below the poverty level (%) - Asian
Residents with income below the poverty level (%) - Hispanic or Latino
Residents with income below the poverty level (%) - American Indian and Alaska Native
Residents with income below the poverty level (%) - Multirace
Residents with income below the poverty level (%) - Other Race
Air pollution - Air Quality Index (AQI)
Air pollution - CO
Air pollution - NO2
Air pollution - SO2
Air pollution - Ozone
Air pollution - PM10
Air pollution - PM25
Air pollution - Pb
Crime - Murders per 100,000 population
Crime - Rapes per 100,000 population
Crime - Robberies per 100,000 population
Crime - Assaults per 100,000 population
Crime - Burglaries per 100,000 population
Crime - Thefts per 100,000 population
Crime - Auto thefts per 100,000 population
Crime - Arson per 100,000 population
Crime - City-data.com crime index
Crime - Violent crime index
Crime - Property crime index
Crime - Murders per 100,000 population (5 year average)
Crime - Rapes per 100,000 population (5 year average)
Crime - Robberies per 100,000 population (5 year average)
Crime - Assaults per 100,000 population (5 year average)
Crime - Burglaries per 100,000 population (5 year average)
Crime - Thefts per 100,000 population (5 year average)
Crime - Auto thefts per 100,000 population (5 year average)
Crime - Arson per 100,000 population (5 year average)
Crime - City-data.com crime index (5 year average)
Crime - Violent crime index (5 year average)
Crime - Property crime index (5 year average)
1996 Presidential Elections Results (%) - Democratic Party (Clinton)
1996 Presidential Elections Results (%) - Republican Party (Dole)
1996 Presidential Elections Results (%) - Other
2000 Presidential Elections Results (%) - Democratic Party (Gore)
2000 Presidential Elections Results (%) - Republican Party (Bush)
2000 Presidential Elections Results (%) - Other
2004 Presidential Elections Results (%) - Democratic Party (Kerry)
2004 Presidential Elections Results (%) - Republican Party (Bush)
2004 Presidential Elections Results (%) - Other
2008 Presidential Elections Results (%) - Democratic Party (Obama)
2008 Presidential Elections Results (%) - Republican Party (McCain)
2008 Presidential Elections Results (%) - Other
2012 Presidential Elections Results (%) - Democratic Party (Obama)
2012 Presidential Elections Results (%) - Republican Party (Romney)
2012 Presidential Elections Results (%) - Other
2016 Presidential Elections Results (%) - Democratic Party (Clinton)
2016 Presidential Elections Results (%) - Republican Party (Trump)
2016 Presidential Elections Results (%) - Other
2020 Presidential Elections Results (%) - Democratic Party (Biden)
2020 Presidential Elections Results (%) - Republican Party (Trump)
2020 Presidential Elections Results (%) - Other
Ancestries Reported - Arab (%)
Ancestries Reported - Czech (%)
Ancestries Reported - Danish (%)
Ancestries Reported - Dutch (%)
Ancestries Reported - English (%)
Ancestries Reported - French (%)
Ancestries Reported - French Canadian (%)
Ancestries Reported - German (%)
Ancestries Reported - Greek (%)
Ancestries Reported - Hungarian (%)
Ancestries Reported - Irish (%)
Ancestries Reported - Italian (%)
Ancestries Reported - Lithuanian (%)
Ancestries Reported - Norwegian (%)
Ancestries Reported - Polish (%)
Ancestries Reported - Portuguese (%)
Ancestries Reported - Russian (%)
Ancestries Reported - Scotch-Irish (%)
Ancestries Reported - Scottish (%)
Ancestries Reported - Slovak (%)
Ancestries Reported - Subsaharan African (%)
Ancestries Reported - Swedish (%)
Ancestries Reported - Swiss (%)
Ancestries Reported - Ukrainian (%)
Ancestries Reported - United States (%)
Ancestries Reported - Welsh (%)
Ancestries Reported - West Indian (%)
Ancestries Reported - Other (%)
Educational Attainment - No schooling completed (%)
Educational Attainment - Less than high school (%)
Educational Attainment - High school or equivalent (%)
Educational Attainment - Less than 1 year of college (%)
Educational Attainment - 1 or more years of college (%)
Educational Attainment - Associate degree (%)
Educational Attainment - Bachelor's degree (%)
Educational Attainment - Master's degree (%)
Educational Attainment - Professional school degree (%)
Educational Attainment - Doctorate degree (%)
School Enrollment - Nursery, preschool (%)
School Enrollment - Kindergarten (%)
School Enrollment - Grade 1 to 4 (%)
School Enrollment - Grade 5 to 8 (%)
School Enrollment - Grade 9 to 12 (%)
School Enrollment - College undergrad (%)
School Enrollment - Graduate or professional (%)
School Enrollment - Not enrolled in school (%)
School enrollment - Public schools (%)
School enrollment - Private schools (%)
School enrollment - Not enrolled (%)
Median number of rooms in houses and condos
Median number of rooms in apartments
Housing units lacking complete plumbing facilities (%)
Housing units lacking complete kitchen facilities (%)
Density of houses
Urban houses (%)
Rural houses (%)
Households with people 60 years and over (%)
Households with people 65 years and over (%)
Households with people 75 years and over (%)
Households with one or more nonrelatives (%)
Households with no nonrelatives (%)
Population in households (%)
Family households (%)
Nonfamily households (%)
Population in families (%)
Family households with own children (%)
Median number of bedrooms in owner occupied houses
Mean number of bedrooms in owner occupied houses
Median number of bedrooms in renter occupied houses
Mean number of bedrooms in renter occupied houses
Median number of vehichles in owner occupied houses
Mean number of vehichles in owner occupied houses
Median number of vehichles in renter occupied houses
Mean number of vehichles in renter occupied houses
Mortgage status - with mortgage (%)
Mortgage status - with second mortgage (%)
Mortgage status - with home equity loan (%)
Mortgage status - with both second mortgage and home equity loan (%)
Mortgage status - without a mortgage (%)
Average family size
Average family size - White
Average family size - Black or African American
Average family size - Asian
Average family size - Hispanic or Latino
Average family size - American Indian and Alaska Native
Average family size - Multirace
Average family size - Other Race
Geographical mobility - Same house 1 year ago (%)
Geographical mobility - Moved within same county (%)
Geographical mobility - Moved from different county within same state (%)
Geographical mobility - Moved from different state (%)
Geographical mobility - Moved from abroad (%)
Place of birth - Born in state of residence (%)
Place of birth - Born in other state (%)
Place of birth - Native, outside of US (%)
Place of birth - Foreign born (%)
Housing units in structures - 1, detached (%)
Housing units in structures - 1, attached (%)
Housing units in structures - 2 (%)
Housing units in structures - 3 or 4 (%)
Housing units in structures - 5 to 9 (%)
Housing units in structures - 10 to 19 (%)
Housing units in structures - 20 to 49 (%)
Housing units in structures - 50 or more (%)
Housing units in structures - Mobile home (%)
Housing units in structures - Boat, RV, van, etc. (%)
House/condo owner moved in on average (years ago)
Renter moved in on average (years ago)
Year householder moved into unit - Moved in 1999 to March 2000 (%)
Year householder moved into unit - Moved in 1995 to 1998 (%)
Year householder moved into unit - Moved in 1990 to 1994 (%)
Year householder moved into unit - Moved in 1980 to 1989 (%)
Year householder moved into unit - Moved in 1970 to 1979 (%)
Year householder moved into unit - Moved in 1969 or earlier (%)
Means of transportation to work - Drove car alone (%)
Means of transportation to work - Carpooled (%)
Means of transportation to work - Public transportation (%)
Means of transportation to work - Bus or trolley bus (%)
Means of transportation to work - Streetcar or trolley car (%)
Means of transportation to work - Subway or elevated (%)
Means of transportation to work - Railroad (%)
Means of transportation to work - Ferryboat (%)
Means of transportation to work - Taxicab (%)
Means of transportation to work - Motorcycle (%)
Means of transportation to work - Bicycle (%)
Means of transportation to work - Walked (%)
Means of transportation to work - Other means (%)
Working at home (%)
Industry diversity
Most Common Industries - Agriculture, forestry, fishing and hunting, and mining (%)
Most Common Industries - Agriculture, forestry, fishing and hunting (%)
Most Common Industries - Mining, quarrying, and oil and gas extraction (%)
Most Common Industries - Construction (%)
Most Common Industries - Manufacturing (%)
Most Common Industries - Wholesale trade (%)
Most Common Industries - Retail trade (%)
Most Common Industries - Transportation and warehousing, and utilities (%)
Most Common Industries - Transportation and warehousing (%)
Most Common Industries - Utilities (%)
Most Common Industries - Information (%)
Most Common Industries - Finance and insurance, and real estate and rental and leasing (%)
Most Common Industries - Finance and insurance (%)
Most Common Industries - Real estate and rental and leasing (%)
Most Common Industries - Professional, scientific, and management, and administrative and waste management services (%)
Most Common Industries - Professional, scientific, and technical services (%)
Most Common Industries - Management of companies and enterprises (%)
Most Common Industries - Administrative and support and waste management services (%)
Most Common Industries - Educational services, and health care and social assistance (%)
Most Common Industries - Educational services (%)
Most Common Industries - Health care and social assistance (%)
Most Common Industries - Arts, entertainment, and recreation, and accommodation and food services (%)
Most Common Industries - Arts, entertainment, and recreation (%)
Most Common Industries - Accommodation and food services (%)
Most Common Industries - Other services, except public administration (%)
Most Common Industries - Public administration (%)
Occupation diversity
Most Common Occupations - Management, business, science, and arts occupations (%)
Most Common Occupations - Management, business, and financial occupations (%)
Most Common Occupations - Management occupations (%)
Most Common Occupations - Business and financial operations occupations (%)
Most Common Occupations - Computer, engineering, and science occupations (%)
Most Common Occupations - Computer and mathematical occupations (%)
Most Common Occupations - Architecture and engineering occupations (%)
Most Common Occupations - Life, physical, and social science occupations (%)
Most Common Occupations - Education, legal, community service, arts, and media occupations (%)
Most Common Occupations - Community and social service occupations (%)
Most Common Occupations - Legal occupations (%)
Most Common Occupations - Education, training, and library occupations (%)
Most Common Occupations - Arts, design, entertainment, sports, and media occupations (%)
Most Common Occupations - Healthcare practitioners and technical occupations (%)
Most Common Occupations - Health diagnosing and treating practitioners and other technical occupations (%)
Most Common Occupations - Health technologists and technicians (%)
Most Common Occupations - Service occupations (%)
Most Common Occupations - Healthcare support occupations (%)
Most Common Occupations - Protective service occupations (%)
Most Common Occupations - Fire fighting and prevention, and other protective service workers including supervisors (%)
Most Common Occupations - Law enforcement workers including supervisors (%)
Most Common Occupations - Food preparation and serving related occupations (%)
Most Common Occupations - Building and grounds cleaning and maintenance occupations (%)
Most Common Occupations - Personal care and service occupations (%)
Most Common Occupations - Sales and office occupations (%)
Most Common Occupations - Sales and related occupations (%)
Most Common Occupations - Office and administrative support occupations (%)
Most Common Occupations - Natural resources, construction, and maintenance occupations (%)
Most Common Occupations - Farming, fishing, and forestry occupations (%)
Most Common Occupations - Construction and extraction occupations (%)
Most Common Occupations - Installation, maintenance, and repair occupations (%)
Most Common Occupations - Production, transportation, and material moving occupations (%)
Most Common Occupations - Production occupations (%)
Most Common Occupations - Transportation occupations (%)
Most Common Occupations - Material moving occupations (%)
People in Group quarters - Institutionalized population (%)
People in Group quarters - Correctional institutions (%)
People in Group quarters - Federal prisons and detention centers (%)
People in Group quarters - Halfway houses (%)
People in Group quarters - Local jails and other confinement facilities (including police lockups) (%)
People in Group quarters - Military disciplinary barracks (%)
People in Group quarters - State prisons (%)
People in Group quarters - Other types of correctional institutions (%)
People in Group quarters - Nursing homes (%)
People in Group quarters - Hospitals/wards, hospices, and schools for the handicapped (%)
People in Group quarters - Hospitals/wards and hospices for chronically ill (%)
People in Group quarters - Hospices or homes for chronically ill (%)
People in Group quarters - Military hospitals or wards for chronically ill (%)
People in Group quarters - Other hospitals or wards for chronically ill (%)
People in Group quarters - Hospitals or wards for drug/alcohol abuse (%)
People in Group quarters - Mental (Psychiatric) hospitals or wards (%)
People in Group quarters - Schools, hospitals, or wards for the mentally retarded (%)
People in Group quarters - Schools, hospitals, or wards for the physically handicapped (%)
People in Group quarters - Institutions for the deaf (%)
People in Group quarters - Institutions for the blind (%)
People in Group quarters - Orthopedic wards and institutions for the physically handicapped (%)
People in Group quarters - Wards in general hospitals for patients who have no usual home elsewhere (%)
People in Group quarters - Wards in military hospitals for patients who have no usual home elsewhere (%)
People in Group quarters - Juvenile institutions (%)
People in Group quarters - Long-term care (%)
People in Group quarters - Homes for abused, dependent, and neglected children (%)
People in Group quarters - Residential treatment centers for emotionally disturbed children (%)
People in Group quarters - Training schools for juvenile delinquents (%)
People in Group quarters - Short-term care, detention or diagnostic centers for delinquent children (%)
People in Group quarters - Type of juvenile institution unknown (%)
People in Group quarters - Noninstitutionalized population (%)
People in Group quarters - College dormitories (includes college quarters off campus) (%)
People in Group quarters - Military quarters (%)
People in Group quarters - On base (%)
People in Group quarters - Barracks, unaccompanied personnel housing (UPH), (Enlisted/Officer), ;and similar group living quarters for military personnel (%)
People in Group quarters - Transient quarters for temporary residents (%)
People in Group quarters - Military ships (%)
People in Group quarters - Group homes (%)
People in Group quarters - Homes or halfway houses for drug/alcohol abuse (%)
People in Group quarters - Homes for the mentally ill (%)
People in Group quarters - Homes for the mentally retarded (%)
People in Group quarters - Homes for the physically handicapped (%)
People in Group quarters - Other group homes (%)
People in Group quarters - Religious group quarters (%)
People in Group quarters - Dormitories (%)
People in Group quarters - Agriculture workers' dormitories on farms (%)
People in Group quarters - Job Corps and vocational training facilities (%)
People in Group quarters - Other workers' dormitories (%)
People in Group quarters - Crews of maritime vessels (%)
People in Group quarters - Other nonhousehold living situations (%)
People in Group quarters - Other noninstitutional group quarters (%)
Residents speaking English at home (%)
Residents speaking English at home - Born in the United States (%)
Residents speaking English at home - Native, born elsewhere (%)
Residents speaking English at home - Foreign born (%)
Residents speaking Spanish at home (%)
Residents speaking Spanish at home - Born in the United States (%)
Residents speaking Spanish at home - Native, born elsewhere (%)
Residents speaking Spanish at home - Foreign born (%)
Residents speaking other language at home (%)
Residents speaking other language at home - Born in the United States (%)
Residents speaking other language at home - Native, born elsewhere (%)
Residents speaking other language at home - Foreign born (%)
Class of Workers - Employee of private company (%)
Class of Workers - Self-employed in own incorporated business (%)
Class of Workers - Private not-for-profit wage and salary workers (%)
Class of Workers - Local government workers (%)
Class of Workers - State government workers (%)
Class of Workers - Federal government workers (%)
Class of Workers - Self-employed workers in own not incorporated business and Unpaid family workers (%)
House heating fuel used in houses and condos - Utility gas (%)
House heating fuel used in houses and condos - Bottled, tank, or LP gas (%)
House heating fuel used in houses and condos - Electricity (%)
House heating fuel used in houses and condos - Fuel oil, kerosene, etc. (%)
House heating fuel used in houses and condos - Coal or coke (%)
House heating fuel used in houses and condos - Wood (%)
House heating fuel used in houses and condos - Solar energy (%)
House heating fuel used in houses and condos - Other fuel (%)
House heating fuel used in houses and condos - No fuel used (%)
House heating fuel used in apartments - Utility gas (%)
House heating fuel used in apartments - Bottled, tank, or LP gas (%)
House heating fuel used in apartments - Electricity (%)
House heating fuel used in apartments - Fuel oil, kerosene, etc. (%)
House heating fuel used in apartments - Coal or coke (%)
House heating fuel used in apartments - Wood (%)
House heating fuel used in apartments - Solar energy (%)
House heating fuel used in apartments - Other fuel (%)
House heating fuel used in apartments - No fuel used (%)
Armed forces status - In Armed Forces (%)
Armed forces status - Civilian (%)
Armed forces status - Civilian - Veteran (%)
Armed forces status - Civilian - Nonveteran (%)
Fatal accidents locations in years 2005-2021
Fatal accidents locations in 2005
Fatal accidents locations in 2006
Fatal accidents locations in 2007
Fatal accidents locations in 2008
Fatal accidents locations in 2009
Fatal accidents locations in 2010
Fatal accidents locations in 2011
Fatal accidents locations in 2012
Fatal accidents locations in 2013
Fatal accidents locations in 2014
Fatal accidents locations in 2015
Fatal accidents locations in 2016
Fatal accidents locations in 2017
Fatal accidents locations in 2018
Fatal accidents locations in 2019
Fatal accidents locations in 2020
Fatal accidents locations in 2021
Alcohol use - People drinking some alcohol every month (%)
Alcohol use - People not drinking at all (%)
Alcohol use - Average days/month drinking alcohol
Alcohol use - Average drinks/week
Alcohol use - Average days/year people drink much
Audiometry - Average condition of hearing (%)
Audiometry - People that can hear a whisper from across a quiet room (%)
Audiometry - People that can hear normal voice from across a quiet room (%)
Audiometry - Ears ringing, roaring, buzzing (%)
Audiometry - Had a job exposure to loud noise (%)
Audiometry - Had off-work exposure to loud noise (%)
Blood Pressure & Cholesterol - Has high blood pressure (%)
Blood Pressure & Cholesterol - Checking blood pressure at home (%)
Blood Pressure & Cholesterol - Frequently checking blood cholesterol (%)
Blood Pressure & Cholesterol - Has high cholesterol level (%)
Consumer Behavior - Money monthly spent on food at supermarket/grocery store
Consumer Behavior - Money monthly spent on food at other stores
Consumer Behavior - Money monthly spent on eating out
Consumer Behavior - Money monthly spent on carryout/delivered foods
Consumer Behavior - Income spent on food at supermarket/grocery store (%)
Consumer Behavior - Income spent on food at other stores (%)
Consumer Behavior - Income spent on eating out (%)
Consumer Behavior - Income spent on carryout/delivered foods (%)
Current Health Status - General health condition (%)
Current Health Status - Blood donors (%)
Current Health Status - Has blood ever tested for HIV virus (%)
Current Health Status - Left-handed people (%)
Dermatology - People using sunscreen (%)
Diabetes - Diabetics (%)
Diabetes - Had a blood test for high blood sugar (%)
Diabetes - People taking insulin (%)
Diet Behavior & Nutrition - Diet health (%)
Diet Behavior & Nutrition - Milk product consumption (# of products/month)
Diet Behavior & Nutrition - Meals not home prepared (#/week)
Diet Behavior & Nutrition - Meals from fast food or pizza place (#/week)
Diet Behavior & Nutrition - Ready-to-eat foods (#/month)
Diet Behavior & Nutrition - Frozen meals/pizza (#/month)
Drug Use - People that ever used marijuana or hashish (%)
Drug Use - Ever used hard drugs (%)
Drug Use - Ever used any form of cocaine (%)
Drug Use - Ever used heroin (%)
Drug Use - Ever used methamphetamine (%)
Health Insurance - People covered by health insurance (%)
Kidney Conditions-Urology - Avg. # of times urinating at night
Medical Conditions - People with asthma (%)
Medical Conditions - People with anemia (%)
Medical Conditions - People with psoriasis (%)
Medical Conditions - People with overweight (%)
Medical Conditions - Elderly people having difficulties in thinking or remembering (%)
Medical Conditions - People who ever received blood transfusion (%)
Medical Conditions - People having trouble seeing even with glass/contacts (%)
Medical Conditions - People with arthritis (%)
Medical Conditions - People with gout (%)
Medical Conditions - People with congestive heart failure (%)
Medical Conditions - People with coronary heart disease (%)
Medical Conditions - People with angina pectoris (%)
Medical Conditions - People who ever had heart attack (%)
Medical Conditions - People who ever had stroke (%)
Medical Conditions - People with emphysema (%)
Medical Conditions - People with thyroid problem (%)
Medical Conditions - People with chronic bronchitis (%)
Medical Conditions - People with any liver condition (%)
Medical Conditions - People who ever had cancer or malignancy (%)
Mental Health - People who have little interest in doing things (%)
Mental Health - People feeling down, depressed, or hopeless (%)
Mental Health - People who have trouble sleeping or sleeping too much (%)
Mental Health - People feeling tired or having little energy (%)
Mental Health - People with poor appetite or overeating (%)
Mental Health - People feeling bad about themself (%)
Mental Health - People who have trouble concentrating on things (%)
Mental Health - People moving or speaking slowly or too fast (%)
Mental Health - People having thoughts they would be better off dead (%)
Oral Health - Average years since last visit a dentist
Oral Health - People embarrassed because of mouth (%)
Oral Health - People with gum disease (%)
Oral Health - General health of teeth and gums (%)
Oral Health - Average days a week using dental floss/device
Oral Health - Average days a week using mouthwash for dental problem
Oral Health - Average number of teeth
Pesticide Use - Households using pesticides to control insects (%)
Pesticide Use - Households using pesticides to kill weeds (%)
Physical Activity - People doing vigorous-intensity work activities (%)
Physical Activity - People doing moderate-intensity work activities (%)
Physical Activity - People walking or bicycling (%)
Physical Activity - People doing vigorous-intensity recreational activities (%)
Physical Activity - People doing moderate-intensity recreational activities (%)
Physical Activity - Average hours a day doing sedentary activities
Physical Activity - Average hours a day watching TV or videos
Physical Activity - Average hours a day using computer
Physical Functioning - People having limitations keeping them from working (%)
Physical Functioning - People limited in amount of work they can do (%)
Physical Functioning - People that need special equipment to walk (%)
Physical Functioning - People experiencing confusion/memory problems (%)
Physical Functioning - People requiring special healthcare equipment (%)
Prescription Medications - Average number of prescription medicines taking
Preventive Aspirin Use - Adults 40+ taking low-dose aspirin (%)
Reproductive Health - Vaginal deliveries (%)
Reproductive Health - Cesarean deliveries (%)
Reproductive Health - Deliveries resulted in a live birth (%)
Reproductive Health - Pregnancies resulted in a delivery (%)
Reproductive Health - Women breastfeeding newborns (%)
Reproductive Health - Women that had a hysterectomy (%)
Reproductive Health - Women that had both ovaries removed (%)
Reproductive Health - Women that have ever taken birth control pills (%)
Reproductive Health - Women taking birth control pills (%)
Reproductive Health - Women that have ever used Depo-Provera or injectables (%)
Reproductive Health - Women that have ever used female hormones (%)
Sexual Behavior - People 18+ that ever had sex (vaginal, anal, or oral) (%)
Sexual Behavior - Males 18+ that ever had vaginal sex with a woman (%)
Sexual Behavior - Males 18+ that ever performed oral sex on a woman (%)
Sexual Behavior - Males 18+ that ever had anal sex with a woman (%)
Sexual Behavior - Males 18+ that ever had any sex with a man (%)
Sexual Behavior - Females 18+ that ever had vaginal sex with a man (%)
Sexual Behavior - Females 18+ that ever performed oral sex on a man (%)
Sexual Behavior - Females 18+ that ever had anal sex with a man (%)
Sexual Behavior - Females 18+ that ever had any kind of sex with a woman (%)
Sexual Behavior - Average age people first had sex
Sexual Behavior - Average number of female sex partners in lifetime (males 18+)
Sexual Behavior - Average number of female vaginal sex partners in lifetime (males 18+)
Sexual Behavior - Average age people first performed oral sex on a woman (18+)
Sexual Behavior - Average number of woman performed oral sex on in lifetime (18+)
Sexual Behavior - Average number of male sex partners in lifetime (males 18+)
Sexual Behavior - Average number of male anal sex partners in lifetime (males 18+)
Sexual Behavior - Average age people first performed oral sex on a man (18+)
Sexual Behavior - Average number of male oral sex partners in lifetime (18+)
Sexual Behavior - People using protection when performing oral sex (%)
Sexual Behavior - Average number of times people have vaginal or anal sex a year
Sexual Behavior - People having sex without condom (%)
Sexual Behavior - Average number of male sex partners in lifetime (females 18+)
Sexual Behavior - Average number of male vaginal sex partners in lifetime (females 18+)
Sexual Behavior - Average number of female sex partners in lifetime (females 18+)
Sexual Behavior - Circumcised males 18+ (%)
Sleep Disorders - Average hours sleeping at night
Sleep Disorders - People that has trouble sleeping (%)
Smoking-Cigarette Use - People smoking cigarettes (%)
Taste & Smell - People 40+ having problems with smell (%)
Taste & Smell - People 40+ having problems with taste (%)
Taste & Smell - People 40+ that ever had wisdom teeth removed (%)
Taste & Smell - People 40+ that ever had tonsils teeth removed (%)
Taste & Smell - People 40+ that ever had a loss of consciousness because of a head injury (%)
Taste & Smell - People 40+ that ever had a broken nose or other serious injury to face or skull (%)
Taste & Smell - People 40+ that ever had two or more sinus infections (%)
Weight - Average height (inches)
Weight - Average weight (pounds)
Weight - Average BMI
Weight - People that are obese (%)
Weight - People that ever were obese (%)
Weight - People trying to lose weight (%)
100%
urban population.
Estimated median house/condo value in 2022: $177,599
43623:
$177,599Ohio:
$204,100
According to our research of Ohio and other state lists, there were 21 registered sex offenders living in 43623 zip code as of June 16, 2024 . The ratio of all residents to sex offenders in zip code 43623 is 978 to 1.The ratio of registered sex offenders to all residents in this zip code is lower than the state average.
Median resident age: This zip code:
40.6 yearsOhio median age:
39.9 years
Average household size: This zip code:
2.1 peopleOhio:
2.4 people
Averages for the 2020 tax year for zip code 43623, filed in 2021:
Average Adjusted Gross Income (AGI) in 2020: $66,054 (Individual Income Tax Returns) Here:
$66,054State:
$67,288
Salary/wage: $50,457 (reported on 80.4% of returns )Here:
$50,457State:
$55,628
(% of AGI for various income ranges: 1124.3% for AGIs below $25k , 3433.5% for AGIs $25k-50k , 6261.4% for AGIs $50k-75k , 9108.7% for AGIs $75k-100k , 15593.4% for AGIs $100k-200k , 94570.0% for AGIs over 200k ) Taxable interest for individuals: $2,099 (reported on 26.6% of returns )This zip code:
$2,099Ohio:
$1,518
(% of AGI for various income ranges: 15.4% for AGIs below $25k , 14.5% for AGIs $25k-50k , 39.4% for AGIs $50k-75k , 66.7% for AGIs $75k-100k , 128.4% for AGIs $100k-200k , 4163.8% for AGIs over 200k ) Ordinary dividends: $8,644 (reported on 19.1% of returns )(% of AGI for various income ranges: 25.5% for AGIs below $25k , 31.7% for AGIs $25k-50k , 69.0% for AGIs $50k-75k , 180.9% for AGIs $75k-100k , 445.4% for AGIs $100k-200k , 13611.3% for AGIs over 200k ) Net capital gain/loss in AGI: +$18,191 (reported on 17.2% of returns )Here:
+$18,191State:
+$18,919
(% of AGI for various income ranges: 10.7% for AGIs below $25k , 18.9% for AGIs $25k-50k , 69.2% for AGIs $50k-75k , 183.6% for AGIs $75k-100k , 607.3% for AGIs $100k-200k , 32378.8% for AGIs over 200k ) Profit/loss from business: +$18,223 (reported on 12.6% of returns )Here:
+$18,223State:
+$13,744
(% of AGI for various income ranges: 70.5% for AGIs below $25k , 55.5% for AGIs $25k-50k , 176.2% for AGIs $50k-75k , 305.8% for AGIs $75k-100k , 726.6% for AGIs $100k-200k , 14952.5% for AGIs over 200k ) Taxable individual retirement arrangement distribution: $19,280 (reported on 11.1% of returns )43623:
$19,280Ohio:
$18,876
(% of AGI for various income ranges: 72.9% for AGIs below $25k , 119.0% for AGIs $25k-50k , 205.3% for AGIs $50k-75k , 405.7% for AGIs $75k-100k , 1070.0% for AGIs $100k-200k , 6777.5% for AGIs over 200k ) Self-employed (Keogh) retirement plans: $30,714 (reported on 0.7% of returns )43623:
$30,714Ohio:
$24,898
(% of AGI for various income ranges: 98.1% for AGIs $100k-200k , 1866.3% for AGIs over 200k ) Total itemized deductions: $35,600 (reported on 5.4% of returns )Here:
$35,600State:
$33,869
(% of AGI for various income ranges: 30.2% for AGIs below $25k , 78.3% for AGIs $25k-50k , 190.1% for AGIs $50k-75k , 368.7% for AGIs $75k-100k , 659.3% for AGIs $100k-200k , 10231.2% for AGIs over 200k ) Charity contributions: $16,202 (reported on 4.3% of returns )Here:
$16,202State:
$14,577
(% of AGI for various income ranges: 9.2% for AGIs $25k-50k , 32.8% for AGIs $50k-75k , 77.0% for AGIs $75k-100k , 200.6% for AGIs $100k-200k , 6026.2% for AGIs over 200k ) Taxes paid: $7,533 (reported on 5.3% of returns )(% of AGI for various income ranges: 4.7% for AGIs below $25k , 12.8% for AGIs $25k-50k , 42.4% for AGIs $50k-75k , 96.3% for AGIs $75k-100k , 192.5% for AGIs $100k-200k , 1603.8% for AGIs over 200k ) Earned income credit: $2,172 (reported on 14.1% of returns )(% of AGI for various income ranges: 75.4% for AGIs below $25k , 57.1% for AGIs $25k-50k , 1.0% for AGIs $50k-75k ) Percentage of individuals using paid preparers for their 2020 taxes: 92.8%(% for various income ranges: 91.7% for AGIs below $25k , 92.8% for AGIs $25k-50k , 94.0% for AGIs $50k-75k , 94.0% for AGIs $75k-100k , 93.9% for AGIs $100k-200k , 91.9% for AGIs over 200k )
Averages for the 2012 tax year for zip code 43623, filed in 2013:
Average Adjusted Gross Income (AGI) in 2012: $57,248 (Individual Income Tax Returns) Here:
$57,248State:
$54,926
Salary/wage: $45,379 (reported on 82.5% of returns )Here:
$45,379State:
$45,869
(% of AGI for various income ranges: 72.9% for AGIs below $25k , 74.5% for AGIs $25k-50k , 72.5% for AGIs $50k-75k , 72.7% for AGIs $75k-100k , 71.5% for AGIs $100k-200k , 45.5% for AGIs over 200k ) Taxable interest for individuals: $1,817 (reported on 33.4% of returns )This zip code:
$1,817Ohio:
$1,297
(% of AGI for various income ranges: 1.0% for AGIs below $25k , 0.6% for AGIs $25k-50k , 0.7% for AGIs $50k-75k , 0.7% for AGIs $75k-100k , 0.8% for AGIs $100k-200k , 1.9% for AGIs over 200k ) Ordinary dividends: $7,036 (reported on 22.4% of returns )(% of AGI for various income ranges: 1.8% for AGIs below $25k , 1.1% for AGIs $25k-50k , 1.2% for AGIs $50k-75k , 1.4% for AGIs $75k-100k , 1.8% for AGIs $100k-200k , 6.3% for AGIs over 200k ) Net capital gain/loss in AGI: +$9,497 (reported on 17.4% of returns )Here:
+$9,497State:
+$11,232
(% of AGI for various income ranges: 0.2% for AGIs $25k-50k , 0.6% for AGIs $50k-75k , 0.4% for AGIs $75k-100k , 1.3% for AGIs $100k-200k , 9.2% for AGIs over 200k ) Profit/loss from business: +$20,347 (reported on 12.6% of returns )Here:
+$20,347State:
+$12,773
(% of AGI for various income ranges: 5.3% for AGIs below $25k , 2.3% for AGIs $25k-50k , 2.9% for AGIs $50k-75k , 3.0% for AGIs $75k-100k , 3.8% for AGIs $100k-200k , 7.7% for AGIs over 200k ) Taxable individual retirement arrangement distribution: $16,231 (reported on 12.9% of returns )43623:
$16,231Ohio:
$14,511
(% of AGI for various income ranges: 3.9% for AGIs below $25k , 3.4% for AGIs $25k-50k , 3.6% for AGIs $50k-75k , 3.7% for AGIs $75k-100k , 4.9% for AGIs $100k-200k , 2.9% for AGIs over 200k ) Self-employment retirement plans: $24,267 (reported on 0.9% of returns )43623:
$24,267Ohio:
$20,257
(% of AGI for various income ranges: 0.6% for AGIs $75k-100k , 1.1% for AGIs over 200k ) Total itemized deductions: $21,395 (18% of AGI, reported on 32.2% of returns )Here:
$21,395State:
$21,278
Here:
18.5% of AGIState:
18.8% of AGI
(% of AGI for various income ranges: 7.1% for AGIs below $25k , 8.9% for AGIs $25k-50k , 11.8% for AGIs $50k-75k , 13.9% for AGIs $75k-100k , 15.0% for AGIs $100k-200k , 12.7% for AGIs over 200k ) Charity contributions: $4,102 (reported on 25.8% of returns )(% of AGI for various income ranges: 0.7% for AGIs below $25k , 1.0% for AGIs $25k-50k , 1.4% for AGIs $50k-75k , 1.7% for AGIs $75k-100k , 2.2% for AGIs $100k-200k , 2.7% for AGIs over 200k ) Taxes paid: $10,136 (reported on 32.2% of returns )43623:
$10,136State:
$9,568
(% of AGI for various income ranges: 1.7% for AGIs below $25k , 2.9% for AGIs $25k-50k , 4.6% for AGIs $50k-75k , 5.8% for AGIs $75k-100k , 7.7% for AGIs $100k-200k , 7.8% for AGIs over 200k ) Earned income credit: $2,116 (reported on 15.1% of returns )(% of AGI for various income ranges: 5.2% for AGIs below $25k , 0.7% for AGIs $25k-50k ) Percentage of individuals using paid preparers for their 2012 taxes: 52.6%(% for various income ranges: 45.8% for AGIs below $25k , 50.6% for AGIs $25k-50k , 57.3% for AGIs $50k-75k , 61.1% for AGIs $75k-100k , 61.4% for AGIs $100k-200k , 87.1% for AGIs over 200k )
Averages for the 2004 tax year for zip code 43623, filed in 2005:
Average Adjusted Gross Income (AGI) in 2004: $54,239 (Individual Income Tax Returns) Here:
$54,239State:
$44,480
Salary/wage: $42,707 (reported on 82.0% of returns )Here:
$42,707State:
$39,198
(% of AGI for various income ranges: 122.3% for AGIs below $10k , 67.3% for AGIs $10k-25k , 76.3% for AGIs $25k-50k , 78.8% for AGIs $50k-75k , 78.2% for AGIs $75k-100k , 49.3% for AGIs over 100k ) Taxable interest for individuals: $2,378 (reported on 49.7% of returns )This zip code:
$2,378Ohio:
$1,532
(% of AGI for various income ranges: 8.7% for AGIs below $10k , 3.3% for AGIs $10k-25k , 1.8% for AGIs $25k-50k , 1.7% for AGIs $50k-75k , 1.2% for AGIs $75k-100k , 2.4% for AGIs over 100k ) Taxable dividends: $4,576 (reported on 30.0% of returns )(% of AGI for various income ranges: 7.3% for AGIs below $10k , 2.3% for AGIs $10k-25k , 1.4% for AGIs $25k-50k , 1.6% for AGIs $50k-75k , 1.3% for AGIs $75k-100k , 3.5% for AGIs over 100k ) Net capital gain/loss: +$14,135 (reported on 23.5% of returns )Here:
+$14,135State:
+$8,582
(% of AGI for various income ranges: -2.1% for AGIs below $10k , 0.3% for AGIs $10k-25k , 0.4% for AGIs $25k-50k , 0.5% for AGIs $50k-75k , 1.0% for AGIs $75k-100k , 12.9% for AGIs over 100k ) Profit/loss from business: +$20,006 (reported on 12.2% of returns )Here:
+$20,006State:
+$10,813
(% of AGI for various income ranges: 1.7% for AGIs below $10k , 3.5% for AGIs $10k-25k , 2.4% for AGIs $25k-50k , 2.4% for AGIs $50k-75k , 3.9% for AGIs $75k-100k , 6.5% for AGIs over 100k ) IRA payment deduction: $2,857 (reported on 2.1% of returns )(% of AGI for various income ranges: 0.1% for AGIs $10k-25k , 0.2% for AGIs $25k-50k , 0.1% for AGIs $50k-75k , 0.1% for AGIs $75k-100k , 0.1% for AGIs over 100k ) Self-employed pension: $21,383 (reported on 1.3% of returns )(% of AGI for various income ranges: 0.1% for AGIs $50k-75k , 0.3% for AGIs $75k-100k , 1.0% for AGIs over 100k ) Total itemized deductions: $19,092 (19% of AGI, reported on 39.6% of returns )Here:
$19,092State:
$17,503
Here:
18.7% of AGIState:
20.8% of AGI
(% of AGI for various income ranges: 13.1% for AGIs below $10k , 9.8% for AGIs $10k-25k , 12.6% for AGIs $25k-50k , 15.6% for AGIs $50k-75k , 16.8% for AGIs $75k-100k , 13.8% for AGIs over 100k ) Charity contributions deductions: $3,345 (3% of AGI, reported on 34.4% of returns )Here:
3.0% of AGIState:
3.4% of AGI
(% of AGI for various income ranges: 1.0% for AGIs below $10k , 0.9% for AGIs $10k-25k , 1.4% for AGIs $25k-50k , 1.9% for AGIs $50k-75k , 2.0% for AGIs $75k-100k , 2.8% for AGIs over 100k ) Total tax: $9,772 (reported on 78.2% of returns )(% of AGI for various income ranges: 3.0% for AGIs below $10k , 4.3% for AGIs $10k-25k , 7.6% for AGIs $25k-50k , 9.7% for AGIs $50k-75k , 11.0% for AGIs $75k-100k , 20.9% for AGIs over 100k ) Earned income credit: $1,483 (reported on 10.3% of returns )Percentage of individuals using paid preparers for their 2004 taxes: 55.6%(% for various income ranges: 48.2% for AGIs below $10k , 53.4% for AGIs $10k-25k , 55.3% for AGIs $25k-50k , 59.2% for AGIs $50k-75k , 56.1% for AGIs $75k-100k , 72.5% for AGIs over 100k )
Estimated median household income in 2022: This zip code:
$64,735Ohio:
$65,720
Nearest zip codes: 43613 ,
43606 ,
48144 ,
43615 ,
43607 ,
43617 .
Toledo Zip Code Map
Percentage of family households: This zip code:
35.9%Ohio:
43.3%
Percentage of households with unmarried partners: This zip code:
6.7%Ohio:
44.6%
Likely homosexual households (counted as self-reported same-sex unmarried-partner households)
Lesbian couples: 0.2% of all households Gay men: 0.0% of all households
Household received Food Stamps/SNAP in the past 12 months: 760Household did not receive Food Stamps/SNAP in the past 12 months: 8,546
Women who had a birth in the past 12 months: 213 (177 now married , 37 unmarried) Women who did not have a birth in the past 12 months: 4,190 (1,373 now married , 2,818 unmarried)
Housing units in zip code 43623 with a mortgage: 3,845 (387
second mortgage , 8
home equity loan , 358
both second mortgage and home equity loan )
Houses without a mortgage: 193
Median monthly owner costs for units with a mortgage: $1,192
Median monthly owner costs for units without a mortgage: $585
Residents with income below the poverty level in 2022:
This zip code:
13.7%Whole state:
13.4%
Residents with income below 50% of the poverty level in 2022:
This zip code:
7.0%Whole state:
7.0%
Median number of rooms in houses and condos: Median number of rooms in apartments: Notable locations in this zip code not listed on our city pages
Click to draw/clear zip code borders Notable locations in zip code 43623: (A) , Camp Miakonda (B) , Medcorp Emergency Medical Services (C) , Sylvania Township Fire Department Station 3 (D) , Whiteford Greenhouse (E) . Display/hide their locations on the map
Shopping Centers: (1) , Marko Plaza Shopping Center (2) , Monroe Street Market Square Shopping Center (3) , Westmarket Plaza Shopping Center (4) , Vans Market Square Shopping Center (5) , Beverly Hills Plaza Shopping Center (6) , Franklin Park Mall Shopping Center (7) , Talmadge Road Shopping Center (8) , Westchester Mall Shopping Center (9) . Display/hide their locations on the map
Churches in zip code 43623 include: (A) , Toledo Covenant Church (B) , Saint Mathews Episcopal Church (C) , Assembly of Christians Church (D) , Chapman Memorial Church of the Nazarene (E) , Christ the King Catholic Church (F) , Toledo First Seventh Day Adventist Church (G) , Christ Presbyterian Church (H) , Kingdom Hall of Jehovahs Witnesses (I) . Display/hide their locations on the map
Lake: (A) . Display/hide its location on the map
Park in zip code 43623: (1) . Display/hide its location on the map
Year house built (houses)
0 2020 or later92 2010 to 2019709 2000 to 2009827 1990 to 19991,057 1980 to 19892,081 1970 to 19792,493 1960 to 19691,707 1950 to 1959477 1940 to 1949319 1939 or earlier
Zip code 43623 household income distribution in 2022 526 Less than $10,000374 $10,000 to $14,999291 $15,000 to $19,999339 $20,000 to $24,999622 $25,000 to $29,999322 $30,000 to $34,999336 $35,000 to $39,999553 $40,000 to $44,999312 $45,000 to $49,999603 $50,000 to $59,9991,161 $60,000 to $74,9991,359 $75,000 to $99,9991,066 $100,000 to $124,999474 $125,000 to $149,999444 $150,000 to $199,999528 $200,000 or moreEstimate of home value of owner-occupied houses/condos in 2022 in zip code 43623 100 Less than $10,00028 $10,000 to $14,99949 $15,000 to $19,99966 $50,000 to $59,999131 $60,000 to $69,99935 $70,000 to $79,999228 $80,000 to $89,999184 $90,000 to $99,999775 $100,000 to $124,999772 $125,000 to $149,999718 $150,000 to $174,999641 $175,000 to $199,999594 $200,000 to $249,999555 $250,000 to $299,999503 $300,000 to $399,999214 $400,000 to $499,999131 $500,000 to $749,99958 $750,000 to $999,99912 $1,000,000 to $1,499,99935 $1,500,000 to $1,999,999Rent paid by renters in 2022 in zip code 43623 30 Less than $1009 $100 to $14919 $150 to $19913 $200 to $24938 $250 to $29980 $300 to $34942 $350 to $39998 $400 to $449136 $450 to $499140 $500 to $549153 $550 to $599203 $600 to $649501 $650 to $69964 $700 to $749302 $750 to $799280 $800 to $899283 $900 to $999364 $1,000 to $1,24950 $1,250 to $1,499124 $1,500 to $1,99943 $3,500 or more202 No cash rent
Median gross rent in 2022: $897.
Estimated median house (or condo) value in 2022 for: White Non-Hispanic householders: $178,576Black or African American householders: $329,454American Indian or Alaska Native householders: $105,907Asian householders: $157,232Some other race householders: $105,907Two or more races householders: $143,057Hispanic or Latino householders: $222,080Estimated median house or condo value in 2022: $177,599
43623:
$177,599Ohio:
$204,100
Lower value quartile - upper value quartile: $126,287 - $259,515
Mean price in 2022: Detached houses: $131,824Here:
$131,824State:
$254,366
Townhouses or other attached units: $138,651Here:
$138,651State:
$225,733
In 2-unit structures: $69,256Here:
$69,256State:
$144,384
In 3-to-4-unit structures: $676,342Here:
$676,342State:
$203,002
In 5-or-more-unit structures: $123,968Here:
$123,968State:
$211,593
Mobile homes: $23,049Here:
$23,049State:
$62,719
Housing units in structures:
One, detached: 6,641One, attached: 417Two: 673 or 4: 2905 to 9: 40710 to 19: 81520 to 49: 68050 or more: 586Mobile homes: 47Unemployment : 4.9%
Means of transportation to work in zip code 43623 76.2% 7,893 Drove a car alone8.0% 832 Carpooled0.7% 68 Bus or trolley bus0.2% 16 Ferryboat0.3% 35 Taxi0.2% 22 Bicycle2.4% 245 Walked11.5% 1,189 Worked at homeTravel time to work (commute) in zip code 43623 309 Less than 5 minutes860 5 to 9 minutes1,622 10 to 14 minutes1,917 15 to 19 minutes2,070 20 to 24 minutes824 25 to 29 minutes753 30 to 34 minutes85 35 to 39 minutes86 40 to 44 minutes259 45 to 59 minutes130 60 to 89 minutes204 90 or more minutes
Neighborhoods in zip code 43623: Percentage of zip code residents living and working in this county: 84.8%
Household type by relationship:
Households: 19,963
Male householders: 4,165 (1,532 living alone ), Female householders: 5,161 (1,717 living alone )3,612 spouses (3,564 opposite-sex spouses ), 1,139 unmarried partners , (1,136 opposite-sex unmarried partners ), 4,713 children (4,517 natural , 112 adopted , 89 stepchildren ), 450 grandchildren , 185 brothers or sisters , 43 parents , 0 foster children , 166 other relatives , 312 non-relatives In group quarters: 115 (-1 institutionalized population )
Size of family households: 2,893 2-persons , 1,118 3-persons , 813 4-persons , 268 5-persons , 87 6-persons , 50 7-or-more-persons
Size of nonfamily households: 3,248 1-person , 761 2-persons , 85 3-persons , 18 4-persons
2,203 married couples with children. single-parent households (356 men , 775 women ).
88.9% of residents of 43623 zip code speak English at home. of residents speak Spanish at home (65% very well, 17% well, 10% not well, 8% not at all ).of residents speak other Indo-European language at home (84% very well, 7% well, 9% not well ).of residents speak Asian or Pacific Island language at home (42% very well, 27% well, 23% not well, 8% not at all ).of residents speak other language at home (66% very well, 28% well, 5% not well, 1% not at all ).
Foreign born population: 1,338 (6.7%)
(66.5%
of them are naturalized citizens )
This zip code:
6.7%Whole state:
5.0%
18% Lebanon 12% Bhutan 9% Kuwait 9% Honduras 4% Algeria 4% Saudi Arabia 3% Nepal 15% German 10% American 8% Polish 8% English 5% Irish 3% Lebanese 3% Arab
Year of entry for the foreign-born population
614 2010 or later 305 2000 to 2009 173 1990 to 1999 479 Before 1990
There are
555 Other Medical Specialists in Zip Code 43623.
Facilities with environmental interests located in this zip code:
ABC NAPA MACHINE SHOP (2430 TREMAINSVILLE RD in TOLEDO, OH)
STATE MASTER (Ohio general info) - RCRA-OHR000037549, HAZARDOUS WASTE PROGRAM Small Quantity Generators, between 100 kg and 1000 kg of hazardous waste/month (Resource Conservation and Recovery Act (tracking hazardous waste)) - notification Organizations: ALAN JAY TARSCHIS (CONTACT/OWNER)
Alternative names: ABC'S NAPA MACHINE SHOP
BILL S DRIVE-IN CLEANERS (4105 W ALEXIS RD in TOLEDO, OH)
STATE MASTER (Ohio general info) - AIR MAJOR Small Quantity Generators, between 100 kg and 1000 kg of hazardous waste/month (Resource Conservation and Recovery Act (tracking hazardous waste)) - notification Organizations: LEE YOUNG S (CONTACT/OWNER)
Alternative names: BILLS CLEANERS, BILL'S DRIVE-IN CLEANERS
ALTERNATE LEARNING CENTER (3939 WRENWOOD RD in TOLEDO, OH)
(National Center for Education Statistics) - STATE ID-085100 Organizations: WASHINGTON LOCAL SD (SCHOOL DISTRICT)
BESTWAY CLEANERS (4956 MONROE in TOLEDO, OH)
(Resource Conservation and Recovery Act (tracking hazardous waste)) Organizations: BEST STEVE (CONTACT/OWNER)
BILLS MARATHON (4810 MONROE AND HARVEST in TOLEDO, OH)
(Resource Conservation and Recovery Act (tracking hazardous waste)) Organizations: MARATHON OIL CO (CONTACT/OWNER)
BP OIL CO SITE 06930 (5020 MONROE ST in TOLEDO, OH)
(Resource Conservation and Recovery Act (tracking hazardous waste)) Organizations: BP OIL COMPANY (CONTACT/OWNER)
AUTO MIST REPAIR AND COLLISION (3354 W ALEXIAS RD in TOLEDO, OH)
Small Quantity Generators, between 100 kg and 1000 kg of hazardous waste/month (Resource Conservation and Recovery Act (tracking hazardous waste)) - notification Organizations: FUTREL DENNIS (CONTACT/OWNER)
Housing units lacking complete plumbing facilities: 0.2%
Housing units lacking complete kitchen facilities: 0.8%
74.5% Utility gas 23.0% Electricity 1.9% Bottled, tank, or LP gas
Population in 1990: 21,315.
Place of birth for U.S.-born residents:
This state: 14,819Northeast: 526Midwest: 1,492South: 1,031West: 525
63% of the 43623 zip code residents lived in the same house 5 years ago.
Out of people who lived in different houses, 75% lived in this county.
Out of people who lived in different counties, 50% lived in Ohio.
90% of the 43623 zip code residents lived in the same house 1 year ago.
Out of people who lived in different houses, 69% moved from this county.
Out of people who lived in different houses, 8% moved from different county within same state.
Out of people who lived in different houses, 14% moved from different state.
Out of people who lived in different houses, 7% moved from abroad.
Private vs. public school enrollment:
Students in private schools in grades 1 to 8 (elementary and middle school): 244
Students in private schools in grades 9 to 12 (high school): 219
Students in private undergraduate colleges: 113
Occupation by median earnings in the past 12 months ($)
120,931 Fire fighting and prevention, and other protective service workers including supervisors 95,103 Law enforcement workers including supervisors 73,365 Architecture and engineering occupations 72,054 Health diagnosing and treating practitioners and other technical occupations 68,112 Management occupations 67,009 Computer and mathematical occupations
Companies with federal contracts located in this zip code:
RAWLINGS HEATING AND AIR CONDI (4442 W ALEXIS RD in TOLEDO, OH; small business) in 20 contracts from 2002 to 2006
Contracts for Maintenance, Repair or Alteration of Real Property -- Other Non-Building Facilities, Other Housekeeping Services by NavySigned by year: 2000: $0; 2001: $0; 2002: $35,637; 2003: $34,979; 2004: $39,002; 2005: $7,849; 2006: $7,515.
Biggest contracts: with Navy for Maintenance, Repair or Alteration of Real Property -- Other Non-Building Facilities. Signed on 2004-10-30. Completion date: 2005-09-30.
with Navy for Other Housekeeping Services. Signed on 2002-01-14. Completion date: 2002-10-01.
with Navy for Maintenance, Repair or Alteration of Real Property -- Other Non-Building Facilities. Signed on 2003-10-01. Completion date: 2004-09-30.
with Navy for Other Housekeeping Services. Signed on 2002-11-08. Completion date: 2003-09-30.
PERRY, E W SERVICE CO INC (4216 W ALEXIS RD in TOLEDO, OH; small business)
$4,324 with Army for Draperies, Awnings, and Shades. Signed on 2003-09-30. Completion date: 2003-10-01.
Top industries in this zip code by the number of employees in 2005:
Accommodation and Food Services: Full-Service Restaurants (100-249 employees: 6 establishments, 50-99 employees: 8 establishments, 20-49 employees: 6 establishments, 10-19 employees: 4 establishments, 5-9 employees: 7 establishments, 1-4 employees: 10 establishments)Health Care and Social Assistance: Offices of Physicians (except Mental Health Specialists) (500-999: 1, 20-49: 10, 10-19: 10, 5-9: 17, 1-4: 16)Finance and Insurance: Direct Health and Medical Insurance Carriers (500-999: 1, 1-4: 1)Health Care and Social Assistance: General Medical and Surgical Hospitals (500-999: 1)Accommodation and Food Services: Limited-Service Restaurants (50-99: 2, 20-49: 11, 10-19: 12, 5-9: 3, 1-4: 5)Administrative and Support and Waste Management and Remediation Services: Temporary Help Services (100-249: 3, 50-99: 1, 20-49: 1, 10-19: 1, 1-4: 2)Administrative and Support and Waste Management and Remediation Services: Security Guards and Patrol Services (100-249: 2, 50-99: 1)Educational Services: Elementary and Secondary Schools (100-249: 1, 50-99: 2, 20-49: 1, 10-19: 1, 5-9: 1)
People in group quarters in 2010:
93 people in nursing facilities/skilled-nursing facilities
85 people in other noninstitutional facilities
14 people in group homes intended for adults
People in group quarters in 2000:
85 people in religious group quarters
63 people in nursing homes
31 people in other workers' dormitories
8 people in homes for the mentally retarded
Fatal accident statistics in 2014:
Fatal accident count: 1Vehicles involved in fatal accidents: 1Fatal accidents caused by drunken drivers: 1Fatalities: 1Persons involved in fatal accidents: 1Pedestrians involved in fatal accidents: 1
Fatal accident statistics in 2010:
Fatal accident count: 1Vehicles involved in fatal accidents: 2Fatal accidents caused by drunken drivers: 1Fatalities: 2Persons involved in fatal accidents: 5Pedestrians involved in fatal accidents: 0
Home Mortgage Disclosure Act Aggregated Statistics For Year 2009(Based on 2 full and 10 partial tracts) A) FHA, FSA/RHS & VA B) Conventional C) Refinancings D) Home Improvement Loans E) Loans on Dwellings For 5+ Families F) Non-occupant Loans on G) Loans On Manufactured Number Average Value Number Average Value Number Average Value Number Average Value Number Average Value Number Average Value Number Average Value
LOANS ORIGINATED 132 $106,936 103 $121,222 448 $142,486 28 $20,737 2 $709,500 24 $72,314 0 $0 APPLICATIONS APPROVED, NOT ACCEPTED 10 $109,724 7 $122,679 30 $103,220 8 $21,355 0 $0 4 $46,575 0 $0 APPLICATIONS DENIED 20 $81,038 13 $124,720 176 $144,075 48 $15,189 0 $0 14 $102,969 1 $30,270 APPLICATIONS WITHDRAWN 20 $103,334 16 $103,254 98 $115,249 8 $67,604 0 $0 3 $82,500 0 $0 FILES CLOSED FOR INCOMPLETENESS 2 $109,050 4 $205,015 41 $162,312 2 $11,610 0 $0 0 $0 0 $0
Aggregated Statistics For Year 2008(Based on 2 full and 10 partial tracts) A) FHA, FSA/RHS & VA B) Conventional C) Refinancings D) Home Improvement Loans E) Loans on Dwellings For 5+ Families F) Non-occupant Loans on G) Loans On Manufactured Number Average Value Number Average Value Number Average Value Number Average Value Number Average Value Number Average Value Number Average Value
LOANS ORIGINATED 94 $102,745 151 $127,784 255 $126,469 35 $22,753 1 $2,400,000 38 $70,311 0 $0 APPLICATIONS APPROVED, NOT ACCEPTED 10 $86,684 18 $119,282 64 $105,921 12 $23,837 0 $0 3 $104,147 1 $59,000 APPLICATIONS DENIED 14 $109,726 31 $83,542 225 $139,125 51 $45,141 0 $0 7 $75,311 7 $57,849 APPLICATIONS WITHDRAWN 14 $78,567 23 $136,908 109 $132,811 5 $18,260 0 $0 5 $104,146 0 $0 FILES CLOSED FOR INCOMPLETENESS 0 $0 3 $253,743 15 $145,749 2 $40,300 0 $0 1 $48,980 0 $0
Aggregated Statistics For Year 2007(Based on 2 full and 10 partial tracts) A) FHA, FSA/RHS & VA B) Conventional C) Refinancings D) Home Improvement Loans E) Loans on Dwellings For 5+ Families F) Non-occupant Loans on G) Loans On Manufactured Number Average Value Number Average Value Number Average Value Number Average Value Number Average Value Number Average Value Number Average Value
LOANS ORIGINATED 15 $145,081 306 $118,871 396 $94,961 85 $40,619 3 $1,227,447 55 $86,852 2 $35,580 APPLICATIONS APPROVED, NOT ACCEPTED 1 $74,880 37 $117,066 104 $104,344 17 $20,305 0 $0 14 $90,006 2 $60,990 APPLICATIONS DENIED 5 $132,124 59 $89,830 487 $118,388 84 $33,152 0 $0 25 $84,610 10 $24,450 APPLICATIONS WITHDRAWN 0 $0 34 $104,781 144 $126,697 11 $38,007 0 $0 11 $86,099 2 $63,535 FILES CLOSED FOR INCOMPLETENESS 0 $0 7 $113,266 38 $153,521 1 $63,000 0 $0 4 $103,470 0 $0
Aggregated Statistics For Year 2006(Based on 2 full and 10 partial tracts) A) FHA, FSA/RHS & VA B) Conventional C) Refinancings D) Home Improvement Loans E) Loans on Dwellings For 5+ Families F) Non-occupant Loans on G) Loans On Manufactured Number Average Value Number Average Value Number Average Value Number Average Value Number Average Value Number Average Value Number Average Value
LOANS ORIGINATED 27 $118,379 458 $121,589 501 $114,999 83 $29,577 4 $5,601,555 80 $107,621 0 $0 APPLICATIONS APPROVED, NOT ACCEPTED 0 $0 53 $111,291 126 $119,701 19 $44,436 0 $0 15 $91,031 0 $0 APPLICATIONS DENIED 5 $75,958 93 $105,479 428 $122,975 98 $50,781 0 $0 39 $102,131 6 $73,737 APPLICATIONS WITHDRAWN 4 $133,840 50 $101,004 212 $119,233 26 $63,085 0 $0 14 $87,203 0 $0 FILES CLOSED FOR INCOMPLETENESS 0 $0 4 $72,040 58 $141,463 1 $26,910 0 $0 2 $106,500 0 $0
Aggregated Statistics For Year 2005(Based on 2 full and 10 partial tracts) A) FHA, FSA/RHS & VA B) Conventional C) Refinancings D) Home Improvement Loans E) Loans on Dwellings For 5+ Families F) Non-occupant Loans on G) Loans On Manufactured Number Average Value Number Average Value Number Average Value Number Average Value Number Average Value Number Average Value Number Average Value
LOANS ORIGINATED 26 $124,196 497 $116,477 620 $120,875 66 $61,084 4 $2,231,375 61 $85,784 4 $18,135 APPLICATIONS APPROVED, NOT ACCEPTED 9 $99,183 51 $102,240 130 $116,913 15 $48,173 1 $3,775,000 14 $70,499 1 $25,000 APPLICATIONS DENIED 9 $124,044 115 $106,805 461 $136,364 90 $32,394 0 $0 15 $133,258 8 $27,650 APPLICATIONS WITHDRAWN 0 $0 56 $109,545 253 $144,819 31 $202,239 0 $0 14 $132,776 2 $105,885 FILES CLOSED FOR INCOMPLETENESS 0 $0 14 $91,889 71 $136,823 3 $86,750 0 $0 1 $68,520 0 $0
Aggregated Statistics For Year 2004(Based on 2 full and 10 partial tracts) A) FHA, FSA/RHS & VA B) Conventional C) Refinancings D) Home Improvement Loans E) Loans on Dwellings For 5+ Families F) Non-occupant Loans on G) Loans On Manufactured Number Average Value Number Average Value Number Average Value Number Average Value Number Average Value Number Average Value Number Average Value
LOANS ORIGINATED 46 $111,652 542 $127,944 669 $118,121 55 $46,474 7 $507,056 79 $96,144 2 $11,700 APPLICATIONS APPROVED, NOT ACCEPTED 10 $80,108 48 $116,889 126 $109,275 8 $17,169 0 $0 9 $150,214 1 $17,150 APPLICATIONS DENIED 20 $97,314 79 $94,341 377 $118,975 73 $31,188 0 $0 19 $98,637 13 $41,252 APPLICATIONS WITHDRAWN 2 $105,690 64 $117,131 216 $117,473 24 $67,145 0 $0 14 $92,254 2 $86,555 FILES CLOSED FOR INCOMPLETENESS 4 $85,705 11 $112,491 70 $120,016 4 $39,455 0 $0 3 $77,683 0 $0
Aggregated Statistics For Year 2003(Based on 2 full and 10 partial tracts) A) FHA, FSA/RHS & VA B) Conventional C) Refinancings D) Home Improvement Loans E) Loans on Dwellings For 5+ Families F) Non-occupant Loans on Number Average Value Number Average Value Number Average Value Number Average Value Number Average Value Number Average Value
LOANS ORIGINATED 46 $112,322 497 $120,303 1,545 $119,730 72 $23,179 1 $342,730 73 $88,725 APPLICATIONS APPROVED, NOT ACCEPTED 4 $122,298 35 $104,058 221 $114,599 13 $27,150 0 $0 9 $76,074 APPLICATIONS DENIED 7 $101,521 71 $91,281 417 $107,446 46 $23,521 0 $0 23 $65,605 APPLICATIONS WITHDRAWN 7 $77,589 56 $117,193 288 $124,257 6 $47,222 0 $0 13 $86,754 FILES CLOSED FOR INCOMPLETENESS 3 $107,893 18 $134,992 71 $120,181 2 $57,470 0 $0 1 $79,630
Aggregated Statistics For Year 2002(Based on 2 full and 10 partial tracts) A) FHA, FSA/RHS & VA B) Conventional C) Refinancings D) Home Improvement Loans E) Loans on Dwellings For 5+ Families F) Non-occupant Loans on Number Average Value Number Average Value Number Average Value Number Average Value Number Average Value Number Average Value
LOANS ORIGINATED 45 $99,991 505 $114,584 1,390 $126,064 58 $22,946 2 $600,440 93 $87,558 APPLICATIONS APPROVED, NOT ACCEPTED 3 $102,100 45 $86,334 248 $113,846 15 $15,383 0 $0 13 $72,512 APPLICATIONS DENIED 8 $89,516 55 $84,675 412 $105,564 39 $13,118 0 $0 14 $92,899 APPLICATIONS WITHDRAWN 2 $93,000 32 $106,840 208 $117,969 4 $58,710 0 $0 5 $68,314 FILES CLOSED FOR INCOMPLETENESS 2 $66,075 16 $77,898 122 $108,349 2 $26,445 0 $0 2 $70,645
Aggregated Statistics For Year 2001(Based on 2 full and 10 partial tracts) A) FHA, FSA/RHS & VA B) Conventional C) Refinancings D) Home Improvement Loans E) Loans on Dwellings For 5+ Families F) Non-occupant Loans on Number Average Value Number Average Value Number Average Value Number Average Value Number Average Value Number Average Value
LOANS ORIGINATED 73 $101,050 466 $116,885 1,273 $106,964 92 $22,517 5 $259,988 68 $65,699 APPLICATIONS APPROVED, NOT ACCEPTED 3 $82,917 61 $108,772 207 $99,947 37 $15,662 0 $0 6 $51,183 APPLICATIONS DENIED 7 $97,310 55 $70,111 399 $96,270 67 $16,459 0 $0 7 $55,897 APPLICATIONS WITHDRAWN 5 $99,910 34 $89,070 208 $89,402 8 $31,805 0 $0 10 $68,540 FILES CLOSED FOR INCOMPLETENESS 0 $0 10 $68,306 68 $95,914 1 $30,950 0 $0 2 $45,390
Aggregated Statistics For Year 2000(Based on 2 full and 10 partial tracts) A) FHA, FSA/RHS & VA B) Conventional C) Refinancings D) Home Improvement Loans E) Loans on Dwellings For 5+ Families F) Non-occupant Loans on Number Average Value Number Average Value Number Average Value Number Average Value Number Average Value Number Average Value
LOANS ORIGINATED 51 $92,921 423 $134,976 418 $87,404 105 $19,799 1 $225,000 42 $58,904 APPLICATIONS APPROVED, NOT ACCEPTED 1 $132,360 46 $103,458 131 $87,323 36 $15,666 0 $0 5 $96,918 APPLICATIONS DENIED 1 $44,000 51 $82,367 228 $89,666 73 $15,550 0 $0 7 $110,387 APPLICATIONS WITHDRAWN 2 $70,155 38 $102,482 102 $75,051 15 $42,397 0 $0 3 $44,753 FILES CLOSED FOR INCOMPLETENESS 0 $0 3 $72,713 29 $105,858 0 $0 0 $0 0 $0
Aggregated Statistics For Year 1999(Based on 2 full and 7 partial tracts) A) FHA, FSA/RHS & VA B) Conventional C) Refinancings D) Home Improvement Loans E) Loans on Dwellings For 5+ Families F) Non-occupant Loans on Number Average Value Number Average Value Number Average Value Number Average Value Number Average Value Number Average Value
LOANS ORIGINATED 34 $80,764 263 $117,185 467 $84,741 77 $10,884 2 $749,890 23 $78,177 APPLICATIONS APPROVED, NOT ACCEPTED 2 $97,565 25 $80,791 110 $84,529 32 $11,421 0 $0 2 $89,105 APPLICATIONS DENIED 0 $0 48 $103,581 185 $74,660 63 $14,058 0 $0 14 $45,035 APPLICATIONS WITHDRAWN 2 $68,200 15 $96,074 117 $70,435 14 $59,283 1 $2,369,080 5 $59,784 FILES CLOSED FOR INCOMPLETENESS 0 $0 4 $87,035 38 $82,620 2 $19,460 0 $0 1 $110,840
Private Mortgage Insurance Companies Aggregated Statistics For Year 2009(Based on 2 full and 10 partial tracts) A) Conventional B) Refinancings Number Average Value Number Average Value
LOANS ORIGINATED 14 $106,049 11 $142,911 APPLICATIONS APPROVED, NOT ACCEPTED 4 $102,855 7 $127,919 APPLICATIONS DENIED 4 $143,900 1 $170,680 APPLICATIONS WITHDRAWN 10 $74,323 3 $101,863 FILES CLOSED FOR INCOMPLETENESS 0 $0 0 $0
Aggregated Statistics For Year 2008(Based on 2 full and 10 partial tracts) A) Conventional B) Refinancings C) Non-occupant Loans on Number Average Value Number Average Value Number Average Value
LOANS ORIGINATED 64 $116,565 30 $167,223 7 $59,229 APPLICATIONS APPROVED, NOT ACCEPTED 19 $102,930 19 $151,185 1 $44,000 APPLICATIONS DENIED 8 $146,635 3 $133,933 2 $147,750 APPLICATIONS WITHDRAWN 0 $0 0 $0 0 $0 FILES CLOSED FOR INCOMPLETENESS 1 $129,250 0 $0 0 $0
Aggregated Statistics For Year 2007(Based on 2 full and 10 partial tracts) A) Conventional B) Refinancings C) Non-occupant Loans on Number Average Value Number Average Value Number Average Value
LOANS ORIGINATED 159 $112,036 51 $128,199 14 $69,451 APPLICATIONS APPROVED, NOT ACCEPTED 24 $120,998 13 $144,500 0 $0 APPLICATIONS DENIED 3 $82,333 2 $129,605 0 $0 APPLICATIONS WITHDRAWN 3 $73,063 5 $205,728 2 $84,635 FILES CLOSED FOR INCOMPLETENESS 0 $0 0 $0 0 $0
Aggregated Statistics For Year 2006(Based on 2 full and 10 partial tracts) A) Conventional B) Refinancings C) Non-occupant Loans on Number Average Value Number Average Value Number Average Value
LOANS ORIGINATED 135 $123,694 35 $139,329 13 $123,588 APPLICATIONS APPROVED, NOT ACCEPTED 16 $119,474 10 $190,573 3 $97,727 APPLICATIONS DENIED 0 $0 1 $113,000 1 $113,000 APPLICATIONS WITHDRAWN 5 $86,608 6 $179,523 0 $0 FILES CLOSED FOR INCOMPLETENESS 0 $0 0 $0 0 $0
Aggregated Statistics For Year 2005(Based on 2 full and 10 partial tracts) A) Conventional B) Refinancings C) Non-occupant Loans on Number Average Value Number Average Value Number Average Value
LOANS ORIGINATED 111 $120,931 61 $153,897 6 $92,188 APPLICATIONS APPROVED, NOT ACCEPTED 21 $127,036 22 $140,183 3 $69,613 APPLICATIONS DENIED 1 $242,570 4 $111,850 0 $0 APPLICATIONS WITHDRAWN 0 $0 4 $151,252 1 $72,000 FILES CLOSED FOR INCOMPLETENESS 0 $0 0 $0 0 $0
Aggregated Statistics For Year 2004(Based on 2 full and 10 partial tracts) A) Conventional B) Refinancings C) Non-occupant Loans on Number Average Value Number Average Value Number Average Value
LOANS ORIGINATED 129 $115,645 38 $131,337 21 $90,566 APPLICATIONS APPROVED, NOT ACCEPTED 16 $151,155 32 $142,260 1 $75,000 APPLICATIONS DENIED 1 $63,200 4 $102,330 0 $0 APPLICATIONS WITHDRAWN 5 $122,038 9 $164,506 2 $45,000 FILES CLOSED FOR INCOMPLETENESS 0 $0 0 $0 0 $0
Aggregated Statistics For Year 2003(Based on 2 full and 10 partial tracts) A) Conventional B) Refinancings C) Non-occupant Loans on Number Average Value Number Average Value Number Average Value
LOANS ORIGINATED 118 $122,160 120 $127,854 15 $90,286 APPLICATIONS APPROVED, NOT ACCEPTED 27 $124,713 45 $111,079 4 $114,905 APPLICATIONS DENIED 1 $61,000 0 $0 1 $61,000 APPLICATIONS WITHDRAWN 3 $94,740 11 $122,432 0 $0 FILES CLOSED FOR INCOMPLETENESS 0 $0 0 $0 0 $0
Aggregated Statistics For Year 2002(Based on 2 full and 10 partial tracts) A) Conventional B) Refinancings C) Non-occupant Loans on Number Average Value Number Average Value Number Average Value
LOANS ORIGINATED 138 $116,433 125 $115,922 21 $98,620 APPLICATIONS APPROVED, NOT ACCEPTED 26 $101,282 43 $117,127 3 $140,337 APPLICATIONS DENIED 3 $95,983 4 $95,845 4 $109,238 APPLICATIONS WITHDRAWN 6 $144,592 10 $120,154 2 $91,485 FILES CLOSED FOR INCOMPLETENESS 0 $0 1 $148,000 0 $0
Aggregated Statistics For Year 2001(Based on 2 full and 10 partial tracts) A) Conventional B) Refinancings C) Non-occupant Loans on Number Average Value Number Average Value Number Average Value
LOANS ORIGINATED 130 $110,100 101 $123,510 12 $61,923 APPLICATIONS APPROVED, NOT ACCEPTED 18 $113,679 22 $102,369 3 $64,220 APPLICATIONS DENIED 2 $117,000 5 $124,110 0 $0 APPLICATIONS WITHDRAWN 5 $130,190 6 $116,127 0 $0 FILES CLOSED FOR INCOMPLETENESS 0 $0 1 $168,400 0 $0
Aggregated Statistics For Year 2000(Based on 2 full and 10 partial tracts) A) Conventional B) Refinancings C) Non-occupant Loans on Number Average Value Number Average Value Number Average Value
LOANS ORIGINATED 127 $112,958 24 $113,900 3 $74,303 APPLICATIONS APPROVED, NOT ACCEPTED 8 $88,250 8 $76,158 0 $0 APPLICATIONS DENIED 0 $0 4 $65,142 0 $0 APPLICATIONS WITHDRAWN 6 $155,492 0 $0 0 $0 FILES CLOSED FOR INCOMPLETENESS 2 $97,490 0 $0 0 $0
Aggregated Statistics For Year 1999(Based on 2 full and 7 partial tracts) A) Conventional B) Refinancings C) Non-occupant Loans on Number Average Value Number Average Value Number Average Value
LOANS ORIGINATED 94 $96,840 32 $95,594 3 $76,410 APPLICATIONS APPROVED, NOT ACCEPTED 12 $88,697 8 $97,380 1 $47,530 APPLICATIONS DENIED 2 $83,065 1 $100,610 1 $57,920 APPLICATIONS WITHDRAWN 1 $82,920 2 $58,335 1 $82,920 FILES CLOSED FOR INCOMPLETENESS 0 $0 0 $0 0 $0
2002 - 2018 National Fire Incident Reporting System (NFIRS) incidents See full 2006 National Fire Incident Reporting System statistics for zip code 43623, Ohio
Most common first names in zip code 43623 among deceased individuals Name Count Lived (average)
Mary 212 80.3 years Robert 152 71.9 years John 142 74.8 years William 128 74.8 years Helen 124 81.6 years Charles 96 76.8 years Dorothy 94 77.2 years George 89 78.4 years James 88 71.2 years Richard 88 69.0 years
Most common last names in zip code 43623 among deceased individuals Last name Count Lived (average)
Smith 66 76.3 years Miller 58 76.5 years Brown 36 77.1 years Johnson 28 72.2 years Williams 21 74.8 years Taylor 21 73.1 years Jones 19 75.2 years Rogers 19 76.2 years Davis 18 76.0 years Baker 16 77.9 years
Businesses in zip code 43623
Name Count Name Count
ALDO 1 Justice 1 AT&T 2 KFC 1 Abercrombie & Fitch 1 Kincaid 1 Aeropostale 1 Kohl's 1 American Eagle Outfitters 2 La-Z-Boy 1 Ann Taylor 1 Lane Bryant 1 Applebee's 1 Lane Furniture 1 Arby's 1 LensCrafters 1 Bakers 1 Macy's 1 Banana Republic 1 MasterBrand Cabinets 4 Barnes & Noble 1 McDonald's 1 Baskin-Robbins 1 Men's Wearhouse 2 Bath & Body Works 1 Motherhood Maternity 2 Bed Bath & Beyond 1 New York & Co 1 Ben & Jerry's 1 Nike 5 Brookstone 1 Office Depot 1 Burger King 1 OfficeMax 1 Cache 1 Old Navy 1 Caribou Coffee 1 Olive Garden 1 Casual Male XL 1 Outback 1 Catherines 1 Outback Steakhouse 1 Charlotte Russe 1 Pac Sun 1 Chick-Fil-A 1 Panera Bread 1 Chico's 1 Papa John's Pizza 1 Chuck E. Cheese's 1 Payless 1 Clarks 1 Pier 1 Imports 1 Cold Stone Creamery 1 Pottery Barn 1 Coldwater Creek 1 RadioShack 1 Dairy Queen 2 Red Lobster 1 Decora Cabinetry 2 Red Robin 1 Discount Tire 1 Rite Aid 2 Eddie Bauer 1 SAS Shoes 1 Express 1 Sephora 1 FedEx 3 Shoe Carnival 1 Finish Line 1 Spencer Gifts 1 Foot Locker 1 Sprint Nextel 3 Ford 1 Starbucks 1 Forever 21 1 Steak 'n Shake 1 GNC 1 Subway 3 GameStop 3 T-Mobile 4 Gap 1 Talbots 1 Gymboree 1 Target 1 H&M 1 Tim Hortons 1 H&R Block 1 Torrid 1 Hobby Lobby 1 Toys"R"Us 1 Hollister Co. 1 U-Haul 2 Hot Topic 1 UPS 9 IHOP 1 Vans 2 J.Crew 1 Verizon Wireless 3 JCPenney 1 Victoria's Secret 1 JoS. A. Bank 1 Walgreens 1 Jones New York 3 Wet Seal 1 Journeys 1
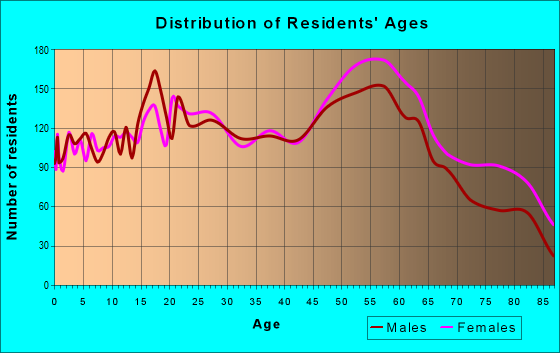
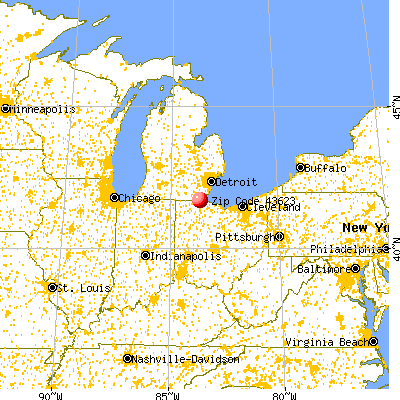


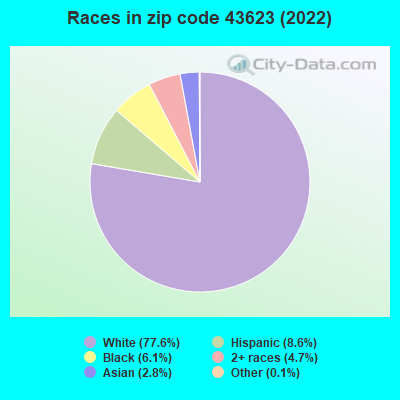


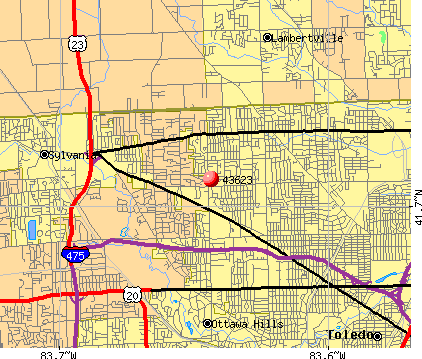 Nearest zip codes: 43613, 43606, 48144, 43615, 43607, 43617.
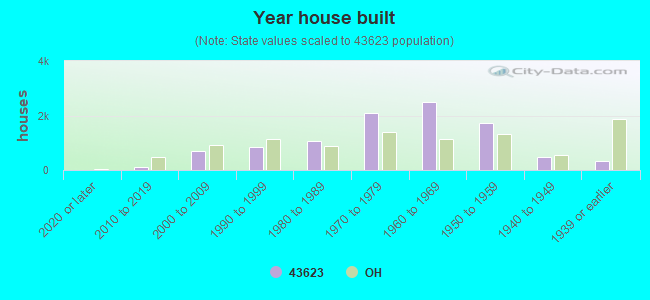
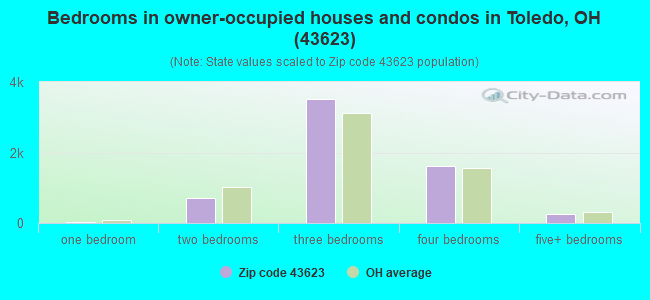
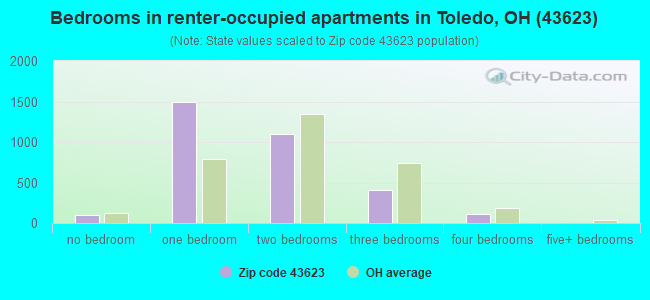

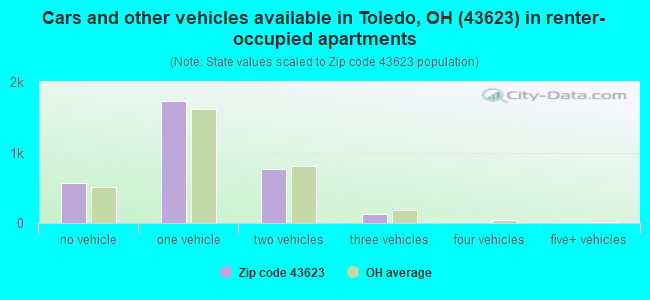


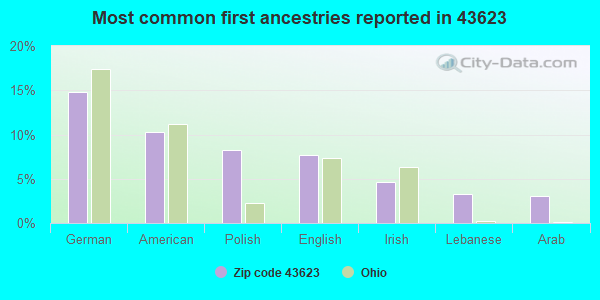
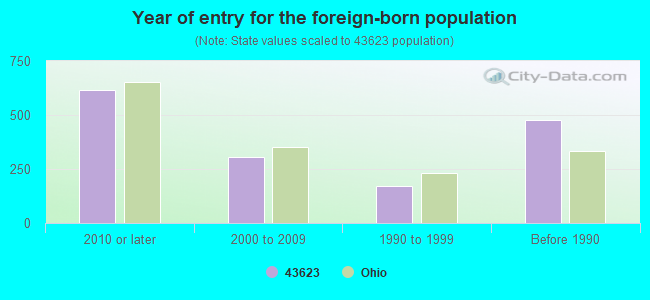

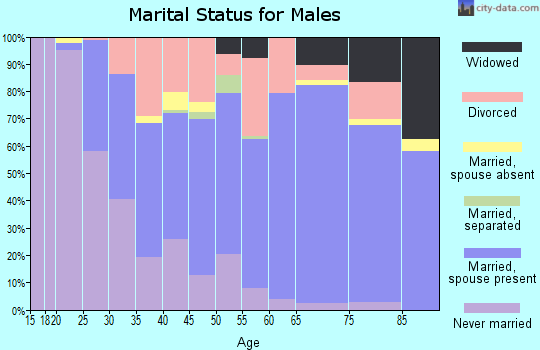

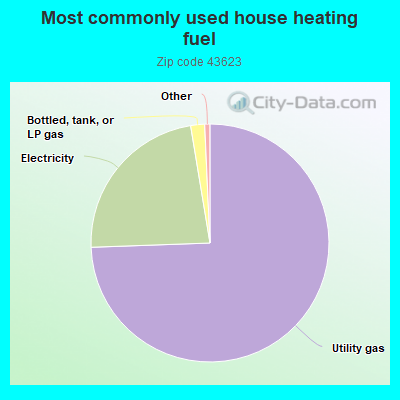
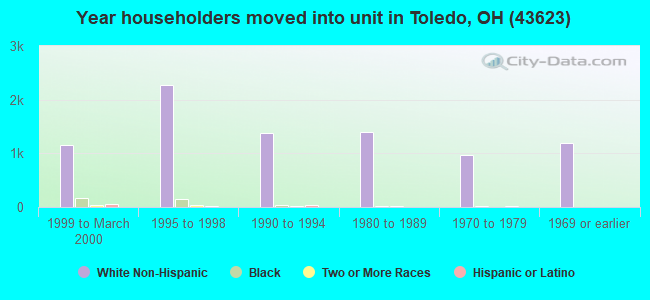
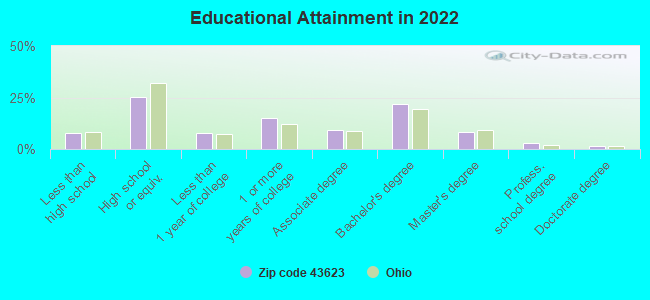
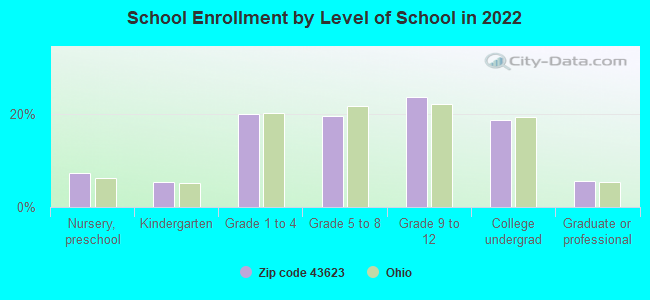


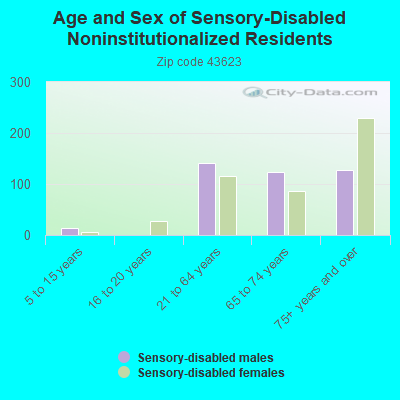
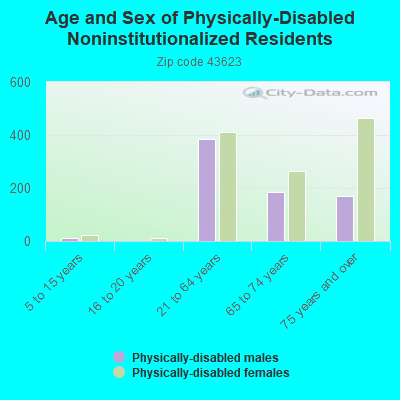
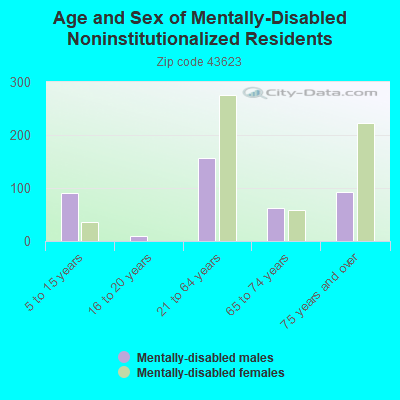
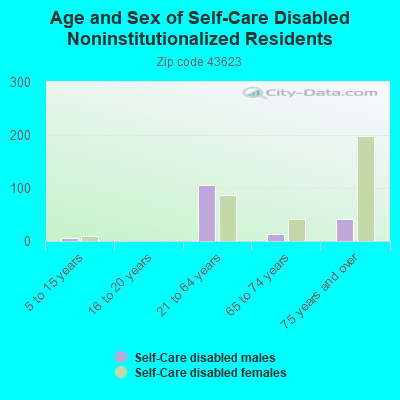
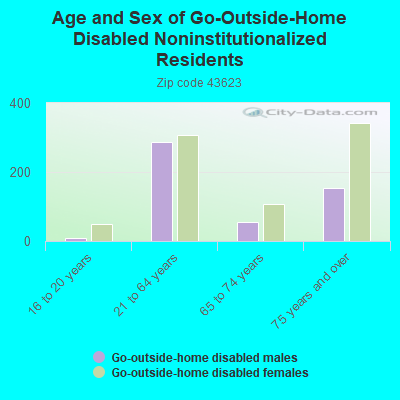
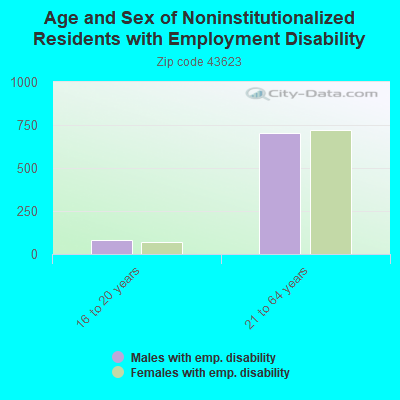
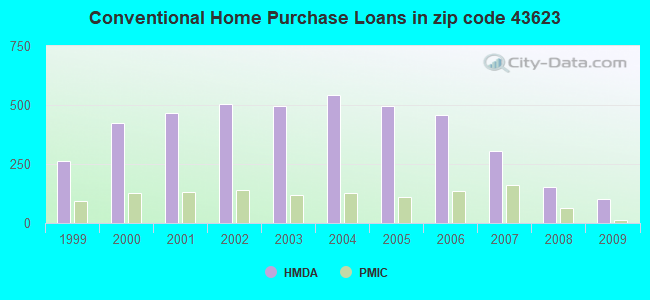
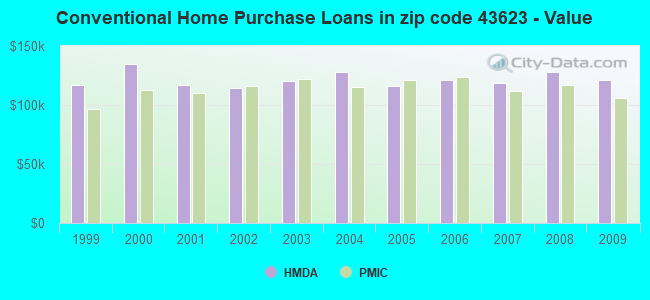
 Based on the data from the years 2002 - 2018 the average number of fires per year is 52. The highest number of fire incidents - 69 took place in 2014, and the least - 11 in 2002. The data has an increasing trend.
 When looking into fire subcategories, the most reports belonged to: Outside Fires (36.3%), and Structure Fires (33.9%).