Estimated zip code population in 2022: 4,405 Zip code population in 2010: 4,984 Zip code population in 2000: 5,356
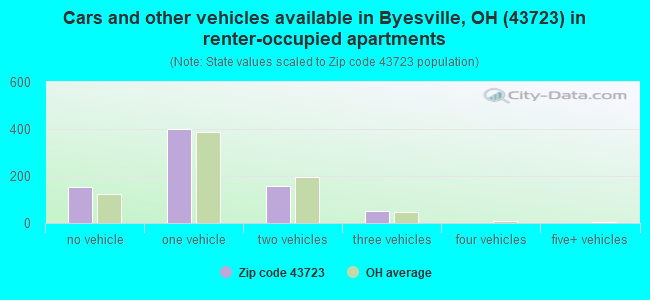
Houses and condos: 2,212 Renter-occupied apartments: 759
% of renters here:
39%
State:
33%
March 2022 cost of living index in zip code 43723: 75.9 (low, U.S. average is 100)
Land area: 17.7 sq. mi. Water area: 0.1 sq. mi.
Population density: 249 people per square mile
(very low).
OSM Map
General Map
Google Map
MSN Map
OSM Map
General Map
Google Map
MSN Map
OSM Map
General Map
Google Map
MSN Map
OSM Map
General Map
Google Map
MSN Map
Please wait while loading the map...
Real estate property taxes paid for housing units in 2022:
This zip code:
1.1% ($1,249)
Ohio:
1.3% ($2,639)
Median real estate property taxes paid for housing units with mortgages in 2022: $1,556 (1.2%) Median real estate property taxes paid for housing units with no mortgage in 2022: $981 (1.0%)
Business Search- 14 Million verified businesses
Males: 2,211
(50.2%)
Females: 2,193
(49.8%)
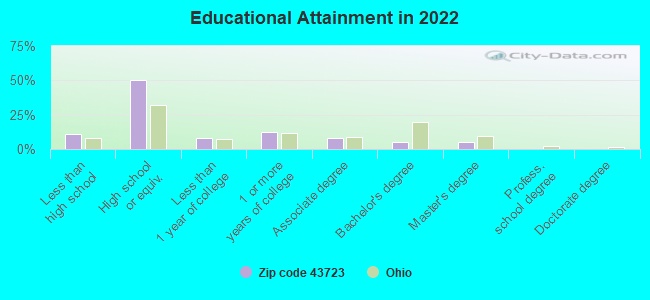
For population 25 years and over in 43723:
High school or higher: 87.8%
Bachelor's degree or higher: 10.0%
Graduate or professional degree: 5.0%
Unemployed: 5.6%
Mean travel time to work (commute): 16.6 minutes
For population 15 years and over in 43723:
Never married: 30.7%
Now married: 43.1%
Separated: 2.2%
Widowed: 8.9%
Divorced: 15.0%
Zip code 43723 compared to state average:
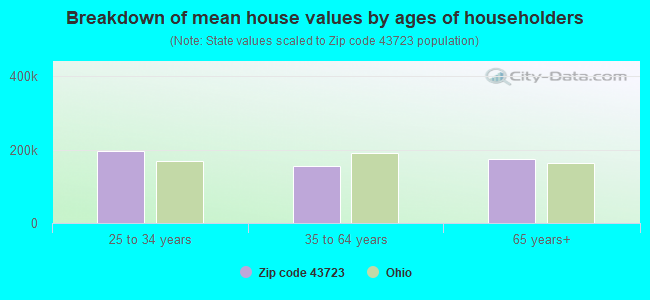
Median house value below state average.
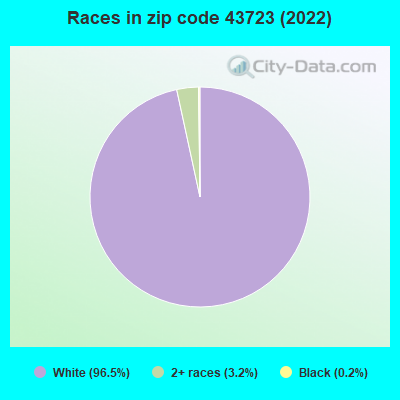
Black race population percentage significantly below state average.
Hispanic race population percentage significantly below state average.
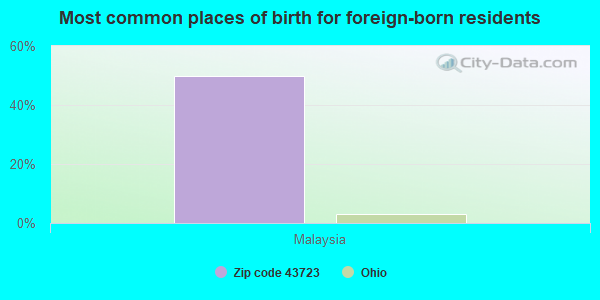
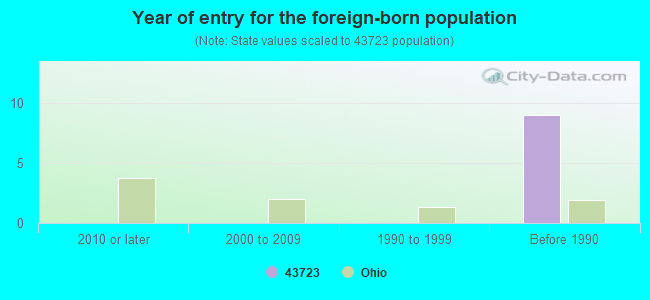
Foreign-born population percentage significantly below state average.
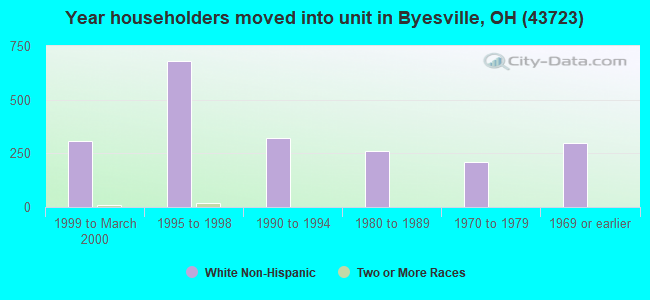
Length of stay since moving in significantly above state average.
Percentage of population with a bachelor's degree or higher significantly below state average.
Averages for the 2020 tax year for zip code 43723, filed in 2021:
Average Adjusted Gross Income (AGI) in 2020: $46,124 (Individual Income Tax Returns)
Here:
$46,124
State:
$67,288
Salary/wage: $37,853 (reported on 85.4% of returns)
Here:
$37,853
State:
$55,628
(% of AGI for various income ranges: 1154.8% for AGIs below $25k, 3496.1% for AGIs $25k-50k, 5823.7% for AGIs $50k-75k, 8270.8% for AGIs $75k-100k, 16883.6% for AGIs $100k-200k)
Taxable interest for individuals: $689 (reported on 16.8% of returns)
This zip code:
$689
Ohio:
$1,518
(% of AGI for various income ranges: 4.8% for AGIs below $25k, 3.6% for AGIs $25k-50k, 8.1% for AGIs $50k-75k, 6.9% for AGIs $75k-100k, 160.0% for AGIs $100k-200k)
Ordinary dividends: $1,860 (reported on 6.6% of returns)
Here:
$1,860
State:
$7,167
(% of AGI for various income ranges: 4.8% for AGIs below $25k, 28.5% for AGIs $50k-75k, 151.8% for AGIs $100k-200k)
Net capital gain/loss in AGI: +$5,093 (reported on 6.6% of returns)
Here:
+$5,093
State:
+$18,919
(% of AGI for various income ranges: 5.9% for AGIs $25k-50k, 30.7% for AGIs $50k-75k, 593.6% for AGIs $100k-200k)
Profit/loss from business: +$5,158 (reported on 8.4% of returns)
Here:
+$5,158
State:
+$13,744
(% of AGI for various income ranges: 43.0% for AGIs below $25k, 48.0% for AGIs $25k-50k, 106.7% for AGIs $50k-75k, 99.1% for AGIs $100k-200k)
Taxable individual retirement arrangement distribution: $12,064 (reported on 6.2% of returns)
43723:
$12,064
Ohio:
$18,876
(% of AGI for various income ranges: 41.8% for AGIs below $25k, 119.8% for AGIs $25k-50k, 548.5% for AGIs $75k-100k)
Total itemized deductions: $18,967 (reported on 1.3% of returns)
Here:
$18,967
State:
$33,869
(% of AGI for various income ranges: 210.7% for AGIs $50k-75k)
Taxes paid: $5,300 (reported on 1.3% of returns)
43723:
$5,300
State:
$7,681
(% of AGI for various income ranges: 58.9% for AGIs $50k-75k)
Earned income credit: $2,384 (reported on 22.6% of returns)
Here:
$2,384
State:
$2,304
(% of AGI for various income ranges: 106.2% for AGIs below $25k, 78.8% for AGIs $25k-50k)
Percentage of individuals using paid preparers for their 2020 taxes: 96.0%
Here:
96%
State:
94%
(% for various income ranges: 95.6% for AGIs below $25k, 95.5% for AGIs $25k-50k, 97.1% for AGIs $50k-75k, 100.0% for AGIs $75k-100k, 94.4% for AGIs $100k-200k)
Averages for the 2012 tax year for zip code 43723, filed in 2013:
Average Adjusted Gross Income (AGI) in 2012: $38,527 (Individual Income Tax Returns)
Here:
$38,527
State:
$54,926
Salary/wage: $30,556 (reported on 86.3% of returns)
Here:
$30,556
State:
$45,869
(% of AGI for various income ranges: 74.8% for AGIs below $25k, 81.5% for AGIs $25k-50k, 78.9% for AGIs $50k-75k, 82.0% for AGIs $75k-100k, 36.3% for AGIs $100k-200k)
Taxable interest for individuals: $1,021 (reported on 18.6% of returns)
This zip code:
$1,021
Ohio:
$1,297
(% of AGI for various income ranges: 0.6% for AGIs below $25k, 0.3% for AGIs $25k-50k, 0.8% for AGIs $50k-75k, 0.1% for AGIs $75k-100k, 0.6% for AGIs $100k-200k)
Ordinary dividends: $1,238 (reported on 7.1% of returns)
Here:
$1,238
State:
$5,821
(% of AGI for various income ranges: 0.2% for AGIs below $25k, 0.2% for AGIs $25k-50k, 0.5% for AGIs $50k-75k, 0.2% for AGIs $100k-200k)
Net capital gain/loss in AGI: +$2,818 (reported on 4.9% of returns)
Here:
+$2,818
State:
+$11,232
(% of AGI for various income ranges: 0.7% for AGIs $50k-75k, 0.8% for AGIs $100k-200k)
Profit/loss from business: +$8,420 (reported on 8.8% of returns)
Here:
+$8,420
State:
+$12,773
(% of AGI for various income ranges: 4.6% for AGIs below $25k, 3.1% for AGIs $25k-50k, 2.9% for AGIs $75k-100k)
Taxable individual retirement arrangement distribution: $6,371 (reported on 6.2% of returns)
43723:
$6,371
Ohio:
$14,511
(% of AGI for various income ranges: 1.4% for AGIs below $25k, 1.5% for AGIs $25k-50k, 0.7% for AGIs $50k-75k, 1.9% for AGIs $75k-100k)
Total itemized deductions: $18,148 (17% of AGI, reported on 11.9% of returns)
Here:
$18,148
State:
$21,278
Here:
17.3% of AGI
State:
18.8% of AGI
(% of AGI for various income ranges: 2.3% for AGIs below $25k, 3.6% for AGIs $25k-50k, 6.4% for AGIs $50k-75k, 8.8% for AGIs $75k-100k, 7.5% for AGIs $100k-200k)
Charity contributions: $3,005 (reported on 8.4% of returns)
Here:
$3,005
State:
$3,943
(% of AGI for various income ranges: 0.4% for AGIs $25k-50k, 0.6% for AGIs $50k-75k, 1.0% for AGIs $75k-100k, 1.2% for AGIs $100k-200k)
Taxes paid: $5,292 (reported on 11.5% of returns)
43723:
$5,292
State:
$9,568
(% of AGI for various income ranges: 0.3% for AGIs below $25k, 0.7% for AGIs $25k-50k, 1.5% for AGIs $50k-75k, 2.1% for AGIs $75k-100k, 3.0% for AGIs $100k-200k)
Earned income credit: $2,275 (reported on 25.2% of returns)
Here:
$2,275
State:
$2,285
(% of AGI for various income ranges: 7.3% for AGIs below $25k, 1.2% for AGIs $25k-50k)
Percentage of individuals using paid preparers for their 2012 taxes: 49.6%
Here:
50%
State:
51%
(% for various income ranges: 43.5% for AGIs below $25k, 51.7% for AGIs $25k-50k, 55.6% for AGIs $50k-75k, 64.3% for AGIs $75k-100k, 70.0% for AGIs $100k-200k)
Averages for the 2004 tax year for zip code 43723, filed in 2005:
Average Adjusted Gross Income (AGI) in 2004: $29,226 (Individual Income Tax Returns)
Here:
$29,226
State:
$44,480
Salary/wage: $26,558 (reported on 87.3% of returns)
Here:
$26,558
State:
$39,198
(% of AGI for various income ranges: 84.1% for AGIs below $10k, 76.4% for AGIs $10k-25k, 86.9% for AGIs $25k-50k, 87.0% for AGIs $50k-75k, 84.3% for AGIs $75k-100k, 38.7% for AGIs over 100k)
Taxable interest for individuals: $974 (reported on 27.5% of returns)
This zip code:
$974
Ohio:
$1,532
(% of AGI for various income ranges: 2.4% for AGIs below $10k, 1.2% for AGIs $10k-25k, 0.9% for AGIs $25k-50k, 0.5% for AGIs $50k-75k, 0.2% for AGIs $75k-100k, 1.4% for AGIs over 100k)
Taxable dividends: $870 (reported on 9.0% of returns)
Here:
$870
State:
$3,496
(% of AGI for various income ranges: 0.6% for AGIs below $10k, 0.4% for AGIs $10k-25k, 0.3% for AGIs $25k-50k, 0.2% for AGIs $50k-75k, 0.1% for AGIs $75k-100k, 0.1% for AGIs over 100k)
Net capital gain/loss: +$1,316 (reported on 6.1% of returns)
Here:
+$1,316
State:
+$8,582
(% of AGI for various income ranges: 0.7% for AGIs below $10k, 0.0% for AGIs $10k-25k, 0.1% for AGIs $25k-50k, 0.3% for AGIs $50k-75k, 0.1% for AGIs $75k-100k, 1.3% for AGIs over 100k)
Profit/loss from business: +$6,876 (reported on 11.2% of returns)
Here:
+$6,876
State:
+$10,813
(% of AGI for various income ranges: 6.3% for AGIs below $10k, 3.5% for AGIs $10k-25k, 1.6% for AGIs $25k-50k, 0.6% for AGIs $50k-75k, 12.1% for AGIs $75k-100k)
IRA payment deduction: $2,444 (reported on 1.2% of returns)
43723:
$2,444
Ohio:
$2,794
Total itemized deductions: $13,902 (23% of AGI, reported on 13.4% of returns)
Here:
$13,902
State:
$17,503
Here:
22.7% of AGI
State:
20.8% of AGI
(% of AGI for various income ranges: 4.2% for AGIs $10k-25k, 5.7% for AGIs $25k-50k, 7.7% for AGIs $50k-75k, 12.2% for AGIs $75k-100k, 7.0% for AGIs over 100k)
Charity contributions deductions: $2,284 (4% of AGI, reported on 9.7% of returns)
Here:
$2,284
State:
$3,087
Here:
3.9% of AGI
State:
3.4% of AGI
(% of AGI for various income ranges: 0.3% for AGIs $10k-25k, 0.6% for AGIs $25k-50k, 0.9% for AGIs $50k-75k, 2.4% for AGIs $75k-100k, 0.7% for AGIs over 100k)
Total tax: $3,115 (reported on 68.4% of returns)
43723:
$3,115
State:
$6,781
(% of AGI for various income ranges: 2.0% for AGIs below $10k, 3.8% for AGIs $10k-25k, 6.2% for AGIs $25k-50k, 8.3% for AGIs $50k-75k, 10.0% for AGIs $75k-100k, 14.6% for AGIs over 100k)
Earned income credit: $1,659 (reported on 22.5% of returns)
Here:
$1,659
State:
$1,696
Percentage of individuals using paid preparers for their 2004 taxes: 55.4%
Here:
55%
State:
55%
(% for various income ranges: 45.6% for AGIs below $10k, 57.1% for AGIs $10k-25k, 60.6% for AGIs $25k-50k, 58.7% for AGIs $50k-75k, 47.8% for AGIs $75k-100k, 61.3% for AGIs over 100k)
Household received Food Stamps/SNAP in the past 12 months: 562 Household did not receive Food Stamps/SNAP in the past 12 months: 1,388
Women who had a birth in the past 12 months: 94 (32 now married, 60 unmarried) Women who did not have a birth in the past 12 months: 792 (347 now married, 444 unmarried)
Housing units in zip code 43723 with a mortgage: 623 (51 second mortgage, 34 both second mortgage and home equity loan) Houses without a mortgage: 9
Median monthly owner costs for units with a mortgage: $1,047 Median monthly owner costs for units without a mortgage: $383
Residents with income below the poverty level in 2022:
This zip code:
17.0%
Whole state:
13.4%
Residents with income below 50% of the poverty level in 2022:
This zip code:
9.2%
Whole state:
7.0%
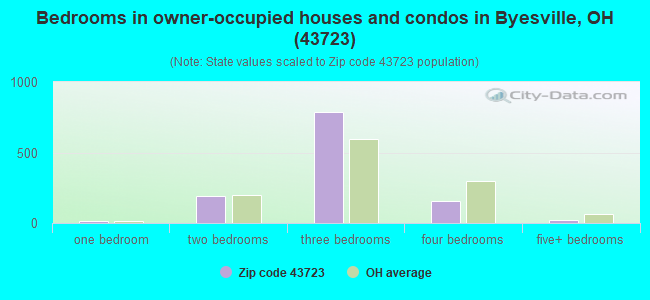
Median number of rooms in houses and condos:
Here:
6.3
State:
6.7
Median number of rooms in apartments:
Here:
4.4
State:
4.4
Notable locations in this zip code not listed on our city pages
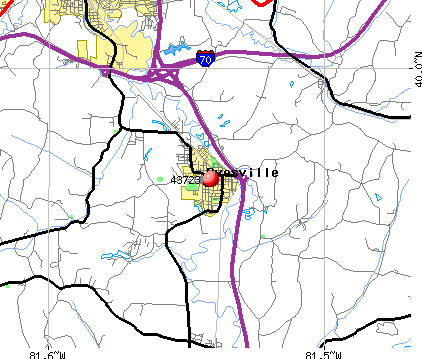
Notable locations in zip code 43723: Cambridge Country Club (A), Cambridge-Byesville Industrial Park (B), Byesville Volunteer Fire Department (C), Byesville Branch Library (D). Display/hide their locations on the map
Cemeteries: Enon Cemetery (1), Greenwood Cemetery (2), Mount Calvary Cemetery (3), Bethel Methodist Protestant Cemetery (4), Saint Michael Cemetery (5). Display/hide their locations on the map
Size of family households: 502 2-persons, 243 3-persons, 159 4-persons, 139 5-persons, 43 6-persons, 24 7-or-more-persons
Size of nonfamily households: 686 1-person, 129 2-persons, 13 4-persons
557 married couples with children.
320 single-parent households (51 men, 269 women).
99.2% of residents of 43723 zip code speak English at home.
0.3% of residents speak Spanish at home (100% very well).
Foreign born population: 4 (0.1%) (100.0% of them are naturalized citizens)
This zip code:
0.1%
Whole state:
5.0%
50%Malaysia
23%American
13%English
10%German
9%Irish
9%Polish
4%Slovak
3%Italian
Year of entry for the foreign-born population
02010 or later
02000 to 2009
01990 to 1999
9Before 1990
Facilities with environmental interests located in this zip code:
BP OIL CO (I77 AND MAIN in BYESVILLE, OH)
STATE MASTER (Ohio general info) - RCRA-OHD987016805, HAZARDOUS WASTE PROGRAM, -30-5541-168-4, EPCRA Conditionally Exempt Small Quantity Generators, less than 100 kg/month of hazardous waste (Resource Conservation and Recovery Act (tracking hazardous waste)) - notification Organizations: BP OIL COMPANY (CONTACT/OWNER)
AMES COMPANY GUERNSEY COUNTY (ROUTE 209 SOUTH, P.O. BOX 158 in BYESVILLE, OH)
National Pollutant Discharge Elimination System NON-MAJOR (Tracking pollutant discharge elimination systems) - permit Business SIC classification: UNSUPPORTED PLASTICS FILM AND SHEET
Housing units lacking complete plumbing facilities: 2.2% Housing units lacking complete kitchen facilities: 4.0%
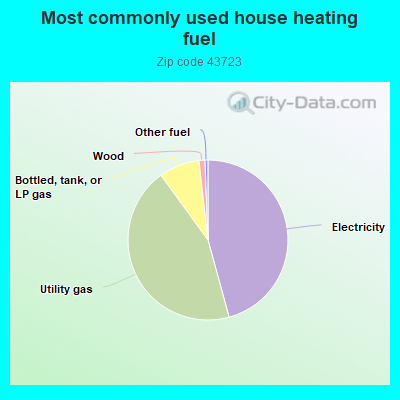
45.8%Electricity
44.3%Utility gas
8.2%Bottled, tank, or LP gas
1.2%Wood
0.6%Other fuel
Population in 1990: 5,164. Population change in the 1990s: +192 (+3.7%).
Place of birth for U.S.-born residents:
This state: 3,894
Northeast: 50
Midwest: 92
South: 315
West: 31
59% of the 43723 zip code residents lived in the same house 5 years ago. Out of people who lived in different houses, 74% lived in this county. Out of people who lived in different counties, 50% lived in Ohio.
93% of the 43723 zip code residents lived in the same house 1 year ago. Out of people who lived in different houses, 81% moved from this county. Out of people who lived in different houses, 4% moved from different county within same state. Out of people who lived in different houses, 14% moved from different state.
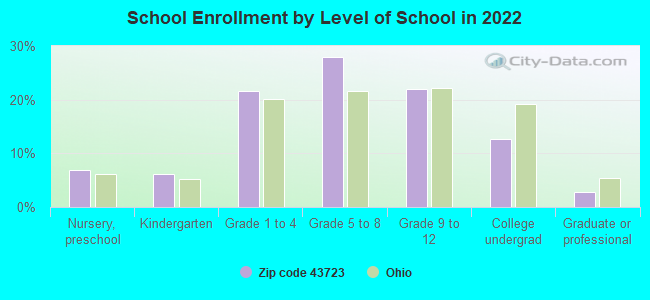
Private vs. public school enrollment:
Students in private schools in grades 1 to 8 (elementary and middle school): 34
Here:
7.5%
Ohio:
16.0%
Students in private schools in grades 9 to 12 (high school): 32
Here:
16.1%
Ohio:
13.1%
Students in private undergraduate colleges: 45
Here:
39.4%
Ohio:
22.3%
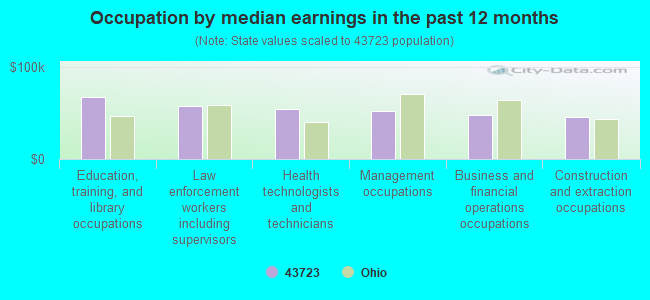
Occupation by median earnings in the past 12 months ($)
67,440Education, training, and library occupations
57,354Law enforcement workers including supervisors
54,009Health technologists and technicians
51,978Management occupations
47,959Business and financial operations occupations
46,218Construction and extraction occupations
Top industries in this zip code by the number of employees in 2005:
Health Care and Social Assistance: Services for the Elderly and Persons with Disabilities (50-99 employees: 1 establishment)
Health Care and Social Assistance: Outpatient Mental Health and Substance Abuse Centers (50-99: 1)
Mining: Support Activities for Oil and Gas Operations (20-49: 1, 5-9: 1, 1-4: 1)
Accommodation and Food Services: Limited-Service Restaurants (20-49: 1, 1-4: 2)
Fatal accident statistics in 2012:
Fatal accident count: 1
Vehicles involved in fatal accidents: 1
Fatal accidents caused by drunken drivers: 0
Fatalities: 1
Persons involved in fatal accidents: 1
Pedestrians involved in fatal accidents: 0
Fatal accident statistics in 2011:
Fatal accident count: 1
Vehicles involved in fatal accidents: 2
Fatal accidents caused by drunken drivers: 0
Fatalities: 1
Persons involved in fatal accidents: 3
Pedestrians involved in fatal accidents: 0
2002 - 2018 National Fire Incident Reporting System (NFIRS) incidents
Based on the data from the years 2002 - 2018 the average number of fire incidents per year is 32. The highest number of reported fire incidents - 53 took place in 2006, and the least - 15 in 2007. The data has a declining trend.
When looking into fire subcategories, the most reports belonged to: Structure Fires (49.5%), and Outside Fires (33.1%).
Fire incident types reported to NFIRS in Zip Code 43723

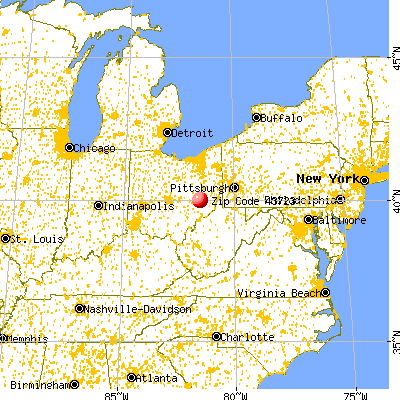


 Nearest zip codes: 43733, 43750, 43722, 43772, 43725, 43780.


 Based on the data from the years 2002 - 2018 the average number of fire incidents per year is 32. The highest number of reported fire incidents - 53 took place in 2006, and the least - 15 in 2007. The data has a declining trend.
 When looking into fire subcategories, the most reports belonged to: Structure Fires (49.5%), and Outside Fires (33.1%).