Estimated zip code population in 2022: 3,260 Zip code population in 2010: 3,764 Zip code population in 2000: 3,806
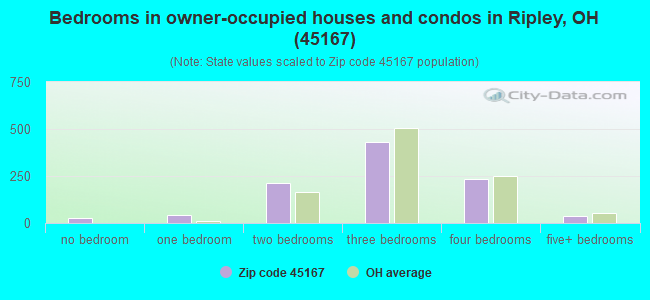
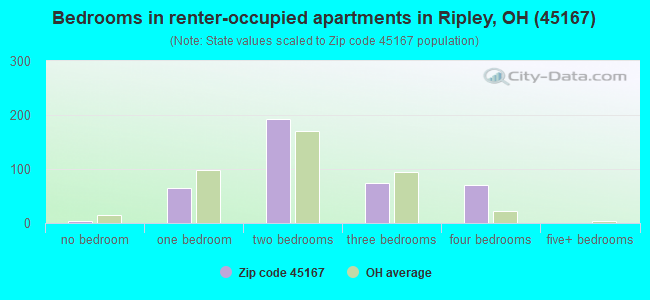
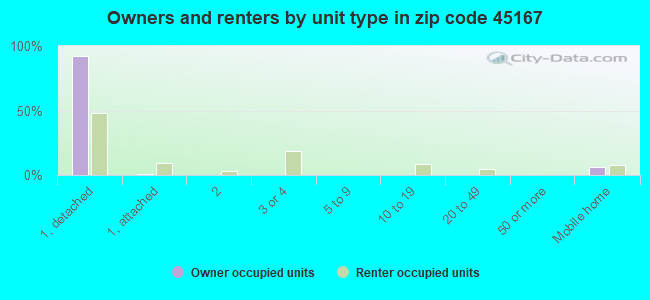
Houses and condos: 1,670 Renter-occupied apartments: 407
% of renters here:
29%
State:
33%
March 2022 cost of living index in zip code 45167: 83.9 (less than average, U.S. average is 100)
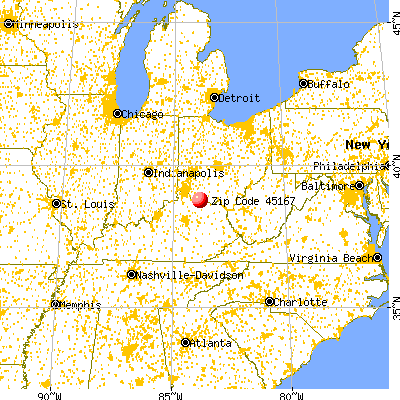
Land area: 61.3 sq. mi. Water area: 0.8 sq. mi.
Population density: 53 people per square mile
(very low).
OSM Map
General Map
Google Map
MSN Map
OSM Map
General Map
Google Map
MSN Map
OSM Map
General Map
Google Map
MSN Map
OSM Map
General Map
Google Map
MSN Map
Please wait while loading the map...
Real estate property taxes paid for housing units in 2022:
This zip code:
0.7% ($1,318)
Ohio:
1.3% ($2,639)
Median real estate property taxes paid for housing units with mortgages in 2022: $1,487 (0.8%) Median real estate property taxes paid for housing units with no mortgage in 2022: $944 (0.9%)
Business Search- 14 Million verified businesses
Males: 1,737
(53.3%)
Females: 1,523
(46.7%)
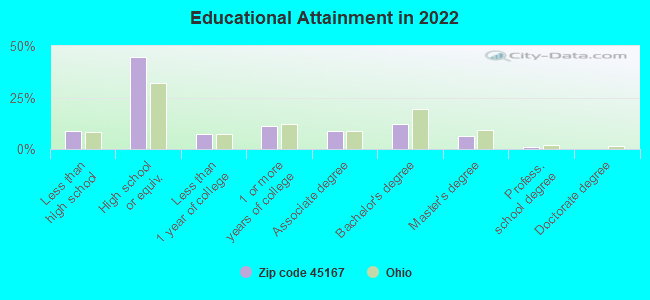
For population 25 years and over in 45167:
High school or higher: 90.2%
Bachelor's degree or higher: 19.7%
Graduate or professional degree: 7.6%
Unemployed: 4.5%
Mean travel time to work (commute): 31.9 minutes
For population 15 years and over in 45167:
Never married: 23.9%
Now married: 45.2%
Separated: 3.6%
Widowed: 11.0%
Divorced: 16.2%
Zip code 45167 compared to state average:
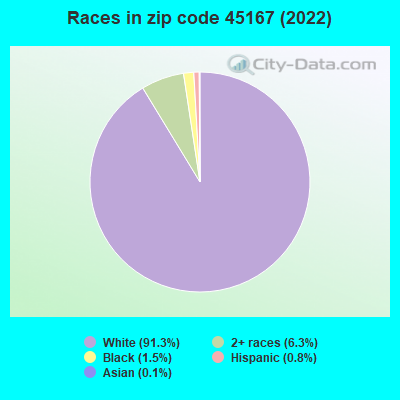
Black race population percentage significantly below state average.
Hispanic race population percentage significantly below state average.
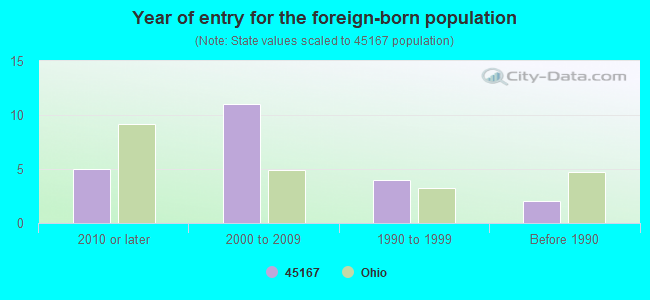
Foreign-born population percentage significantly below state average.
Length of stay since moving in significantly above state average.
Number of college students significantly below state average.
Percentage of population with a bachelor's degree or higher below state average.
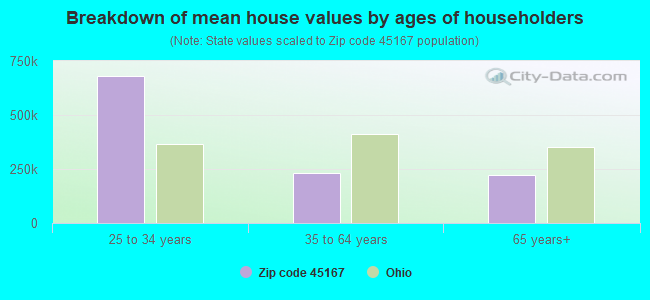
Estimated median house/condo value in 2022: $176,486
45167:
$176,486
Ohio:
$204,100
According to our research of Ohio and other state lists, there were 6 registered sex offenders living in 45167 zip code as of June 16, 2024. The ratio of all residents to sex offenders in zip code 45167 is 612 to 1. The ratio of registered sex offenders to all residents in this zip code is near the state average.
Median resident age:
This zip code:
43.6 years
Ohio median age:
39.9 years
Average household size:
This zip code:
2.2 people
Ohio:
2.4 people
Averages for the 2020 tax year for zip code 45167, filed in 2021:
Average Adjusted Gross Income (AGI) in 2020: $47,613 (Individual Income Tax Returns)
Here:
$47,613
State:
$67,288
Salary/wage: $41,495 (reported on 79.6% of returns)
Here:
$41,495
State:
$55,628
(% of AGI for various income ranges: 1130.2% for AGIs below $25k, 3445.1% for AGIs $25k-50k, 6560.0% for AGIs $50k-75k, 10532.5% for AGIs $75k-100k, 14497.8% for AGIs $100k-200k)
Taxable interest for individuals: $826 (reported on 28.6% of returns)
This zip code:
$826
Ohio:
$1,518
(% of AGI for various income ranges: 11.0% for AGIs below $25k, 32.3% for AGIs $25k-50k, 33.1% for AGIs $50k-75k, 47.5% for AGIs $75k-100k, 110.0% for AGIs $100k-200k)
Ordinary dividends: $3,890 (reported on 13.6% of returns)
Here:
$3,890
State:
$7,167
(% of AGI for various income ranges: 13.8% for AGIs below $25k, 44.9% for AGIs $25k-50k, 38.1% for AGIs $50k-75k, 65.0% for AGIs $75k-100k, 503.3% for AGIs $100k-200k)
Net capital gain/loss in AGI: +$4,850 (reported on 13.6% of returns)
Here:
+$4,850
State:
+$18,919
(% of AGI for various income ranges: 7.8% for AGIs below $25k, 40.0% for AGIs $25k-50k, 116.9% for AGIs $50k-75k, 116.3% for AGIs $75k-100k, 576.7% for AGIs $100k-200k)
Profit/loss from business: +$8,068 (reported on 12.9% of returns)
Here:
+$8,068
State:
+$13,744
(% of AGI for various income ranges: 158.5% for AGIs below $25k, 94.6% for AGIs $25k-50k, 125.0% for AGIs $50k-75k, 460.0% for AGIs $75k-100k)
Taxable individual retirement arrangement distribution: $12,985 (reported on 8.8% of returns)
45167:
$12,985
Ohio:
$18,876
(% of AGI for various income ranges: 39.5% for AGIs below $25k, 97.7% for AGIs $25k-50k, 361.2% for AGIs $50k-75k, 677.8% for AGIs $100k-200k)
Total itemized deductions: $29,300 (reported on 1.4% of returns)
Here:
$29,300
State:
$33,869
(% of AGI for various income ranges: 366.2% for AGIs $50k-75k)
Taxes paid: $3,800 (reported on 2.0% of returns)
45167:
$3,800
State:
$7,681
(% of AGI for various income ranges: 71.2% for AGIs $50k-75k)
Earned income credit: $2,457 (reported on 20.4% of returns)
Here:
$2,457
State:
$2,304
(% of AGI for various income ranges: 130.8% for AGIs below $25k, 61.1% for AGIs $25k-50k)
Percentage of individuals using paid preparers for their 2020 taxes: 95.9%
Here:
96%
State:
94%
(% for various income ranges: 94.5% for AGIs below $25k, 95.2% for AGIs $25k-50k, 95.7% for AGIs $50k-75k, 100.0% for AGIs $75k-100k, 100.0% for AGIs $100k-200k)
Averages for the 2012 tax year for zip code 45167, filed in 2013:
Average Adjusted Gross Income (AGI) in 2012: $39,904 (Individual Income Tax Returns)
Here:
$39,904
State:
$54,926
Salary/wage: $35,756 (reported on 80.1% of returns)
Here:
$35,756
State:
$45,869
(% of AGI for various income ranges: 70.1% for AGIs below $25k, 78.8% for AGIs $25k-50k, 74.2% for AGIs $50k-75k, 73.5% for AGIs $75k-100k, 61.8% for AGIs $100k-200k)
Taxable interest for individuals: $1,027 (reported on 31.8% of returns)
This zip code:
$1,027
Ohio:
$1,297
(% of AGI for various income ranges: 1.6% for AGIs below $25k, 0.5% for AGIs $25k-50k, 0.9% for AGIs $50k-75k, 0.7% for AGIs $75k-100k, 0.6% for AGIs $100k-200k)
Ordinary dividends: $4,162 (reported on 13.9% of returns)
Here:
$4,162
State:
$5,821
(% of AGI for various income ranges: 1.3% for AGIs below $25k, 0.5% for AGIs $25k-50k, 1.2% for AGIs $50k-75k, 0.8% for AGIs $75k-100k, 3.3% for AGIs $100k-200k)
Net capital gain/loss in AGI: +$3,413 (reported on 15.2% of returns)
Here:
+$3,413
State:
+$11,232
(% of AGI for various income ranges: 0.3% for AGIs below $25k, 0.4% for AGIs $25k-50k, 1.9% for AGIs $50k-75k, 1.8% for AGIs $75k-100k, 2.0% for AGIs $100k-200k)
Profit/loss from business: +$8,504 (reported on 15.2% of returns)
Here:
+$8,504
State:
+$12,773
(% of AGI for various income ranges: 9.7% for AGIs below $25k, 2.2% for AGIs $25k-50k, 1.7% for AGIs $50k-75k, 6.2% for AGIs $75k-100k)
Taxable individual retirement arrangement distribution: $11,329 (reported on 11.3% of returns)
45167:
$11,329
Ohio:
$14,511
(% of AGI for various income ranges: 4.2% for AGIs below $25k, 3.0% for AGIs $25k-50k, 2.4% for AGIs $50k-75k, 8.3% for AGIs $75k-100k)
Total itemized deductions: $17,758 (22% of AGI, reported on 17.2% of returns)
Here:
$17,758
State:
$21,278
Here:
22.3% of AGI
State:
18.8% of AGI
(% of AGI for various income ranges: 4.8% for AGIs below $25k, 4.5% for AGIs $25k-50k, 7.4% for AGIs $50k-75k, 10.1% for AGIs $75k-100k, 11.2% for AGIs $100k-200k)
Charity contributions: $2,800 (reported on 10.6% of returns)
Here:
$2,800
State:
$3,943
(% of AGI for various income ranges: 0.4% for AGIs $25k-50k, 0.6% for AGIs $50k-75k, 1.1% for AGIs $75k-100k, 1.5% for AGIs $100k-200k)
Taxes paid: $5,050 (reported on 17.2% of returns)
45167:
$5,050
State:
$9,568
(% of AGI for various income ranges: 0.6% for AGIs below $25k, 0.8% for AGIs $25k-50k, 1.9% for AGIs $50k-75k, 2.3% for AGIs $75k-100k, 4.7% for AGIs $100k-200k)
Earned income credit: $2,203 (reported on 23.8% of returns)
Here:
$2,203
State:
$2,285
(% of AGI for various income ranges: 7.7% for AGIs below $25k, 1.2% for AGIs $25k-50k)
Percentage of individuals using paid preparers for their 2012 taxes: 66.9%
Here:
67%
State:
51%
(% for various income ranges: 60.6% for AGIs below $25k, 68.3% for AGIs $25k-50k, 77.3% for AGIs $50k-75k, 75.0% for AGIs $75k-100k, 70.0% for AGIs $100k-200k)
Averages for the 2004 tax year for zip code 45167, filed in 2005:
Average Adjusted Gross Income (AGI) in 2004: $32,483 (Individual Income Tax Returns)
Here:
$32,483
State:
$44,480
Salary/wage: $29,511 (reported on 84.2% of returns)
Here:
$29,511
State:
$39,198
(% of AGI for various income ranges: 87.6% for AGIs below $10k, 77.5% for AGIs $10k-25k, 85.7% for AGIs $25k-50k, 80.4% for AGIs $50k-75k, 82.2% for AGIs $75k-100k, 42.2% for AGIs over 100k)
Taxable interest for individuals: $1,570 (reported on 40.9% of returns)
This zip code:
$1,570
Ohio:
$1,532
(% of AGI for various income ranges: 7.7% for AGIs below $10k, 3.3% for AGIs $10k-25k, 1.4% for AGIs $25k-50k, 1.4% for AGIs $50k-75k, 1.1% for AGIs $75k-100k, 2.4% for AGIs over 100k)
Taxable dividends: $1,762 (reported on 15.7% of returns)
Here:
$1,762
State:
$3,496
(% of AGI for various income ranges: 2.3% for AGIs below $10k, 0.8% for AGIs $10k-25k, 0.5% for AGIs $25k-50k, 0.6% for AGIs $50k-75k, 0.4% for AGIs $75k-100k, 2.3% for AGIs over 100k)
Net capital gain/loss: +$8,264 (reported on 12.1% of returns)
Here:
+$8,264
State:
+$8,582
(% of AGI for various income ranges: 2.3% for AGIs below $10k, 1.0% for AGIs $10k-25k, 1.2% for AGIs $25k-50k, 2.4% for AGIs $50k-75k, 1.3% for AGIs $75k-100k, 12.2% for AGIs over 100k)
Profit/loss from business: +$4,785 (reported on 13.2% of returns)
Here:
+$4,785
State:
+$10,813
(% of AGI for various income ranges: -10.7% for AGIs below $10k, 4.2% for AGIs $10k-25k, 1.8% for AGIs $25k-50k, 2.3% for AGIs $50k-75k, 4.1% for AGIs $75k-100k)
IRA payment deduction: $2,783 (reported on 1.4% of returns)
45167:
$2,783
Ohio:
$2,794
Total itemized deductions: $13,649 (24% of AGI, reported on 17.6% of returns)
Here:
$13,649
State:
$17,503
Here:
23.7% of AGI
State:
20.8% of AGI
(% of AGI for various income ranges: 6.5% for AGIs $10k-25k, 6.4% for AGIs $25k-50k, 8.5% for AGIs $50k-75k, 9.8% for AGIs $75k-100k, 8.1% for AGIs over 100k)
Charity contributions deductions: $2,771 (4% of AGI, reported on 10.0% of returns)
Here:
$2,771
State:
$3,087
Here:
4.1% of AGI
State:
3.4% of AGI
(% of AGI for various income ranges: 0.3% for AGIs $10k-25k, 0.5% for AGIs $25k-50k, 0.8% for AGIs $50k-75k, 1.1% for AGIs $75k-100k, 2.4% for AGIs over 100k)
Total tax: $3,821 (reported on 72.6% of returns)
45167:
$3,821
State:
$6,781
(% of AGI for various income ranges: 3.3% for AGIs below $10k, 4.1% for AGIs $10k-25k, 6.7% for AGIs $25k-50k, 9.0% for AGIs $50k-75k, 11.0% for AGIs $75k-100k, 15.4% for AGIs over 100k)
Earned income credit: $1,676 (reported on 19.6% of returns)
Here:
$1,676
State:
$1,696
Percentage of individuals using paid preparers for their 2004 taxes: 71.5%
Here:
72%
State:
55%
(% for various income ranges: 59.3% for AGIs below $10k, 73.5% for AGIs $10k-25k, 75.6% for AGIs $25k-50k, 77.0% for AGIs $50k-75k, 75.9% for AGIs $75k-100k, 78.6% for AGIs over 100k)
Likely homosexual households (counted as self-reported same-sex unmarried-partner households)
Lesbian couples: 0.0% of all households
Gay men: 0.2% of all households
Household received Food Stamps/SNAP in the past 12 months: 195 Household did not receive Food Stamps/SNAP in the past 12 months: 1,193
Women who had a birth in the past 12 months: 29 (9 now married, 19 unmarried) Women who did not have a birth in the past 12 months: 643 (306 now married, 336 unmarried)
Housing units in zip code 45167 with a mortgage: 520 (54 second mortgage, 2 home equity loan, 23 both second mortgage and home equity loan) Houses without a mortgage: 39
Median monthly owner costs for units with a mortgage: $1,199 Median monthly owner costs for units without a mortgage: $409
Residents with income below the poverty level in 2022:
This zip code:
15.9%
Whole state:
13.4%
Residents with income below 50% of the poverty level in 2022:
This zip code:
10.7%
Whole state:
7.0%
Median number of rooms in houses and condos:
Here:
6.2
State:
6.7
Median number of rooms in apartments:
Here:
4.7
State:
4.4
Notable locations in this zip code not listed on our city pages
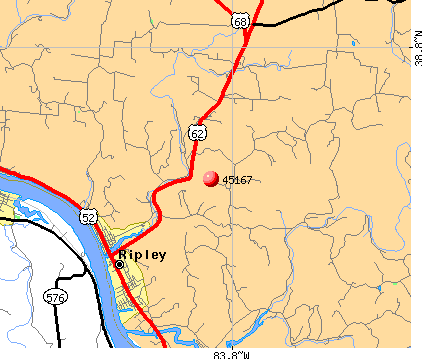
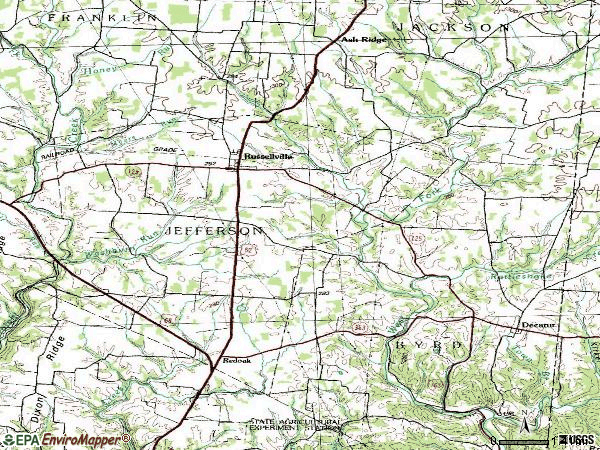
Notable locations in zip code 45167: Hamilton Landing (A), Bowers Landing (B), Stevensons Landing (C), Ripley Life Squad (D), Ripley Fire Department (E), John Rankin Home (F), Union Township Public Library (G), Ripley Museum (H), Ohio Tobacco Museum (I), Carolyns Mini Room Museum (J). Display/hide their locations on the map
Churches in zip code 45167 include: Pisgah Chapel (A), Centenary Methodist Church (B), Church of Christ (C), Church of the Nazarene (D), First Baptist Church (E), Ripley First Presbyterian Church (F), Saint Michaels Catholic Church (G), First Southern Baptist Church (H), Red Oak Presbyterian Church (I). Display/hide their locations on the map
Cemeteries: Maplewood Cemetery (1), Fitchs Chapel Cemetery (2), Hiett Chapel Cemetery (3), Howard Ridge Cemetery (4), Woods Cemetery (5), Old Redoak Cemetery (6), Martin Cemetery (7). Display/hide their locations on the map
Streams, rivers, and creeks: Myers Run (A), Indian Lick (B), Evans Run (C), Brady Run (D), Beetle Creek (E), Straight Creek (F), Rangle Run (G), Eagle Creek (H), Cornick Run (I). Display/hide their locations on the map
381 married couples with children.
249 single-parent households (94 men, 155 women).
98.3% of residents of 45167 zip code speak English at home.
0.1% of residents speak Spanish at home (25% very well, 75% not well).
1.5% of residents speak other Indo-European language at home (100% very well).
0.1% of residents speak Asian or Pacific Island language at home (100% very well).
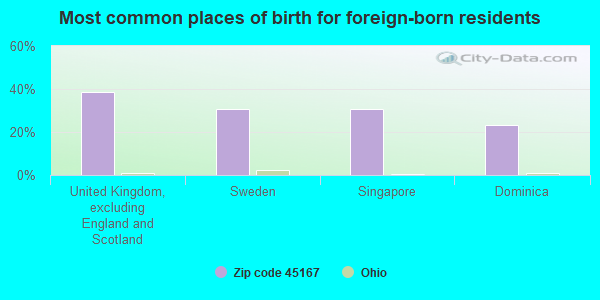
Foreign born population: 13 (0.4%) (23.4% of them are naturalized citizens)
This zip code:
0.4%
Whole state:
5.0%
38%United Kingdom, excluding England and Scotland
31%Sweden
31%Singapore
23%Dominica
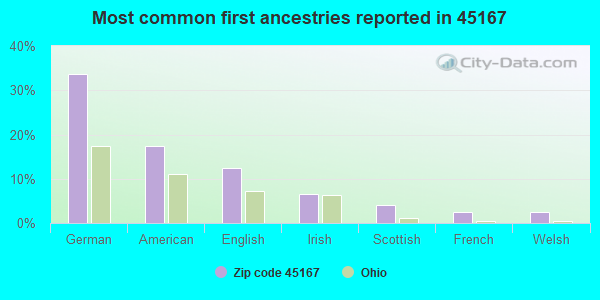
34%German
17%American
13%English
7%Irish
4%Scottish
2%French
2%Welsh
Year of entry for the foreign-born population
52010 or later
112000 to 2009
41990 to 1999
2Before 1990
Facilities with environmental interests located in this zip code:
AMERITECH (WINCHESTER SARDINIA ROAD in RIPLEY, OH)
STATE MASTER (Ohio general info) - EPCRA (Resource Conservation and Recovery Act (tracking hazardous waste)) Organizations: OHIO BELL TELEPHONE COMPANY (CONTACT/OWNER)
Alternative names: OHIO BELL TEL CO MACON RPTR STA
ASHLAND BRANDED MARKETING (104 WATERWORKS RD in RIPLEY, OH)
STATE MASTER (Ohio general info) - AIR MAJOR (Resource Conservation and Recovery Act (tracking hazardous waste)) Organizations: ASHLAND BRANDED MARKETING INC (CONTACT/OWNER)
Alternative names: ASHLAND BRANDED MKT 579 098
ASHLAND SERV STATION NO 578 098 (1001 S & SECOND ST in RIPLEY, OH)
STATE MASTER (Ohio general info) - RCRA-OHD987046133, HAZARDOUS WASTE PROGRAM Small Quantity Generators, between 100 kg and 1000 kg of hazardous waste/month (Resource Conservation and Recovery Act (tracking hazardous waste)) - notification Business SIC classification: GASOLINE SERVICE STATIONS Organizations: ASHLAND BRANDED MARKETING INC (CONTACT/OWNER)
, ASHLAND BRANDED MKTG (CONTACT/OWNER)
ASHLAND BRANDED MARKETING, 508 (28 NORTH SECOND STREET in RIPLEY, OH)
(Resource Conservation and Recovery Act (tracking hazardous waste))
Housing units lacking complete plumbing facilities: 8.0% Housing units lacking complete kitchen facilities: 9.3%
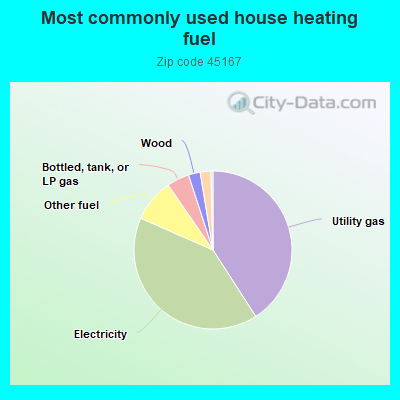
40.9%Utility gas
40.7%Electricity
8.8%Other fuel
4.6%Bottled, tank, or LP gas
2.4%Wood
2.2%Fuel oil, kerosene, etc.
Population in 1990: 3,742. Population change in the 1990s: +64 (+1.7%).
Place of birth for U.S.-born residents:
This state: 2,226
Northeast: 41
Midwest: 66
South: 838
West: 40
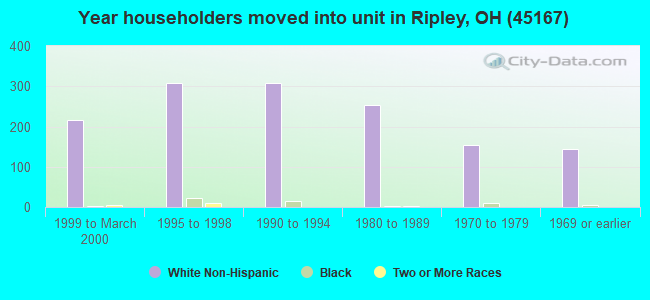
62% of the 45167 zip code residents lived in the same house 5 years ago. Out of people who lived in different houses, 56% lived in this county. Out of people who lived in different counties, 50% lived in Ohio.
88% of the 45167 zip code residents lived in the same house 1 year ago. Out of people who lived in different houses, 54% moved from this county. Out of people who lived in different houses, 34% moved from different county within same state. Out of people who lived in different houses, 10% moved from different state.
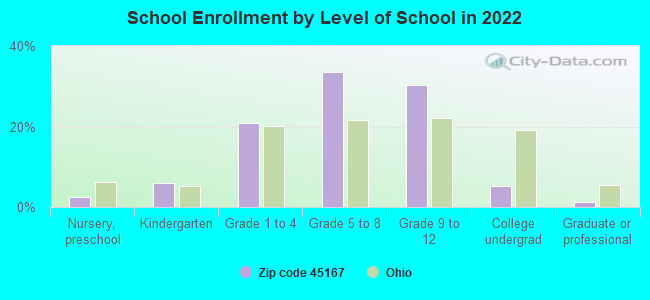
Private vs. public school enrollment:
Students in private schools in grades 1 to 8 (elementary and middle school): 44
Here:
13.0%
Ohio:
16.0%
Students in private schools in grades 9 to 12 (high school): 24
Here:
12.6%
Ohio:
13.1%
Students in private undergraduate colleges: 1
Here:
5.4%
Ohio:
22.3%
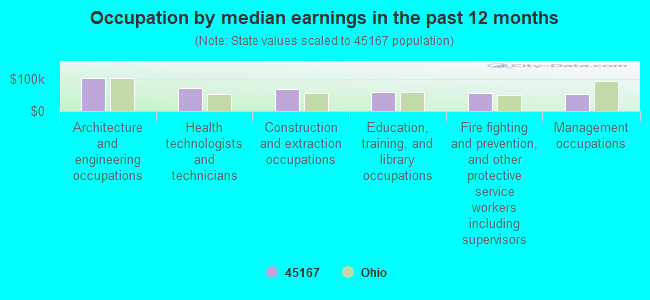
Occupation by median earnings in the past 12 months ($)
105,421Architecture and engineering occupations
72,510Health technologists and technicians
71,033Construction and extraction occupations
61,631Education, training, and library occupations
57,292Fire fighting and prevention, and other protective service workers including supervisors
53,675Management occupations
Top industries in this zip code by the number of employees in 2005:
Health Care and Social Assistance: Nursing Care Facilities (100-249 employees: 1 establishment)
Wholesale Trade: Other Grocery and Related Products Merchant Wholesalers (50-99: 1)
Other Services (except Public Administration): Religious Organizations (20-49: 1, 1-4: 2)
Utilities: Water Supply and Irrigation Systems (20-49: 1, 1-4: 1)
Finance and Insurance: Commercial Banking (10-19: 1, 5-9: 1)
Health Care and Social Assistance: All Other Outpatient Care Centers (10-19: 1, 5-9: 1)
Accommodation and Food Services: Full-Service Restaurants (5-9: 2, 1-4: 1)
People in group quarters in 2010:
152 people in nursing facilities/skilled-nursing facilities
People in group quarters in 2000:
125 people in nursing homes
Fatal accident statistics in 2013:
Fatal accident count: 1
Vehicles involved in fatal accidents: 1
Fatal accidents caused by drunken drivers: 1
Fatalities: 1
Persons involved in fatal accidents: 1
Pedestrians involved in fatal accidents: 0
Fatal accident statistics in 2010:
Fatal accident count: 1
Vehicles involved in fatal accidents: 1
Fatal accidents caused by drunken drivers: 0
Fatalities: 1
Persons involved in fatal accidents: 1
Pedestrians involved in fatal accidents: 0
Home Mortgage Disclosure Act Aggregated Statistics For Year 2009 (Based on 2 full and 2 partial tracts)
A) FHA, FSA/RHS & VA Home Purchase Loans
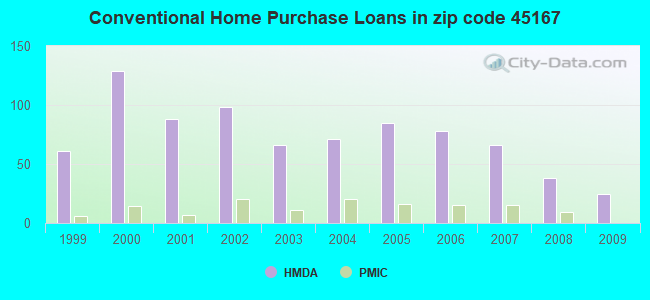
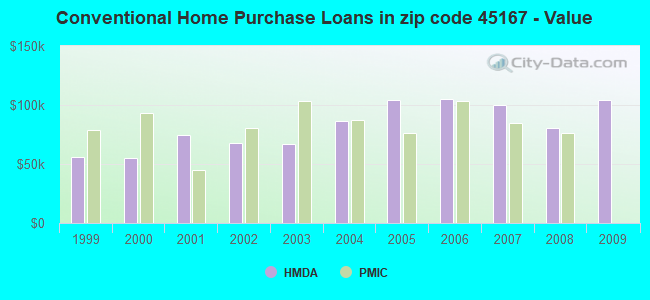
B) Conventional Home Purchase Loans
C) Refinancings
D) Home Improvement Loans
F) Non-occupant Loans on < 5 Family Dwellings (A B C & D)
G) Loans On Manufactured Home Dwelling (A B C & D)
Number
Average Value
Number
Average Value
Number
Average Value
Number
Average Value
Number
Average Value
Number
Average Value
LOANS ORIGINATED
10
$67,473
25
$104,036
101
$122,409
20
$25,988
14
$149,196
11
$78,779
APPLICATIONS APPROVED, NOT ACCEPTED
0
$0
1
$28,130
7
$99,294
1
$13,130
0
$0
0
$0
APPLICATIONS DENIED
5
$61,318
13
$84,762
54
$81,906
7
$23,900
6
$147,252
10
$66,473
APPLICATIONS WITHDRAWN
0
$0
0
$0
31
$116,468
2
$44,065
0
$0
2
$63,670
FILES CLOSED FOR INCOMPLETENESS
0
$0
0
$0
8
$102,974
1
$19,690
0
$0
0
$0
Aggregated Statistics For Year 2008 (Based on 2 full and 2 partial tracts)
A) FHA, FSA/RHS & VA Home Purchase Loans
B) Conventional Home Purchase Loans
C) Refinancings
D) Home Improvement Loans
F) Non-occupant Loans on < 5 Family Dwellings (A B C & D)
G) Loans On Manufactured Home Dwelling (A B C & D)
Number
Average Value
Number
Average Value
Number
Average Value
Number
Average Value
Number
Average Value
Number
Average Value
LOANS ORIGINATED
11
$82,150
38
$80,725
72
$91,158
21
$11,363
13
$85,439
17
$37,890
APPLICATIONS APPROVED, NOT ACCEPTED
1
$42,190
4
$34,690
18
$120,583
4
$15,935
2
$72,195
3
$41,253
APPLICATIONS DENIED
1
$27,190
25
$72,231
101
$102,969
13
$30,842
7
$113,313
9
$54,709
APPLICATIONS WITHDRAWN
1
$95,640
6
$75,237
16
$104,541
0
$0
3
$13,490
5
$52,318
FILES CLOSED FOR INCOMPLETENESS
0
$0
0
$0
3
$88,813
2
$16,650
0
$0
0
$0
Aggregated Statistics For Year 2007 (Based on 2 full and 2 partial tracts)
A) FHA, FSA/RHS & VA Home Purchase Loans
B) Conventional Home Purchase Loans
C) Refinancings
D) Home Improvement Loans
F) Non-occupant Loans on < 5 Family Dwellings (A B C & D)
G) Loans On Manufactured Home Dwelling (A B C & D)
Number
Average Value
Number
Average Value
Number
Average Value
Number
Average Value
Number
Average Value
Number
Average Value
LOANS ORIGINATED
12
$102,197
66
$99,978
91
$81,006
45
$32,508
23
$86,667
28
$68,127
APPLICATIONS APPROVED, NOT ACCEPTED
1
$134,080
22
$103,453
19
$76,924
2
$27,660
5
$77,904
4
$62,688
APPLICATIONS DENIED
1
$111,570
44
$72,718
99
$90,883
36
$39,926
16
$80,192
32
$57,673
APPLICATIONS WITHDRAWN
0
$0
11
$84,585
27
$90,257
2
$88,155
0
$0
2
$59,750
FILES CLOSED FOR INCOMPLETENESS
0
$0
0
$0
8
$109,258
0
$0
0
$0
1
$4,690
Aggregated Statistics For Year 2006 (Based on 2 full and 2 partial tracts)
A) FHA, FSA/RHS & VA Home Purchase Loans
B) Conventional Home Purchase Loans
C) Refinancings
D) Home Improvement Loans
E) Loans on Dwellings For 5+ Families
F) Non-occupant Loans on < 5 Family Dwellings (A B C & D)
G) Loans On Manufactured Home Dwelling (A B C & D)
Number
Average Value
Number
Average Value
Number
Average Value
Number
Average Value
Number
Average Value
Number
Average Value
Number
Average Value
LOANS ORIGINATED
10
$84,320
78
$105,467
105
$90,434
31
$24,568
2
$67,585
31
$78,496
17
$72,775
APPLICATIONS APPROVED, NOT ACCEPTED
0
$0
3
$69,693
29
$79,077
1
$26,250
0
$0
3
$78,447
4
$36,098
APPLICATIONS DENIED
2
$56,725
45
$56,186
133
$90,095
28
$24,718
0
$0
17
$31,891
24
$53,445
APPLICATIONS WITHDRAWN
0
$0
15
$52,483
51
$87,954
5
$33,986
0
$0
6
$75,422
3
$54,380
FILES CLOSED FOR INCOMPLETENESS
0
$0
0
$0
9
$142,398
0
$0
0
$0
0
$0
0
$0
Aggregated Statistics For Year 2005 (Based on 2 full and 2 partial tracts)
A) FHA, FSA/RHS & VA Home Purchase Loans
B) Conventional Home Purchase Loans
C) Refinancings
D) Home Improvement Loans
F) Non-occupant Loans on < 5 Family Dwellings (A B C & D)
G) Loans On Manufactured Home Dwelling (A B C & D)
Number
Average Value
Number
Average Value
Number
Average Value
Number
Average Value
Number
Average Value
Number
Average Value
LOANS ORIGINATED
8
$103,604
85
$104,019
133
$91,607
33
$32,075
33
$104,199
16
$60,522
APPLICATIONS APPROVED, NOT ACCEPTED
4
$79,105
5
$79,310
34
$65,460
6
$32,965
2
$31,410
7
$59,801
APPLICATIONS DENIED
3
$55,967
26
$58,117
130
$88,209
44
$20,746
1
$51,570
21
$55,963
APPLICATIONS WITHDRAWN
5
$104,382
16
$84,346
67
$110,447
6
$56,050
7
$94,209
5
$93,596
FILES CLOSED FOR INCOMPLETENESS
0
$0
3
$84,383
13
$122,980
2
$16,650
0
$0
0
$0
Aggregated Statistics For Year 2004 (Based on 2 full and 2 partial tracts)
A) FHA, FSA/RHS & VA Home Purchase Loans
B) Conventional Home Purchase Loans
C) Refinancings
D) Home Improvement Loans
F) Non-occupant Loans on < 5 Family Dwellings (A B C & D)
G) Loans On Manufactured Home Dwelling (A B C & D)
Number
Average Value
Number
Average Value
Number
Average Value
Number
Average Value
Number
Average Value
Number
Average Value
LOANS ORIGINATED
13
$92,455
71
$86,481
142
$84,905
37
$23,284
30
$84,370
21
$48,963
APPLICATIONS APPROVED, NOT ACCEPTED
0
$0
12
$75,260
33
$85,470
3
$38,753
6
$47,017
5
$37,128
APPLICATIONS DENIED
3
$69,070
40
$60,816
141
$87,940
44
$21,775
21
$105,208
33
$42,867
APPLICATIONS WITHDRAWN
0
$0
6
$80,815
71
$88,123
2
$4,895
12
$91,845
4
$68,522
FILES CLOSED FOR INCOMPLETENESS
0
$0
6
$51,505
22
$93,522
6
$56,752
2
$88,155
2
$142,515
Aggregated Statistics For Year 2003 (Based on 2 full and 2 partial tracts)
A) FHA, FSA/RHS & VA Home Purchase Loans
B) Conventional Home Purchase Loans
C) Refinancings
D) Home Improvement Loans
F) Non-occupant Loans on < 5 Family Dwellings (A B C & D)
Number
Average Value
Number
Average Value
Number
Average Value
Number
Average Value
Number
Average Value
LOANS ORIGINATED
6
$76,883
66
$67,173
317
$75,840
40
$10,557
33
$54,619
APPLICATIONS APPROVED, NOT ACCEPTED
1
$49,690
8
$52,282
41
$78,281
1
$2,810
0
$0
APPLICATIONS DENIED
4
$76,180
40
$55,922
116
$79,411
23
$9,639
7
$54,830
APPLICATIONS WITHDRAWN
2
$53,445
9
$69,293
48
$84,660
4
$13,712
5
$39,344
FILES CLOSED FOR INCOMPLETENESS
1
$78,760
0
$0
23
$109,094
0
$0
1
$159,390
Aggregated Statistics For Year 2002 (Based on 2 full and 2 partial tracts)
A) FHA, FSA/RHS & VA Home Purchase Loans
B) Conventional Home Purchase Loans
C) Refinancings
D) Home Improvement Loans
E) Loans on Dwellings For 5+ Families
F) Non-occupant Loans on < 5 Family Dwellings (A B C & D)
Number
Average Value
Number
Average Value
Number
Average Value
Number
Average Value
Number
Average Value
Number
Average Value
LOANS ORIGINATED
9
$66,728
98
$67,930
236
$75,958
35
$24,955
4
$132,232
14
$48,042
APPLICATIONS APPROVED, NOT ACCEPTED
2
$98,450
7
$44,833
50
$92,121
5
$27,462
0
$0
1
$28,130
APPLICATIONS DENIED
0
$0
50
$47,272
134
$79,500
23
$9,182
0
$0
17
$38,003
APPLICATIONS WITHDRAWN
2
$93,055
11
$82,557
55
$79,858
2
$9,795
0
$0
8
$56,910
FILES CLOSED FOR INCOMPLETENESS
4
$37,220
1
$56,260
23
$97,775
1
$20,630
0
$0
0
$0
Aggregated Statistics For Year 2001 (Based on 2 full and 2 partial tracts)
A) FHA, FSA/RHS & VA Home Purchase Loans
B) Conventional Home Purchase Loans
C) Refinancings
D) Home Improvement Loans
E) Loans on Dwellings For 5+ Families
F) Non-occupant Loans on < 5 Family Dwellings (A B C & D)
Number
Average Value
Number
Average Value
Number
Average Value
Number
Average Value
Number
Average Value
Number
Average Value
LOANS ORIGINATED
12
$70,559
88
$74,841
203
$72,201
39
$28,395
1
$195,020
26
$55,866
APPLICATIONS APPROVED, NOT ACCEPTED
0
$0
15
$37,381
47
$79,016
9
$13,409
0
$0
0
$0
APPLICATIONS DENIED
10
$76,931
88
$45,478
129
$70,873
40
$11,464
0
$0
2
$14,065
APPLICATIONS WITHDRAWN
0
$0
15
$75,270
66
$81,777
12
$23,403
0
$0
4
$45,238
FILES CLOSED FOR INCOMPLETENESS
0
$0
0
$0
11
$65,842
0
$0
0
$0
0
$0
Aggregated Statistics For Year 2000 (Based on 2 full and 2 partial tracts)
A) FHA, FSA/RHS & VA Home Purchase Loans
B) Conventional Home Purchase Loans
C) Refinancings
D) Home Improvement Loans
F) Non-occupant Loans on < 5 Family Dwellings (A B C & D)
Number
Average Value
Number
Average Value
Number
Average Value
Number
Average Value
Number
Average Value
LOANS ORIGINATED
14
$63,281
129
$54,780
85
$54,736
41
$13,608
40
$43,767
APPLICATIONS APPROVED, NOT ACCEPTED
4
$38,675
25
$43,573
36
$60,539
12
$18,605
2
$37,035
APPLICATIONS DENIED
11
$40,579
125
$40,453
102
$64,732
33
$11,099
10
$56,196
APPLICATIONS WITHDRAWN
10
$49,371
21
$68,253
28
$42,525
5
$7,768
6
$63,252
FILES CLOSED FOR INCOMPLETENESS
1
$78,760
0
$0
9
$71,792
3
$4,543
1
$45,940
Aggregated Statistics For Year 1999 (Based on 1 full and 1 partial tracts)
A) FHA, FSA/RHS & VA Home Purchase Loans
B) Conventional Home Purchase Loans
C) Refinancings
D) Home Improvement Loans
F) Non-occupant Loans on < 5 Family Dwellings (A B C & D)
Detailed PMIC statistics for the following Tracts:9516.00
, 9517.00
2002 - 2018 National Fire Incident Reporting System (NFIRS) incidents
According to the data from the years 2002 - 2018 the average number of fire incidents per year is 16. The highest number of fires - 34 took place in 2010, and the least - 1 in 2014. The data has a dropping trend.
When looking into fire subcategories, the most incidents belonged to: Structure Fires (54.0%), and Outside Fires (29.5%).
Fire incident types reported to NFIRS in Zip Code 45167


 Nearest zip codes: 45168, 45101, 41034, 45115, 41062, 45121.


 According to the data from the years 2002 - 2018 the average number of fire incidents per year is 16. The highest number of fires - 34 took place in 2010, and the least - 1 in 2014. The data has a dropping trend.
 When looking into fire subcategories, the most incidents belonged to: Structure Fires (54.0%), and Outside Fires (29.5%).