Estimated zip code population in 2022: 2,116 Zip code population in 2010: 1,970 Zip code population in 2000: 1,898
Houses and condos: 750 Renter-occupied apartments: 130
% of renters here:
19%
State:
33%
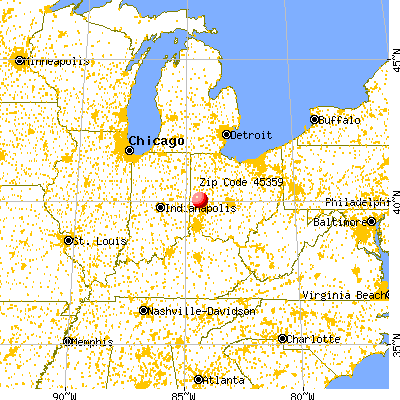
March 2022 cost of living index in zip code 45359: 83.0 (low, U.S. average is 100)
Land area: 15.1 sq. mi. Water area: 0.1 sq. mi.
Population density: 140 people per square mile
(very low).
OSM Map
General Map
Google Map
MSN Map
OSM Map
General Map
Google Map
MSN Map
OSM Map
General Map
Google Map
MSN Map
OSM Map
General Map
Google Map
MSN Map
Please wait while loading the map...
Real estate property taxes paid for housing units in 2022:
This zip code:
1.0% ($1,871)
Ohio:
1.3% ($2,639)
Median real estate property taxes paid for housing units with mortgages in 2022: $1,804 (1.0%) Median real estate property taxes paid for housing units with no mortgage in 2022: $2,005 (1.0%)
Business Search- 14 Million verified businesses
Males: 1,045
(49.4%)
Females: 1,071
(50.6%)
For population 25 years and over in 45359:
High school or higher: 96.4%
Bachelor's degree or higher: 19.1%
Graduate or professional degree: 7.7%
Unemployed: 1.7%
Mean travel time to work (commute): 27.1 minutes
For population 15 years and over in 45359:
Never married: 27.1%
Now married: 54.6%
Separated: 1.0%
Widowed: 4.2%
Divorced: 13.1%
Zip code 45359 compared to state average:
Unemployed percentage below state average.
Black race population percentage significantly below state average.
Hispanic race population percentage significantly below state average.
Foreign-born population percentage significantly below state average.
Renting percentage below state average.
Length of stay since moving in above state average.
Percentage of population with a bachelor's degree or higher below state average.
Estimated median house/condo value in 2022: $191,184
45359:
$191,184
Ohio:
$204,100
According to our research of Ohio and other state lists, there were 3 registered sex offenders living in 45359 zip code as of June 16, 2024. The ratio of all residents to sex offenders in zip code 45359 is 646 to 1. The ratio of registered sex offenders to all residents in this zip code is near the state average.
Median resident age:
This zip code:
40.0 years
Ohio median age:
39.9 years
Average household size:
This zip code:
3.0 people
Ohio:
2.4 people
Averages for the 2020 tax year for zip code 45359, filed in 2021:
Average Adjusted Gross Income (AGI) in 2020: $66,477 (Individual Income Tax Returns)
Here:
$66,477
State:
$67,288
Salary/wage: $54,003 (reported on 81.9% of returns)
Here:
$54,003
State:
$55,628
(% of AGI for various income ranges: 1237.3% for AGIs below $25k, 3943.5% for AGIs $25k-50k, 7436.7% for AGIs $50k-75k, 10760.0% for AGIs $75k-100k, 14458.8% for AGIs $100k-200k)
Taxable interest for individuals: $576 (reported on 36.2% of returns)
This zip code:
$576
Ohio:
$1,518
(% of AGI for various income ranges: 16.7% for AGIs below $25k, 7.1% for AGIs $25k-50k, 20.8% for AGIs $50k-75k, 23.8% for AGIs $75k-100k, 102.5% for AGIs $100k-200k)
Ordinary dividends: $1,806 (reported on 19.1% of returns)
Here:
$1,806
State:
$7,167
(% of AGI for various income ranges: 20.0% for AGIs below $25k, 12.9% for AGIs $25k-50k, 40.8% for AGIs $50k-75k, 73.8% for AGIs $75k-100k, 206.2% for AGIs $100k-200k)
Net capital gain/loss in AGI: +$7,106 (reported on 17.0% of returns)
Here:
+$7,106
State:
+$18,919
(% of AGI for various income ranges: 32.7% for AGIs below $25k, 30.0% for AGIs $50k-75k, 92.5% for AGIs $75k-100k, 1222.5% for AGIs $100k-200k)
Profit/loss from business: +$7,947 (reported on 16.0% of returns)
Here:
+$7,947
State:
+$13,744
(% of AGI for various income ranges: 100.0% for AGIs below $25k, 151.2% for AGIs $25k-50k, 91.7% for AGIs $50k-75k, 577.5% for AGIs $75k-100k, 266.2% for AGIs $100k-200k)
Taxable individual retirement arrangement distribution: $17,809 (reported on 11.7% of returns)
45359:
$17,809
Ohio:
$18,876
(% of AGI for various income ranges: 263.3% for AGIs below $25k, 458.3% for AGIs $50k-75k, 1267.5% for AGIs $100k-200k)
Total itemized deductions: $26,650 (reported on 4.3% of returns)
Here:
$26,650
State:
$33,869
(% of AGI for various income ranges: 1332.5% for AGIs $75k-100k)
Charity contributions: $10,100 (reported on 3.2% of returns)
Here:
$10,100
State:
$14,577
(% of AGI for various income ranges: 378.8% for AGIs $75k-100k)
Taxes paid: $6,175 (reported on 4.3% of returns)
45359:
$6,175
State:
$7,681
(% of AGI for various income ranges: 308.8% for AGIs $75k-100k)
Earned income credit: $1,962 (reported on 8.5% of returns)
Here:
$1,962
State:
$2,304
(% of AGI for various income ranges: 38.0% for AGIs below $25k, 58.8% for AGIs $25k-50k)
Percentage of individuals using paid preparers for their 2020 taxes: 97.9%
Here:
98%
State:
94%
(% for various income ranges: 96.0% for AGIs below $25k, 100.0% for AGIs $25k-50k, 94.4% for AGIs $50k-75k, 100.0% for AGIs $75k-100k, 100.0% for AGIs $100k-200k, 100.0% for AGIs over 200k)
Averages for the 2012 tax year for zip code 45359, filed in 2013:
Average Adjusted Gross Income (AGI) in 2012: $46,570 (Individual Income Tax Returns)
Here:
$46,570
State:
$54,926
Salary/wage: $42,127 (reported on 82.8% of returns)
Here:
$42,127
State:
$45,869
(% of AGI for various income ranges: 67.5% for AGIs below $25k, 79.8% for AGIs $25k-50k, 79.5% for AGIs $50k-75k, 74.3% for AGIs $75k-100k, 69.1% for AGIs $100k-200k)
Taxable interest for individuals: $447 (reported on 32.3% of returns)
This zip code:
$447
Ohio:
$1,297
(% of AGI for various income ranges: 0.8% for AGIs below $25k, 0.4% for AGIs $25k-50k, 0.3% for AGIs $50k-75k, 0.3% for AGIs $75k-100k, 0.1% for AGIs $100k-200k)
Ordinary dividends: $1,606 (reported on 19.4% of returns)
Here:
$1,606
State:
$5,821
(% of AGI for various income ranges: 1.8% for AGIs below $25k, 0.3% for AGIs $25k-50k, 0.4% for AGIs $50k-75k, 1.3% for AGIs $75k-100k, 0.3% for AGIs $100k-200k)
Net capital gain/loss in AGI: +$1,545 (reported on 11.8% of returns)
Here:
+$1,545
State:
+$11,232
(% of AGI for various income ranges: 0.5% for AGIs $25k-50k, 0.1% for AGIs $50k-75k, 1.3% for AGIs $75k-100k)
Profit/loss from business: +$7,777 (reported on 14.0% of returns)
Here:
+$7,777
State:
+$12,773
(% of AGI for various income ranges: 3.9% for AGIs below $25k, 1.8% for AGIs $25k-50k, 3.1% for AGIs $50k-75k, 4.0% for AGIs $75k-100k)
Taxable individual retirement arrangement distribution: $8,536 (reported on 11.8% of returns)
45359:
$8,536
Ohio:
$14,511
(% of AGI for various income ranges: 5.5% for AGIs below $25k, 1.7% for AGIs $25k-50k, 1.7% for AGIs $50k-75k, 4.1% for AGIs $75k-100k)
Total itemized deductions: $16,452 (23% of AGI, reported on 31.2% of returns)
Here:
$16,452
State:
$21,278
Here:
22.5% of AGI
State:
18.8% of AGI
(% of AGI for various income ranges: 12.6% for AGIs below $25k, 8.3% for AGIs $25k-50k, 9.0% for AGIs $50k-75k, 12.2% for AGIs $75k-100k, 13.8% for AGIs $100k-200k)
Charity contributions: $3,100 (reported on 20.4% of returns)
Here:
$3,100
State:
$3,943
(% of AGI for various income ranges: 1.0% for AGIs $25k-50k, 1.0% for AGIs $50k-75k, 1.3% for AGIs $75k-100k, 2.6% for AGIs $100k-200k)
Taxes paid: $6,321 (reported on 31.2% of returns)
45359:
$6,321
State:
$9,568
(% of AGI for various income ranges: 1.6% for AGIs below $25k, 2.6% for AGIs $25k-50k, 3.4% for AGIs $50k-75k, 4.9% for AGIs $75k-100k, 7.0% for AGIs $100k-200k)
Earned income credit: $2,182 (reported on 11.8% of returns)
Here:
$2,182
State:
$2,285
(% of AGI for various income ranges: 4.3% for AGIs below $25k, 0.8% for AGIs $25k-50k)
Percentage of individuals using paid preparers for their 2012 taxes: 60.2%
Here:
60%
State:
51%
(% for various income ranges: 53.1% for AGIs below $25k, 61.5% for AGIs $25k-50k, 68.8% for AGIs $50k-75k, 63.6% for AGIs $75k-100k, 62.5% for AGIs $100k-200k)
Averages for the 2004 tax year for zip code 45359, filed in 2005:
Average Adjusted Gross Income (AGI) in 2004: $38,177 (Individual Income Tax Returns)
Here:
$38,177
State:
$44,480
Salary/wage: $35,368 (reported on 86.0% of returns)
Here:
$35,368
State:
$39,198
(% of AGI for various income ranges: 92.2% for AGIs below $10k, 69.4% for AGIs $10k-25k, 81.2% for AGIs $25k-50k, 84.9% for AGIs $50k-75k, 88.1% for AGIs $75k-100k, 65.3% for AGIs over 100k)
Taxable interest for individuals: $771 (reported on 42.4% of returns)
This zip code:
$771
Ohio:
$1,532
(% of AGI for various income ranges: 4.4% for AGIs below $10k, 2.4% for AGIs $10k-25k, 0.7% for AGIs $25k-50k, 0.8% for AGIs $50k-75k, 0.1% for AGIs $75k-100k, 0.3% for AGIs over 100k)
Taxable dividends: $995 (reported on 21.7% of returns)
Here:
$995
State:
$3,496
(% of AGI for various income ranges: 3.0% for AGIs below $10k, 0.9% for AGIs $10k-25k, 0.4% for AGIs $25k-50k, 0.6% for AGIs $50k-75k, 0.3% for AGIs $75k-100k, 0.6% for AGIs over 100k)
Net capital gain/loss: +$3,421 (reported on 14.2% of returns)
Here:
+$3,421
State:
+$8,582
(% of AGI for various income ranges: -2.6% for AGIs below $10k, 2.0% for AGIs $10k-25k, 0.3% for AGIs $25k-50k, -0.1% for AGIs $50k-75k, 0.5% for AGIs $75k-100k, 6.4% for AGIs over 100k)
Profit/loss from business: +$9,086 (reported on 18.6% of returns)
Here:
+$9,086
State:
+$10,813
(% of AGI for various income ranges: 4.1% for AGIs below $10k, 6.3% for AGIs $10k-25k, 3.2% for AGIs $25k-50k, 3.6% for AGIs $50k-75k, 5.2% for AGIs $75k-100k, 6.4% for AGIs over 100k)
IRA payment deduction: $2,615 (reported on 1.4% of returns)
45359:
$2,615
Ohio:
$2,794
Total itemized deductions: $13,349 (21% of AGI, reported on 33.6% of returns)
Here:
$13,349
State:
$17,503
Here:
21.0% of AGI
State:
20.8% of AGI
(% of AGI for various income ranges: 10.5% for AGIs $10k-25k, 9.1% for AGIs $25k-50k, 13.0% for AGIs $50k-75k, 15.4% for AGIs $75k-100k, 14.1% for AGIs over 100k)
Charity contributions deductions: $2,231 (3% of AGI, reported on 24.0% of returns)
Here:
$2,231
State:
$3,087
Here:
3.2% of AGI
State:
3.4% of AGI
(% of AGI for various income ranges: 0.5% for AGIs $10k-25k, 0.9% for AGIs $25k-50k, 1.2% for AGIs $50k-75k, 2.3% for AGIs $75k-100k, 2.7% for AGIs over 100k)
Total tax: $4,310 (reported on 78.8% of returns)
45359:
$4,310
State:
$6,781
(% of AGI for various income ranges: 2.6% for AGIs below $10k, 4.8% for AGIs $10k-25k, 6.9% for AGIs $25k-50k, 8.1% for AGIs $50k-75k, 10.7% for AGIs $75k-100k, 16.3% for AGIs over 100k)
Earned income credit: $1,506 (reported on 9.3% of returns)
Here:
$1,506
State:
$1,696
Percentage of individuals using paid preparers for their 2004 taxes: 61.8%
Here:
62%
State:
55%
(% for various income ranges: 53.3% for AGIs below $10k, 61.6% for AGIs $10k-25k, 67.6% for AGIs $25k-50k, 64.1% for AGIs $50k-75k, 47.5% for AGIs $75k-100k, 66.7% for AGIs over 100k)
Likely homosexual households (counted as self-reported same-sex unmarried-partner households)
Lesbian couples: 0.0% of all households
Gay men: 0.6% of all households
Household received Food Stamps/SNAP in the past 12 months: 3 Household did not receive Food Stamps/SNAP in the past 12 months: 690
Women who had a birth in the past 12 months: 20 (21 now married, 0 unmarried) Women who did not have a birth in the past 12 months: 392 (227 now married, 164 unmarried)
Housing units in zip code 45359 with a mortgage: 335 (30 second mortgage, 19 both second mortgage and home equity loan) Houses without a mortgage: 46
Median monthly owner costs for units with a mortgage: $1,136 Median monthly owner costs for units without a mortgage: $545
Residents with income below the poverty level in 2022:
This zip code:
16.7%
Whole state:
13.4%
Residents with income below 50% of the poverty level in 2022:
This zip code:
15.2%
Whole state:
7.0%
Median number of rooms in houses and condos:
Here:
7.0
State:
6.7
Median number of rooms in apartments:
Here:
5.7
State:
4.4
Notable locations in this zip code not listed on our city pages
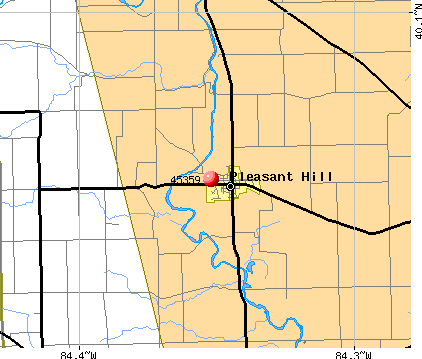
Notable locations in zip code 45359: Rolling Hills Girl Scout Camp (A), Wackler Farms (B), Miami Valley Organic Farms (C), Pleasant Hill - Newton Township Joint Fire District (D). Display/hide their locations on the map
Churches in zip code 45359 include: Pleasant Hill United Church of Christ (A), First Brethren Church (B), Pleasant Hill Church of God (C), Brethren in Christ Church (D). Display/hide their locations on the map
Size of family households: 255 2-persons, 98 3-persons, 45 4-persons, 48 5-persons, 18 6-persons, 43 7-or-more-persons
Size of nonfamily households: 159 1-person, 22 2-persons, 2 3-persons
502 married couples with children.
16 single-parent households (9 men, 7 women).
98.4% of residents of 45359 zip code speak English at home.
0.8% of residents speak Spanish at home (100% very well).
0.4% of residents speak other Indo-European language at home (100% very well).
Foreign born population: 11 (0.5%) (18.5% of them are naturalized citizens)
This zip code:
0.5%
Whole state:
5.0%
18%France
34%German
19%American
13%English
4%Irish
3%European
2%Norwegian
2%Italian
Year of entry for the foreign-born population
02010 or later
12000 to 2009
81990 to 1999
10Before 1990
Housing units lacking complete kitchen facilities: 1.3%
47.0%Utility gas
31.8%Electricity
11.4%Bottled, tank, or LP gas
7.5%Wood
1.3%Fuel oil, kerosene, etc.
1.3%No fuel used
Population in 1990: 2,553.
Place of birth for U.S.-born residents:
This state: 1,863
Northeast: 45
Midwest: 102
South: 53
West: 27
70% of the 45359 zip code residents lived in the same house 5 years ago. Out of people who lived in different houses, 79% lived in this county. Out of people who lived in different counties, 50% lived in Ohio.
98% of the 45359 zip code residents lived in the same house 1 year ago. Out of people who lived in different houses, 130% moved from this county.
Private vs. public school enrollment:
Students in private schools in grades 1 to 8 (elementary and middle school): 33
Here:
9.9%
Ohio:
16.0%
Students in private schools in grades 9 to 12 (high school): 44
Here:
27.0%
Ohio:
13.1%
Students in private undergraduate colleges:
Here:
0.0%
Ohio:
22.3%
Occupation by median earnings in the past 12 months ($)
219,311Architecture and engineering occupations
74,839Health diagnosing and treating practitioners and other technical occupations
67,290Management occupations
65,454Health technologists and technicians
61,020Education, training, and library occupations
56,230Business and financial operations occupations
Top industries in this zip code by the number of employees in 2005:
Administrative and Support and Waste Management and Remediation Services: Professional Employer Organizations (20-49 employees: 1 establishment)
Other Services (except Public Administration): Religious Organizations (5-9: 1, 1-4: 4)
Other Services (except Public Administration): Funeral Homes and Funeral Services (10-19: 1)
Construction: New Single-Family Housing Construction (except Operative Builders) (5-9: 1, 1-4: 1)
Wholesale Trade: Roofing, Siding, and Insulation Material Merchant Wholesalers (5-9: 1)
Other Services (except Public Administration): General Automotive Repair (5-9: 1)
Construction: Siding Contractors (5-9: 1)
Wholesale Trade: Computer and Computer Peripheral Equipment and Software Merchant Wholesalers (5-9: 1)
Home Mortgage Disclosure Act Aggregated Statistics For Year 2009 (Based on 4 partial tracts)
A) FHA, FSA/RHS & VA Home Purchase Loans
B) Conventional Home Purchase Loans
C) Refinancings
D) Home Improvement Loans
F) Non-occupant Loans on < 5 Family Dwellings (A B C & D)
G) Loans On Manufactured Home Dwelling (A B C & D)
Number
Average Value
Number
Average Value
Number
Average Value
Number
Average Value
Number
Average Value
Number
Average Value
LOANS ORIGINATED
6
$109,433
10
$104,351
63
$124,440
6
$73,293
2
$73,190
1
$46,770
APPLICATIONS APPROVED, NOT ACCEPTED
0
$0
1
$146,990
5
$149,542
0
$0
0
$0
0
$0
APPLICATIONS DENIED
2
$111,460
1
$111,150
22
$139,536
1
$25,510
1
$74,710
2
$85,035
APPLICATIONS WITHDRAWN
2
$76,835
1
$97,180
9
$103,663
0
$0
1
$89,900
0
$0
FILES CLOSED FOR INCOMPLETENESS
0
$0
0
$0
1
$175,540
0
$0
0
$0
0
$0
Aggregated Statistics For Year 2008 (Based on 4 partial tracts)
A) FHA, FSA/RHS & VA Home Purchase Loans
B) Conventional Home Purchase Loans
C) Refinancings
D) Home Improvement Loans
F) Non-occupant Loans on < 5 Family Dwellings (A B C & D)
G) Loans On Manufactured Home Dwelling (A B C & D)
Number
Average Value
Number
Average Value
Number
Average Value
Number
Average Value
Number
Average Value
Number
Average Value
LOANS ORIGINATED
3
$77,543
6
$129,073
31
$115,778
3
$28,547
3
$70,660
1
$99,610
APPLICATIONS APPROVED, NOT ACCEPTED
1
$84,430
0
$0
3
$167,843
0
$0
0
$0
0
$0
APPLICATIONS DENIED
2
$132,715
3
$70,053
20
$146,535
0
$0
1
$48,590
1
$47,980
APPLICATIONS WITHDRAWN
1
$66,810
1
$231,420
7
$150,721
0
$0
0
$0
0
$0
FILES CLOSED FOR INCOMPLETENESS
0
$0
0
$0
1
$35,230
0
$0
0
$0
0
$0
Aggregated Statistics For Year 2007 (Based on 4 partial tracts)
A) FHA, FSA/RHS & VA Home Purchase Loans
B) Conventional Home Purchase Loans
C) Refinancings
D) Home Improvement Loans
F) Non-occupant Loans on < 5 Family Dwellings (A B C & D)
Number
Average Value
Number
Average Value
Number
Average Value
Number
Average Value
Number
Average Value
LOANS ORIGINATED
5
$134,356
19
$115,534
30
$118,990
5
$40,332
1
$128,770
APPLICATIONS APPROVED, NOT ACCEPTED
0
$0
2
$102,650
4
$62,562
1
$78,350
0
$0
APPLICATIONS DENIED
1
$62,560
4
$169,618
18
$116,384
3
$22,677
2
$63,475
APPLICATIONS WITHDRAWN
0
$0
3
$146,790
10
$129,315
1
$21,260
1
$54,060
FILES CLOSED FOR INCOMPLETENESS
0
$0
0
$0
4
$160,810
0
$0
0
$0
Aggregated Statistics For Year 2006 (Based on 4 partial tracts)
A) FHA, FSA/RHS & VA Home Purchase Loans
B) Conventional Home Purchase Loans
C) Refinancings
D) Home Improvement Loans
F) Non-occupant Loans on < 5 Family Dwellings (A B C & D)
G) Loans On Manufactured Home Dwelling (A B C & D)
Number
Average Value
Number
Average Value
Number
Average Value
Number
Average Value
Number
Average Value
Number
Average Value
LOANS ORIGINATED
2
$169,160
32
$114,134
46
$107,682
4
$89,895
2
$113,885
2
$104,170
APPLICATIONS APPROVED, NOT ACCEPTED
0
$0
5
$130,106
9
$107,374
1
$155,490
1
$109,330
0
$0
APPLICATIONS DENIED
1
$170,680
2
$117,230
29
$118,066
2
$78,660
0
$0
1
$170,070
APPLICATIONS WITHDRAWN
0
$0
2
$140,005
9
$149,353
2
$44,340
0
$0
1
$53,450
FILES CLOSED FOR INCOMPLETENESS
0
$0
0
$0
5
$161,326
1
$21,260
0
$0
0
$0
Aggregated Statistics For Year 2005 (Based on 4 partial tracts)
A) FHA, FSA/RHS & VA Home Purchase Loans
B) Conventional Home Purchase Loans
C) Refinancings
D) Home Improvement Loans
F) Non-occupant Loans on < 5 Family Dwellings (A B C & D)
G) Loans On Manufactured Home Dwelling (A B C & D)
Number
Average Value
Number
Average Value
Number
Average Value
Number
Average Value
Number
Average Value
Number
Average Value
LOANS ORIGINATED
5
$154,280
32
$140,442
38
$101,244
7
$75,579
1
$73,500
1
$85,040
APPLICATIONS APPROVED, NOT ACCEPTED
0
$0
1
$184,650
7
$118,183
1
$45,550
0
$0
0
$0
APPLICATIONS DENIED
1
$121,480
4
$63,778
26
$108,514
7
$47,464
1
$122,090
2
$79,265
APPLICATIONS WITHDRAWN
2
$104,475
2
$197,710
15
$142,293
4
$117,078
0
$0
1
$37,660
FILES CLOSED FOR INCOMPLETENESS
0
$0
1
$64,380
1
$168,860
0
$0
0
$0
0
$0
Aggregated Statistics For Year 2004 (Based on 4 partial tracts)
A) FHA, FSA/RHS & VA Home Purchase Loans
B) Conventional Home Purchase Loans
C) Refinancings
D) Home Improvement Loans
F) Non-occupant Loans on < 5 Family Dwellings (A B C & D)
G) Loans On Manufactured Home Dwelling (A B C & D)
Number
Average Value
Number
Average Value
Number
Average Value
Number
Average Value
Number
Average Value
Number
Average Value
LOANS ORIGINATED
3
$101,840
21
$133,570
52
$114,086
3
$12,350
2
$88,680
1
$82,000
APPLICATIONS APPROVED, NOT ACCEPTED
0
$0
1
$116,010
7
$113,063
2
$15,790
1
$140,920
1
$34,620
APPLICATIONS DENIED
1
$97,790
5
$99,370
30
$124,537
4
$40,545
0
$0
0
$0
APPLICATIONS WITHDRAWN
1
$44,950
1
$55,880
19
$117,101
1
$36,440
2
$59,525
1
$82,000
FILES CLOSED FOR INCOMPLETENESS
0
$0
1
$152,460
2
$78,355
0
$0
1
$63,780
0
$0
Aggregated Statistics For Year 2003 (Based on 4 partial tracts)
A) FHA, FSA/RHS & VA Home Purchase Loans
B) Conventional Home Purchase Loans
C) Refinancings
D) Home Improvement Loans
F) Non-occupant Loans on < 5 Family Dwellings (A B C & D)
Number
Average Value
Number
Average Value
Number
Average Value
Number
Average Value
Number
Average Value
LOANS ORIGINATED
5
$105,080
19
$113,872
99
$100,712
5
$32,192
4
$58,615
APPLICATIONS APPROVED, NOT ACCEPTED
0
$0
3
$126,543
9
$91,244
0
$0
1
$58,310
APPLICATIONS DENIED
1
$58,310
5
$111,884
39
$109,021
4
$23,840
1
$94,150
APPLICATIONS WITHDRAWN
1
$71,670
2
$79,570
20
$102,013
2
$17,005
0
$0
FILES CLOSED FOR INCOMPLETENESS
0
$0
1
$60,740
2
$142,740
1
$1,820
0
$0
Aggregated Statistics For Year 2002 (Based on 4 partial tracts)
A) FHA, FSA/RHS & VA Home Purchase Loans
B) Conventional Home Purchase Loans
C) Refinancings
D) Home Improvement Loans
F) Non-occupant Loans on < 5 Family Dwellings (A B C & D)
Number
Average Value
Number
Average Value
Number
Average Value
Number
Average Value
Number
Average Value
LOANS ORIGINATED
4
$91,870
16
$102,574
73
$98,881
3
$10,730
1
$71,070
APPLICATIONS APPROVED, NOT ACCEPTED
1
$52,840
2
$118,745
8
$104,169
1
$6,070
1
$58,310
APPLICATIONS DENIED
1
$50,410
3
$75,923
27
$105,800
5
$35,108
2
$75,620
APPLICATIONS WITHDRAWN
0
$0
2
$160,355
16
$131,730
1
$9,110
0
$0
FILES CLOSED FOR INCOMPLETENESS
1
$31,580
0
$0
4
$129,225
0
$0
0
$0
Aggregated Statistics For Year 2001 (Based on 4 partial tracts)
A) FHA, FSA/RHS & VA Home Purchase Loans
B) Conventional Home Purchase Loans
C) Refinancings
D) Home Improvement Loans
F) Non-occupant Loans on < 5 Family Dwellings (A B C & D)
Number
Average Value
Number
Average Value
Number
Average Value
Number
Average Value
Number
Average Value
LOANS ORIGINATED
5
$100,586
18
$113,550
60
$86,737
5
$17,980
3
$83,213
APPLICATIONS APPROVED, NOT ACCEPTED
0
$0
1
$94,150
9
$92,528
3
$30,573
2
$77,140
APPLICATIONS DENIED
0
$0
3
$80,583
20
$92,446
7
$11,887
1
$42,520
APPLICATIONS WITHDRAWN
0
$0
1
$41,300
16
$125,542
1
$6,680
0
$0
FILES CLOSED FOR INCOMPLETENESS
0
$0
0
$0
1
$59,530
0
$0
0
$0
Aggregated Statistics For Year 2000 (Based on 4 partial tracts)
A) FHA, FSA/RHS & VA Home Purchase Loans
B) Conventional Home Purchase Loans
C) Refinancings
D) Home Improvement Loans
F) Non-occupant Loans on < 5 Family Dwellings (A B C & D)
Number
Average Value
Number
Average Value
Number
Average Value
Number
Average Value
Number
Average Value
LOANS ORIGINATED
5
$91,110
22
$84,898
22
$76,698
9
$11,406
3
$110,953
APPLICATIONS APPROVED, NOT ACCEPTED
1
$37,050
0
$0
7
$85,557
4
$11,085
0
$0
APPLICATIONS DENIED
1
$43,730
2
$73,190
19
$63,649
7
$21,606
0
$0
APPLICATIONS WITHDRAWN
0
$0
1
$93,540
5
$84,186
2
$12,150
0
$0
FILES CLOSED FOR INCOMPLETENESS
0
$0
1
$102,040
1
$196,800
0
$0
0
$0
Aggregated Statistics For Year 1999 (Based on 2 partial tracts)
A) FHA, FSA/RHS & VA Home Purchase Loans
B) Conventional Home Purchase Loans
C) Refinancings
D) Home Improvement Loans
F) Non-occupant Loans on < 5 Family Dwellings (A B C & D)
Detailed PMIC statistics for the following Tracts:3301.00
2002 - 2018 National Fire Incident Reporting System (NFIRS) incidents
According to the data from the years 2002 - 2018 the average number of fire incidents per year is 16. The highest number of reported fires - 44 took place in 2008, and the least - 5 in 2004. The data has an increasing trend.
When looking into fire subcategories, the most reports belonged to: Structure Fires (59.3%), and Outside Fires (31.9%).
Fire incident types reported to NFIRS in Zip Code 45359


 Nearest zip codes: 45339, 45318, 45383, 45337, 45361, 45308.


 According to the data from the years 2002 - 2018 the average number of fire incidents per year is 16. The highest number of reported fires - 44 took place in 2008, and the least - 5 in 2004. The data has an increasing trend.
 When looking into fire subcategories, the most reports belonged to: Structure Fires (59.3%), and Outside Fires (31.9%).