Estimated zip code population in 2022: 1,890 Zip code population in 2010: 1,770 Zip code population in 2000: 1,575
Houses and condos: 731 Renter-occupied apartments: 107
% of renters here:
15%
State:
33%
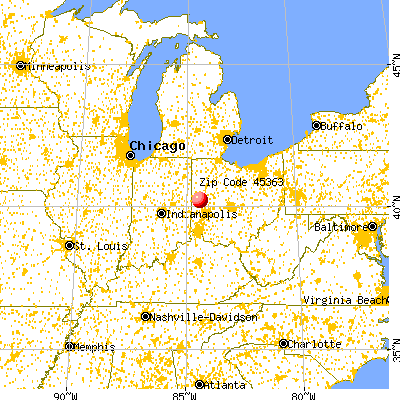
March 2022 cost of living index in zip code 45363: 83.8 (less than average, U.S. average is 100)
Land area: 23.3 sq. mi. Water area: 0.0 sq. mi.
Population density: 81 people per square mile
(very low).
OSM Map
General Map
Google Map
MSN Map
OSM Map
General Map
Google Map
MSN Map
OSM Map
General Map
Google Map
MSN Map
OSM Map
General Map
Google Map
MSN Map
Please wait while loading the map...
Real estate property taxes paid for housing units in 2022:
This zip code:
0.9% ($2,430)
Ohio:
1.3% ($2,639)
Median real estate property taxes paid for housing units with mortgages in 2022: $1,930 (0.7%) Median real estate property taxes paid for housing units with no mortgage in 2022: $2,887 (1.0%)
Business Search- 14 Million verified businesses
Males: 989
(52.3%)
Females: 900
(47.7%)
For population 25 years and over in 45363:
High school or higher: 94.9%
Bachelor's degree or higher: 24.2%
Graduate or professional degree: 7.4%
Unemployed: 1.6%
Mean travel time to work (commute): 20.4 minutes
For population 15 years and over in 45363:
Never married: 20.8%
Now married: 67.3%
Separated: 0.5%
Widowed: 5.6%
Divorced: 5.8%
Zip code 45363 compared to state average:
Unemployed percentage below state average.
Black race population percentage significantly below state average.
Foreign-born population percentage significantly below state average.
Renting percentage below state average.
Length of stay since moving in significantly above state average.
Estimated median house/condo value in 2022: $276,142
45363:
$276,142
Ohio:
$204,100
According to our research of Ohio and other state lists, there were 2 registered sex offenders living in 45363 zip code as of June 16, 2024. The ratio of all residents to sex offenders in zip code 45363 is 871 to 1. The ratio of registered sex offenders to all residents in this zip code is lower than the state average.
Median resident age:
This zip code:
38.4 years
Ohio median age:
39.9 years
Average household size:
This zip code:
2.6 people
Ohio:
2.4 people
Averages for the 2020 tax year for zip code 45363, filed in 2021:
Average Adjusted Gross Income (AGI) in 2020: $88,710 (Individual Income Tax Returns)
Here:
$88,710
State:
$67,288
Salary/wage: $62,741 (reported on 85.4% of returns)
Here:
$62,741
State:
$55,628
(% of AGI for various income ranges: 1744.5% for AGIs below $25k, 4437.5% for AGIs $25k-50k, 7835.6% for AGIs $50k-75k, 10134.3% for AGIs $75k-100k, 16231.1% for AGIs $100k-200k)
Taxable interest for individuals: $1,555 (reported on 40.2% of returns)
This zip code:
$1,555
Ohio:
$1,518
(% of AGI for various income ranges: 26.4% for AGIs below $25k, 45.8% for AGIs $25k-50k, 70.0% for AGIs $50k-75k, 44.3% for AGIs $75k-100k, 145.6% for AGIs $100k-200k)
Ordinary dividends: $4,671 (reported on 29.3% of returns)
Here:
$4,671
State:
$7,167
(% of AGI for various income ranges: 28.2% for AGIs below $25k, 61.7% for AGIs $25k-50k, 123.3% for AGIs $50k-75k, 101.4% for AGIs $75k-100k, 188.9% for AGIs $100k-200k)
Net capital gain/loss in AGI: +$13,891 (reported on 26.8% of returns)
Here:
+$13,891
State:
+$18,919
(% of AGI for various income ranges: 20.9% for AGIs below $25k, 132.5% for AGIs $25k-50k, 131.1% for AGIs $50k-75k, 415.7% for AGIs $75k-100k, 962.2% for AGIs $100k-200k)
Profit/loss from business: +$14,112 (reported on 9.8% of returns)
Here:
+$14,112
State:
+$13,744
(% of AGI for various income ranges: 3.6% for AGIs below $25k, 247.8% for AGIs $50k-75k, 1002.2% for AGIs $100k-200k)
Taxable individual retirement arrangement distribution: $19,136 (reported on 13.4% of returns)
45363:
$19,136
Ohio:
$18,876
(% of AGI for various income ranges: 99.1% for AGIs below $25k, 195.0% for AGIs $25k-50k, 804.4% for AGIs $50k-75k, 1153.3% for AGIs $100k-200k)
Total itemized deductions: $33,300 (reported on 3.7% of returns)
Here:
$33,300
State:
$33,869
(% of AGI for various income ranges: 1110.0% for AGIs $100k-200k)
Charity contributions: $11,333 (reported on 3.7% of returns)
Here:
$11,333
State:
$14,577
(% of AGI for various income ranges: 377.8% for AGIs $100k-200k)
Taxes paid: $9,067 (reported on 3.7% of returns)
45363:
$9,067
State:
$7,681
(% of AGI for various income ranges: 302.2% for AGIs $100k-200k)
Earned income credit: $1,775 (reported on 4.9% of returns)
Here:
$1,775
State:
$2,304
(% of AGI for various income ranges: 59.2% for AGIs $25k-50k)
Percentage of individuals using paid preparers for their 2020 taxes: 96.3%
Here:
96%
State:
94%
(% for various income ranges: 100.0% for AGIs below $25k, 94.4% for AGIs $25k-50k, 100.0% for AGIs $50k-75k, 90.9% for AGIs $75k-100k, 100.0% for AGIs $100k-200k, 80.0% for AGIs over 200k)
Averages for the 2012 tax year for zip code 45363, filed in 2013:
Average Adjusted Gross Income (AGI) in 2012: $64,512 (Individual Income Tax Returns)
Here:
$64,512
State:
$54,926
Salary/wage: $50,010 (reported on 84.3% of returns)
Here:
$50,010
State:
$45,869
(% of AGI for various income ranges: 80.6% for AGIs below $25k, 81.2% for AGIs $25k-50k, 87.3% for AGIs $50k-75k, 83.3% for AGIs $75k-100k, 76.7% for AGIs $100k-200k, 27.4% for AGIs over 200k)
Taxable interest for individuals: $852 (reported on 37.3% of returns)
This zip code:
$852
Ohio:
$1,297
(% of AGI for various income ranges: 1.3% for AGIs below $25k, 0.5% for AGIs $25k-50k, 0.3% for AGIs $50k-75k, 0.4% for AGIs $75k-100k, 0.4% for AGIs $100k-200k, 0.5% for AGIs over 200k)
Ordinary dividends: $4,261 (reported on 27.7% of returns)
Here:
$4,261
State:
$5,821
(% of AGI for various income ranges: 3.2% for AGIs below $25k, 0.6% for AGIs $25k-50k, 0.2% for AGIs $50k-75k, 0.6% for AGIs $75k-100k, 7.1% for AGIs $100k-200k)
Net capital gain/loss in AGI: +$8,563 (reported on 22.9% of returns)
Here:
+$8,563
State:
+$11,232
(% of AGI for various income ranges: 1.4% for AGIs below $25k, 1.5% for AGIs $25k-50k, 0.3% for AGIs $75k-100k, 13.4% for AGIs $100k-200k)
Profit/loss from business: +$11,130 (reported on 12.0% of returns)
Here:
+$11,130
State:
+$12,773
(% of AGI for various income ranges: 3.8% for AGIs $25k-50k, 3.0% for AGIs $50k-75k, 7.0% for AGIs $75k-100k)
Taxable individual retirement arrangement distribution: $11,289 (reported on 10.8% of returns)
45363:
$11,289
Ohio:
$14,511
(% of AGI for various income ranges: 5.6% for AGIs below $25k, 3.7% for AGIs $25k-50k, 6.6% for AGIs $75k-100k)
Total itemized deductions: $21,542 (16% of AGI, reported on 28.9% of returns)
Here:
$21,542
State:
$21,278
Here:
16.2% of AGI
State:
18.8% of AGI
(% of AGI for various income ranges: 10.4% for AGIs $25k-50k, 7.5% for AGIs $50k-75k, 9.6% for AGIs $75k-100k, 10.0% for AGIs $100k-200k, 12.1% for AGIs over 200k)
Charity contributions: $3,150 (reported on 19.3% of returns)
Here:
$3,150
State:
$3,943
(% of AGI for various income ranges: 0.4% for AGIs $25k-50k, 0.6% for AGIs $50k-75k, 1.4% for AGIs $75k-100k, 1.0% for AGIs $100k-200k, 1.2% for AGIs over 200k)
Taxes paid: $9,771 (reported on 28.9% of returns)
45363:
$9,771
State:
$9,568
(% of AGI for various income ranges: 2.8% for AGIs $25k-50k, 2.4% for AGIs $50k-75k, 4.3% for AGIs $75k-100k, 5.5% for AGIs $100k-200k, 6.2% for AGIs over 200k)
Earned income credit: $2,033 (reported on 10.8% of returns)
Here:
$2,033
State:
$2,285
(% of AGI for various income ranges: 3.9% for AGIs below $25k, 0.8% for AGIs $25k-50k)
Percentage of individuals using paid preparers for their 2012 taxes: 72.3%
Here:
72%
State:
51%
(% for various income ranges: 67.9% for AGIs below $25k, 80.0% for AGIs $25k-50k, 69.2% for AGIs $50k-75k, 70.0% for AGIs $75k-100k, 77.8% for AGIs $100k-200k, 66.7% for AGIs over 200k)
Averages for the 2004 tax year for zip code 45363, filed in 2005:
Average Adjusted Gross Income (AGI) in 2004: $50,931 (Individual Income Tax Returns)
Here:
$50,931
State:
$44,480
Salary/wage: $43,819 (reported on 86.6% of returns)
Here:
$43,819
State:
$39,198
(% of AGI for various income ranges: 100.0% for AGIs below $10k, 68.3% for AGIs $10k-25k, 88.9% for AGIs $25k-50k, 87.7% for AGIs $50k-75k, 91.0% for AGIs $75k-100k, 51.7% for AGIs over 100k)
Taxable interest for individuals: $1,600 (reported on 52.2% of returns)
This zip code:
$1,600
Ohio:
$1,532
(% of AGI for various income ranges: 7.0% for AGIs below $10k, 3.5% for AGIs $10k-25k, 1.8% for AGIs $25k-50k, 0.8% for AGIs $50k-75k, 0.5% for AGIs $75k-100k, 1.9% for AGIs over 100k)
Taxable dividends: $2,675 (reported on 31.1% of returns)
Here:
$2,675
State:
$3,496
(% of AGI for various income ranges: 9.0% for AGIs below $10k, 2.8% for AGIs $10k-25k, 0.5% for AGIs $25k-50k, 0.2% for AGIs $50k-75k, 0.3% for AGIs $75k-100k, 3.2% for AGIs over 100k)
Net capital gain/loss: +$1,019 (reported on 26.5% of returns)
Here:
+$1,019
State:
+$8,582
(% of AGI for various income ranges: -1.6% for AGIs below $10k, -0.5% for AGIs $10k-25k, 0.2% for AGIs $25k-50k, 1.1% for AGIs $50k-75k, 0.1% for AGIs $75k-100k, 0.8% for AGIs over 100k)
Profit/loss from business: +$7,701 (reported on 12.0% of returns)
Here:
+$7,701
State:
+$10,813
(% of AGI for various income ranges: 2.4% for AGIs $10k-25k, 0.7% for AGIs $25k-50k, 4.3% for AGIs $50k-75k, 4.7% for AGIs $75k-100k)
IRA payment deduction: $2,538 (reported on 1.6% of returns)
45363:
$2,538
Ohio:
$2,794
Total itemized deductions: $15,872 (16% of AGI, reported on 32.8% of returns)
Here:
$15,872
State:
$17,503
Here:
16.3% of AGI
State:
20.8% of AGI
(% of AGI for various income ranges: 6.4% for AGIs $10k-25k, 8.3% for AGIs $25k-50k, 10.6% for AGIs $50k-75k, 12.9% for AGIs $75k-100k, 11.3% for AGIs over 100k)
Charity contributions deductions: $2,005 (2% of AGI, reported on 25.6% of returns)
Here:
$2,005
State:
$3,087
Here:
2.0% of AGI
State:
3.4% of AGI
(% of AGI for various income ranges: 0.7% for AGIs $10k-25k, 0.6% for AGIs $25k-50k, 0.8% for AGIs $50k-75k, 1.1% for AGIs $75k-100k, 1.4% for AGIs over 100k)
Total tax: $8,425 (reported on 78.5% of returns)
45363:
$8,425
State:
$6,781
(% of AGI for various income ranges: 3.6% for AGIs below $10k, 4.8% for AGIs $10k-25k, 6.6% for AGIs $25k-50k, 7.3% for AGIs $50k-75k, 8.9% for AGIs $75k-100k, 23.5% for AGIs over 100k)
Earned income credit: $1,809 (reported on 5.8% of returns)
Here:
$1,809
State:
$1,696
Percentage of individuals using paid preparers for their 2004 taxes: 73.0%
Here:
73%
State:
55%
(% for various income ranges: 64.2% for AGIs below $10k, 67.4% for AGIs $10k-25k, 76.1% for AGIs $25k-50k, 82.6% for AGIs $50k-75k, 69.7% for AGIs $75k-100k, 79.2% for AGIs over 100k)
Household received Food Stamps/SNAP in the past 12 months: 19 Household did not receive Food Stamps/SNAP in the past 12 months: 700
Women who had a birth in the past 12 months: 27 (28 now married, 0 unmarried) Women who did not have a birth in the past 12 months: 331 (191 now married, 140 unmarried)
Housing units in zip code 45363 with a mortgage: 309 (41 second mortgage, 3 home equity loan, 39 both second mortgage and home equity loan) Houses without a mortgage: 4
Median monthly owner costs for units with a mortgage: $1,413 Median monthly owner costs for units without a mortgage: $545
Residents with income below the poverty level in 2022:
This zip code:
10.1%
Whole state:
13.4%
Residents with income below 50% of the poverty level in 2022:
This zip code:
8.8%
Whole state:
7.0%
Median number of rooms in houses and condos:
Here:
7.0
State:
6.7
Median number of rooms in apartments:
Here:
5.3
State:
4.4
Notable locations in this zip code not listed on our city pages
Notable locations in zip code 45363: Monnin Farms (A), Hoying Farm (B), Medders Farms (C), Schafer Dairy Farms (D), Sha - Bac Farm (E), Laneview Farm (F), Russia Fire Department (G). Display/hide their locations on the map
Size of family households: 255 2-persons, 77 3-persons, 100 4-persons, 67 5-persons, 27 6-persons, 11 7-or-more-persons
Size of nonfamily households: 165 1-person, 12 2-persons
450 married couples with children.
61 single-parent households (2 men, 59 women).
97.9% of residents of 45363 zip code speak English at home.
1.6% of residents speak Spanish at home (100% very well).
0.3% of residents speak other Indo-European language at home (100% very well).
Foreign born population: 6 (0.3%) (100.0% of them are naturalized citizens)
This zip code:
0.3%
Whole state:
5.0%
33%Latvia
17%Bolivia
60%German
16%French
10%American
4%English
2%Irish
2%European
1%Italian
Year of entry for the foreign-born population
02010 or later
42000 to 2009
01990 to 1999
0Before 1990
Housing units lacking complete kitchen facilities: 0.6%
46.0%Utility gas
24.8%Bottled, tank, or LP gas
16.7%Electricity
7.5%Wood
3.5%Fuel oil, kerosene, etc.
1.4%Other fuel
Population in 1990: 911. Population change in the 1990s: +664 (+72.9%).
Place of birth for U.S.-born residents:
This state: 1,736
Midwest: 54
South: 88
66% of the 45363 zip code residents lived in the same house 5 years ago. Out of people who lived in different houses, 61% lived in this county. Out of people who lived in different counties, 50% lived in Ohio.
96% of the 45363 zip code residents lived in the same house 1 year ago. Out of people who lived in different houses, 51% moved from this county. Out of people who lived in different houses, 32% moved from different county within same state. Out of people who lived in different houses, 38% moved from abroad.
Private vs. public school enrollment:
Students in private schools in grades 1 to 8 (elementary and middle school): 3
Here:
2.0%
Ohio:
16.0%
Students in private schools in grades 9 to 12 (high school): 9
Here:
5.8%
Ohio:
13.1%
Students in private undergraduate colleges: 4
Here:
9.5%
Ohio:
22.3%
Occupation by median earnings in the past 12 months ($)
91,619Management occupations
86,764Building and grounds cleaning and maintenance occupations
82,060Installation, maintenance, and repair occupations
72,727Business and financial operations occupations
71,695Health diagnosing and treating practitioners and other technical occupations
71,019Architecture and engineering occupations
Companies with federal contracts located in this zip code:
SUPERIOR ALUMINUM PRODUCTS INC (555 E MAIN ST in RUSSIA, OH) : $9,752 in 2 contractsin 2005
$4,876 with U.S. Army Corps of Engineers - civil program financing only for Plate, Sheet, Strip, and Foil; Nonferrous Base Metal. Signed on 2005-04-15. Completion date: 2005-05-06.
$4,876 with Army for Plate, Sheet, Strip, and Foil; Nonferrous Base Metal. Signed on 2005-04-15. Completion date: 2005-05-06.
Top industries in this zip code by the number of employees in 2005:
Management of Companies and Enterprises: Corporate, Subsidiary, and Regional Managing Offices (20-49 employees: 1 establishment)
Accommodation and Food Services: Full-Service Restaurants (20-49: 1)
Fatal accident statistics in 2014:
Fatal accident count: 1
Vehicles involved in fatal accidents: 2
Fatal accidents caused by drunken drivers: 0
Fatalities: 1
Persons involved in fatal accidents: 2
Pedestrians involved in fatal accidents: 0
Fatal accident statistics in 2012:
Fatal accident count: 1
Vehicles involved in fatal accidents: 1
Fatal accidents caused by drunken drivers: 1
Fatalities: 1
Persons involved in fatal accidents: 1
Pedestrians involved in fatal accidents: 0
2002 - 2018 National Fire Incident Reporting System (NFIRS) incidents
According to the data from the years 2002 - 2018 the average number of fire incidents per year is 11. The highest number of reported fires - 20 took place in 2015, and the least - 3 in 2005. The data has an increasing trend.
When looking into fire subcategories, the most reports belonged to: Structure Fires (52.0%), and Outside Fires (33.5%).
Fire incident types reported to NFIRS in Zip Code 45363


 Nearest zip codes: 45333, 45845, 45388, 45380, 45318, 45308.


 : $9,752 in 2 contracts in 2005


 According to the data from the years 2002 - 2018 the average number of fire incidents per year is 11. The highest number of reported fires - 20 took place in 2015, and the least - 3 in 2005. The data has an increasing trend.
 When looking into fire subcategories, the most reports belonged to: Structure Fires (52.0%), and Outside Fires (33.5%).