Estimated zip code population in 2022: 2,922 Zip code population in 2010: 3,308 Zip code population in 2000: 3,342
Houses and condos: 1,271 Renter-occupied apartments: 289
% of renters here:
26%
State:
29%
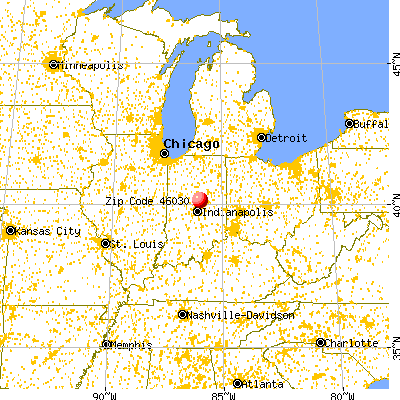
March 2022 cost of living index in zip code 46030: 87.3 (less than average, U.S. average is 100)
Land area: 37.4 sq. mi. Water area: 0.3 sq. mi.
Population density: 78 people per square mile
(very low).
OSM Map
General Map
Google Map
MSN Map
OSM Map
General Map
Google Map
MSN Map
OSM Map
General Map
Google Map
MSN Map
OSM Map
General Map
Google Map
MSN Map
Please wait while loading the map...
Real estate property taxes paid for housing units in 2022:
This zip code:
0.7% ($1,714)
Indiana:
0.7% ($1,467)
Median real estate property taxes paid for housing units with mortgages in 2022: $2,070 (0.7%) Median real estate property taxes paid for housing units with no mortgage in 2022: $1,240 (0.7%)
Estimated median house/condo value in 2022: $251,781
46030:
$251,781
Indiana:
$208,700
Median resident age:
This zip code:
39.5 years
Indiana median age:
38.2 years
Average household size:
This zip code:
2.6 people
Indiana:
2.4 people
Averages for the 2020 tax year for zip code 46030, filed in 2021:
Average Adjusted Gross Income (AGI) in 2020: $68,903 (Individual Income Tax Returns)
Here:
$68,903
State:
$64,978
Salary/wage: $61,108 (reported on 82.9% of returns)
Here:
$61,108
State:
$55,245
(% of AGI for various income ranges: 1122.3% for AGIs below $25k, 3810.7% for AGIs $25k-50k, 6447.1% for AGIs $50k-75k, 9116.7% for AGIs $75k-100k, 17791.4% for AGIs $100k-200k, 53836.7% for AGIs over 200k)
Taxable interest for individuals: $1,095 (reported on 28.3% of returns)
This zip code:
$1,095
Indiana:
$1,351
(% of AGI for various income ranges: 12.3% for AGIs below $25k, 28.6% for AGIs $25k-50k, 21.8% for AGIs $50k-75k, 43.3% for AGIs $75k-100k, 60.7% for AGIs $100k-200k, 600.0% for AGIs over 200k)
Ordinary dividends: $3,770 (reported on 15.1% of returns)
Here:
$3,770
State:
$5,827
(% of AGI for various income ranges: 8.3% for AGIs below $25k, 51.8% for AGIs $25k-50k, 58.8% for AGIs $50k-75k, 78.3% for AGIs $75k-100k, 244.3% for AGIs $100k-200k, 536.7% for AGIs over 200k)
Net capital gain/loss in AGI: +$13,876 (reported on 13.8% of returns)
Here:
+$13,876
State:
+$17,730
(% of AGI for various income ranges: 1.0% for AGIs below $25k, 6.8% for AGIs $25k-50k, 84.7% for AGIs $50k-75k, 125.0% for AGIs $75k-100k, 285.7% for AGIs $100k-200k, 7326.7% for AGIs over 200k)
Profit/loss from business: +$14,533 (reported on 15.8% of returns)
Here:
+$14,533
State:
+$12,144
(% of AGI for various income ranges: 113.3% for AGIs below $25k, 176.4% for AGIs $25k-50k, 94.7% for AGIs $50k-75k, 588.3% for AGIs $75k-100k, 841.4% for AGIs $100k-200k, 2030.0% for AGIs over 200k)
Taxable individual retirement arrangement distribution: $19,750 (reported on 9.2% of returns)
46030:
$19,750
Indiana:
$18,302
(% of AGI for various income ranges: 47.0% for AGIs below $25k, 78.6% for AGIs $25k-50k, 319.4% for AGIs $50k-75k, 1329.3% for AGIs $100k-200k)
Total itemized deductions: $32,290 (reported on 6.6% of returns)
Here:
$32,290
State:
$35,601
(% of AGI for various income ranges: 488.2% for AGIs $50k-75k, 912.9% for AGIs $100k-200k, 3736.7% for AGIs over 200k)
Charity contributions: $8,500 (reported on 5.9% of returns)
Here:
$8,500
State:
$15,596
(% of AGI for various income ranges: 47.9% for AGIs $25k-50k, 238.6% for AGIs $100k-200k, 990.0% for AGIs over 200k)
Taxes paid: $7,336 (reported on 7.2% of returns)
46030:
$7,336
State:
$7,542
(% of AGI for various income ranges: 97.6% for AGIs $50k-75k, 257.1% for AGIs $100k-200k, 936.7% for AGIs over 200k)
Earned income credit: $1,944 (reported on 11.8% of returns)
Here:
$1,944
State:
$2,298
(% of AGI for various income ranges: 67.0% for AGIs below $25k, 53.2% for AGIs $25k-50k)
Percentage of individuals using paid preparers for their 2020 taxes: 92.8%
Here:
93%
State:
94%
(% for various income ranges: 90.9% for AGIs below $25k, 94.4% for AGIs $25k-50k, 91.3% for AGIs $50k-75k, 88.2% for AGIs $75k-100k, 95.8% for AGIs $100k-200k, 100.0% for AGIs over 200k)
Averages for the 2012 tax year for zip code 46030, filed in 2013:
Average Adjusted Gross Income (AGI) in 2012: $55,006 (Individual Income Tax Returns)
Here:
$55,006
State:
$52,932
Salary/wage: $47,927 (reported on 85.5% of returns)
Here:
$47,927
State:
$45,173
(% of AGI for various income ranges: 68.5% for AGIs below $25k, 79.2% for AGIs $25k-50k, 74.9% for AGIs $50k-75k, 79.9% for AGIs $75k-100k, 77.1% for AGIs $100k-200k, 65.9% for AGIs over 200k)
Taxable interest for individuals: $986 (reported on 30.3% of returns)
This zip code:
$986
Indiana:
$1,311
(% of AGI for various income ranges: 0.7% for AGIs below $25k, 0.5% for AGIs $25k-50k, 0.2% for AGIs $50k-75k, 0.2% for AGIs $75k-100k, 0.6% for AGIs $100k-200k, 1.0% for AGIs over 200k)
Ordinary dividends: $2,021 (reported on 16.6% of returns)
Here:
$2,021
State:
$4,690
(% of AGI for various income ranges: 0.7% for AGIs below $25k, 0.6% for AGIs $25k-50k, 0.3% for AGIs $50k-75k, 0.5% for AGIs $75k-100k, 0.4% for AGIs $100k-200k, 1.2% for AGIs over 200k)
Net capital gain/loss in AGI: +$3,340 (reported on 13.8% of returns)
Here:
+$3,340
State:
+$10,406
(% of AGI for various income ranges: 0.2% for AGIs $25k-50k, 1.4% for AGIs $100k-200k, 2.5% for AGIs over 200k)
Profit/loss from business: +$9,420 (reported on 17.2% of returns)
Here:
+$9,420
State:
+$11,105
(% of AGI for various income ranges: 7.7% for AGIs below $25k, 3.4% for AGIs $25k-50k, 5.1% for AGIs $50k-75k, 1.3% for AGIs $75k-100k, 2.9% for AGIs $100k-200k)
Taxable individual retirement arrangement distribution: $10,769 (reported on 11.0% of returns)
46030:
$10,769
Indiana:
$13,841
(% of AGI for various income ranges: 3.0% for AGIs below $25k, 1.7% for AGIs $25k-50k, 4.7% for AGIs $50k-75k, 3.2% for AGIs $100k-200k)
Total itemized deductions: $20,995 (19% of AGI, reported on 29.0% of returns)
Here:
$20,995
State:
$20,913
Here:
19.0% of AGI
State:
18.2% of AGI
(% of AGI for various income ranges: 9.2% for AGIs below $25k, 7.9% for AGIs $25k-50k, 10.1% for AGIs $50k-75k, 11.3% for AGIs $75k-100k, 12.5% for AGIs $100k-200k, 12.8% for AGIs over 200k)
Charity contributions: $4,006 (reported on 23.4% of returns)
Here:
$4,006
State:
$4,697
(% of AGI for various income ranges: 0.9% for AGIs below $25k, 0.9% for AGIs $25k-50k, 1.5% for AGIs $50k-75k, 1.6% for AGIs $75k-100k, 2.3% for AGIs $100k-200k, 2.1% for AGIs over 200k)
Taxes paid: $7,131 (reported on 29.0% of returns)
46030:
$7,131
State:
$7,456
(% of AGI for various income ranges: 1.2% for AGIs below $25k, 1.6% for AGIs $25k-50k, 2.7% for AGIs $50k-75k, 3.7% for AGIs $75k-100k, 4.7% for AGIs $100k-200k, 6.0% for AGIs over 200k)
Earned income credit: $2,119 (reported on 17.9% of returns)
Here:
$2,119
State:
$2,265
(% of AGI for various income ranges: 5.9% for AGIs below $25k, 1.4% for AGIs $25k-50k)
Percentage of individuals using paid preparers for their 2012 taxes: 54.5%
Here:
54%
State:
53%
(% for various income ranges: 44.8% for AGIs below $25k, 54.8% for AGIs $25k-50k, 59.1% for AGIs $50k-75k, 61.5% for AGIs $75k-100k, 64.7% for AGIs $100k-200k, 100.0% for AGIs over 200k)
Averages for the 2004 tax year for zip code 46030, filed in 2005:
Average Adjusted Gross Income (AGI) in 2004: $48,923 (Individual Income Tax Returns)
Here:
$48,923
State:
$44,790
Salary/wage: $40,816 (reported on 88.8% of returns)
Here:
$40,816
State:
$39,615
(% of AGI for various income ranges: 87.5% for AGIs below $10k, 72.3% for AGIs $10k-25k, 79.9% for AGIs $25k-50k, 85.1% for AGIs $50k-75k, 88.9% for AGIs $75k-100k, 56.3% for AGIs over 100k)
Taxable interest for individuals: $1,202 (reported on 42.4% of returns)
This zip code:
$1,202
Indiana:
$1,535
(% of AGI for various income ranges: 6.1% for AGIs below $10k, 2.8% for AGIs $10k-25k, 1.1% for AGIs $25k-50k, 1.2% for AGIs $50k-75k, 0.5% for AGIs $75k-100k, 0.6% for AGIs over 100k)
Taxable dividends: $1,152 (reported on 18.1% of returns)
Here:
$1,152
State:
$2,998
(% of AGI for various income ranges: 2.0% for AGIs below $10k, 1.5% for AGIs $10k-25k, 0.4% for AGIs $25k-50k, 0.2% for AGIs $50k-75k, 0.2% for AGIs $75k-100k, 0.4% for AGIs over 100k)
Net capital gain/loss: +$9,888 (reported on 13.8% of returns)
Here:
+$9,888
State:
+$8,619
(% of AGI for various income ranges: 0.1% for AGIs below $10k, 0.2% for AGIs $10k-25k, 0.7% for AGIs $25k-50k, 0.8% for AGIs $50k-75k, 0.3% for AGIs $75k-100k, 7.1% for AGIs over 100k)
Profit/loss from business: +$10,542 (reported on 16.6% of returns)
Here:
+$10,542
State:
+$10,071
(% of AGI for various income ranges: 2.3% for AGIs below $10k, 6.6% for AGIs $10k-25k, 4.4% for AGIs $25k-50k, 2.9% for AGIs $50k-75k, 4.3% for AGIs $75k-100k, 2.6% for AGIs over 100k)
Profit/loss from farming: +$2,742 (reported on 2.2% of returns)
Here:
+$2,742
State:
-$2,212
IRA payment deduction: $2,185 (reported on 1.9% of returns)
46030:
$2,185
Indiana:
$2,840
Total itemized deductions: $17,220 (19% of AGI, reported on 34.8% of returns)
Here:
$17,220
State:
$17,065
Here:
19.2% of AGI
State:
19.5% of AGI
(% of AGI for various income ranges: 17.0% for AGIs below $10k, 8.8% for AGIs $10k-25k, 10.5% for AGIs $25k-50k, 12.3% for AGIs $50k-75k, 14.3% for AGIs $75k-100k, 12.6% for AGIs over 100k)
Charity contributions deductions: $3,616 (4% of AGI, reported on 28.8% of returns)
Here:
$3,616
State:
$3,550
Here:
3.7% of AGI
State:
3.8% of AGI
(% of AGI for various income ranges: 0.8% for AGIs $10k-25k, 1.6% for AGIs $25k-50k, 1.7% for AGIs $50k-75k, 1.8% for AGIs $75k-100k, 3.2% for AGIs over 100k)
Total tax: $7,391 (reported on 77.1% of returns)
46030:
$7,391
State:
$6,914
(% of AGI for various income ranges: 1.9% for AGIs below $10k, 4.2% for AGIs $10k-25k, 7.0% for AGIs $25k-50k, 8.8% for AGIs $50k-75k, 10.1% for AGIs $75k-100k, 18.7% for AGIs over 100k)
Earned income credit: $1,673 (reported on 10.8% of returns)
Here:
$1,673
State:
$1,685
Percentage of individuals using paid preparers for their 2004 taxes: 58.6%
Here:
59%
State:
59%
(% for various income ranges: 46.0% for AGIs below $10k, 57.0% for AGIs $10k-25k, 63.8% for AGIs $25k-50k, 63.1% for AGIs $50k-75k, 57.3% for AGIs $75k-100k, 70.2% for AGIs over 100k)
Household received Food Stamps/SNAP in the past 12 months: 63 Household did not receive Food Stamps/SNAP in the past 12 months: 1,066
Women who had a birth in the past 12 months: 3 (3 now married, 0 unmarried) Women who did not have a birth in the past 12 months: 753 (370 now married, 384 unmarried)
Housing units in zip code 46030 with a mortgage: 603 (75 second mortgage, 63 both second mortgage and home equity loan) Houses without a mortgage: 31
Median monthly owner costs for units with a mortgage: $1,481 Median monthly owner costs for units without a mortgage: $471
Residents with income below the poverty level in 2022:
This zip code:
13.4%
Whole state:
12.6%
Residents with income below 50% of the poverty level in 2022:
This zip code:
10.6%
Whole state:
6.3%
Median number of rooms in houses and condos:
Here:
7.1
State:
6.6
Median number of rooms in apartments:
Here:
4.7
State:
4.3
Notable locations in this zip code not listed on our city pages
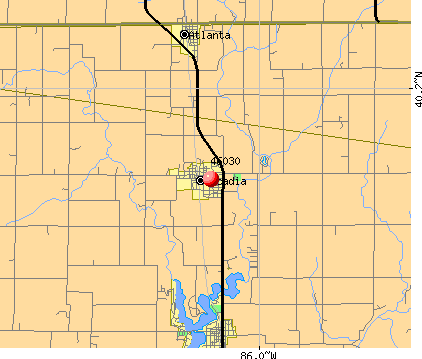
Notable locations in zip code 46030: Arcadia Public Library (A), Arcadia Town Hall (B), Jackson Township Fire Department Arcadia Station (C). Display/hide their locations on the map
Churches in zip code 46030 include: Harveys Chapel (A), Arcadia Christian Church (B), Emanuel Lutheran Church (C), Church of the Brethren (D), Salem Church (E). Display/hide their locations on the map
Cemeteries: Scherer Cemetery (1), Dunn Cemetery (2), Phillips Cemetery (3), Brethren Cemetery (4), Emmanuel Lutheran Cemetery (5), Buscher Cemetery (6), Taylor Cemetery (7). Display/hide their locations on the map
In group quarters: 13 (-1 institutionalized population)
Size of family households: 498 2-persons, 133 3-persons, 69 4-persons, 212 5-persons, 11 6-persons
Size of nonfamily households: 180 1-person, 15 2-persons, 10 4-persons
586 married couples with children.
97 single-parent households (10 men, 87 women).
90.7% of residents of 46030 zip code speak English at home.
8.3% of residents speak Spanish at home (55% very well, 20% well, 25% not well).
Foreign born population: 178 (6.1%) (99.4% of them are naturalized citizens)
This zip code:
6.1%
Whole state:
6.1%
66%Honduras
17%Romania
1%Belgium
30%German
15%American
8%French
7%English
3%European
2%Russian
2%Irish
Year of entry for the foreign-born population
132010 or later
1402000 to 2009
111990 to 1999
1Before 1990
Facilities with environmental interests located in this zip code:
HAMILTON HEIGHTS SCHOOL BUS GARAGE & HIGH SCHOOL (25802 SR 19 in ARCADIA, IN)
STATE MASTER (Indiana facility tracking) - CRTK-19015, EPCRA, UST-19239, UNDERGROUND STORAGE TANK PROGRAM (National Center for Education Statistics) - STATE ID-2477 Organizations: HAMILTON HEIGHTS SCHOOL CORP (SCHOOL DISTRICT)
HAMILTON HEIGHTS JR HIGH (420 W NORTH ST in ARCADIA, IN)
(Integrated Compliance Information System) - ICIS-05-1986-0458, FORMAL ENFORCEMENT ACTION STATE MASTER (Indiana facility tracking) - CRTK-8640, EPCRA Business SIC classification: ELEMENTARY AND SECONDARY SCHOOLS Alternative names: HAMILTON HEIGHTS SCHOOL CORP
ARCADIA WWTP (9099 E 266TH ST in ARCADIA, IN)
STATE MASTER (Indiana facility tracking) - CRTK-1563, EPCRA National Pollutant Discharge Elimination System NON-MAJOR (Tracking pollutant discharge elimination systems) - permit Business SIC classification: SEWERAGE SYSTEMS Organizations: KENNETH KEESEE #13021 (CONTACT/OPERATOR)
, TOWN COUNCIL PRESIDENT (CONTACT/OWNER)
Alternative names: ARCADIA MUNICIPAL STP, TOWN OF ARCADIA STP
HAMILTON HEIGHTS COMM SCH CORP (25502 STATE RD 19 PO BOX 469 in ARCADIA, IN)
(Integrated Compliance Information System) - ICIS-05-1994-0289, FORMAL ENFORCEMENT ACTION STATE MASTER (Indiana facility tracking) COMPLIANCE ACTIVITY (Tracking inspections of insecticide, fungicide, and rodenticide, and toxic substances)
HAMILTON HEIGHTS ELEM SCHOOL (25150 SR 19 - PO BOX 400 in ARCADIA, IN)
(National Center for Education Statistics) - STATE ID-2478 Organizations: HAMILTON HEIGHTS SCHOOL CORP (SCHOOL DISTRICT)
HAMILTON HEIGHTS MIDDLE SCH (420 W NORTH ST - PO BOX 609 in ARCADIA, IN)
(National Center for Education Statistics) - STATE ID-2501 Organizations: HAMILTON HEIGHTS SCHOOL CORP (SCHOOL DISTRICT)
HAMILTON HEIGHTS PRIMARY SCHOOL (25350 SR 19 in ARCADIA, IN)
(National Center for Education Statistics) - STATE ID-2502 Organizations: HAMILTON HEIGHTS SCHOOL CORP (SCHOOL DISTRICT)
MOORES COUNTRY WOODWORKING (115 W MAIN ST in ARCADIA, IN)
STATE MASTER (Indiana facility tracking) Conditionally Exempt Small Quantity Generators, less than 100 kg/month of hazardous waste (Resource Conservation and Recovery Act (tracking hazardous waste)) - notification Organizations: WILLIAMS PAT (CONTACT/OWNER)
HAMILTON COUNTY COOP (W BROADWAY in ARCADIA, IN)
AIR MAJOR (AIRS/AFS) STATE MASTER (Indiana facility tracking) Business SIC classification: GRAIN AND FIELD BEANS
Housing units lacking complete plumbing facilities: 5.1% Housing units lacking complete kitchen facilities: 5.4%
33.8%Utility gas
33.4%Electricity
15.6%Bottled, tank, or LP gas
13.7%No fuel used
1.9%Fuel oil, kerosene, etc.
1.4%Wood
0.5%Solar energy
Population in 1990: 4,137.
Place of birth for U.S.-born residents:
This state: 2,021
Northeast: 54
Midwest: 468
South: 165
West: 35
68% of the 46030 zip code residents lived in the same house 5 years ago. Out of people who lived in different houses, 63% lived in this county. Out of people who lived in different counties, 50% lived in Indiana.
98% of the 46030 zip code residents lived in the same house 1 year ago. Out of people who lived in different houses, 93% moved from this county. Out of people who lived in different houses, 18% moved from different county within same state. Out of people who lived in different houses, 7% moved from different state.
Private vs. public school enrollment:
Students in private schools in grades 1 to 8 (elementary and middle school): 109
Here:
39.4%
Indiana:
14.9%
Students in private schools in grades 9 to 12 (high school): 13
Here:
3.8%
Indiana:
11.4%
Students in private undergraduate colleges: 1
Here:
1.0%
Indiana:
22.3%
Occupation by median earnings in the past 12 months ($)
236,640Arts, design, entertainment, sports, and media occupations
112,871Management occupations
94,051Health diagnosing and treating practitioners and other technical occupations
65,706Business and financial operations occupations
52,620Construction and extraction occupations
49,848Transportation occupations
Companies with federal contracts located in this zip code:
FIREHOUSE TRAINING & CONSULTIN (6651 E 256TH STREET in ARCADIA, IN)
$4,500 with Army for Other Education and Training Services. Taking place in MA. Signed on 2004-12-22. Completion date: 2005-02-09.
Top industries in this zip code by the number of employees in 2005:
Health Care and Social Assistance: Nursing Care Facilities (100-249 employees: 1 establishment)
Health Care and Social Assistance: Residential Mental Retardation Facilities (10-19: 1, 5-9: 1)
Construction: Poured Concrete Foundation and Structure Contractors (10-19: 1)
Administrative and Support and Waste Management and Remediation Services: Landscaping Services (5-9: 1, 1-4: 2)
Other Services (except Public Administration): Labor Unions and Similar Labor Organizations (5-9: 1, 1-4: 1)
Administrative and Support and Waste Management and Remediation Services: Carpet and Upholstery Cleaning Services (5-9: 1)
People in group quarters in 2010:
60 people in nursing facilities/skilled-nursing facilities
7 people in group homes intended for adults
People in group quarters in 2000:
131 people in homes for the mentally retarded
60 people in schools, hospitals, or wards for the intellectually disabled
4 people in training schools for juvenile delinquents
Fatal accident statistics in 2014:
Fatal accident count: 1
Vehicles involved in fatal accidents: 2
Fatal accidents caused by drunken drivers: 1
Fatalities: 1
Persons involved in fatal accidents: 2
Pedestrians involved in fatal accidents: 0
Fatal accident statistics in 2013:
Fatal accident count: 2
Vehicles involved in fatal accidents: 2
Fatal accidents caused by drunken drivers: 0
Fatalities: 2
Persons involved in fatal accidents: 2
Pedestrians involved in fatal accidents: 0
Home Mortgage Disclosure Act Aggregated Statistics For Year 2009 (Based on 6 partial tracts)
A) FHA, FSA/RHS & VA Home Purchase Loans
B) Conventional Home Purchase Loans
C) Refinancings
D) Home Improvement Loans
F) Non-occupant Loans on < 5 Family Dwellings (A B C & D)
G) Loans On Manufactured Home Dwelling (A B C & D)
Number
Average Value
Number
Average Value
Number
Average Value
Number
Average Value
Number
Average Value
Number
Average Value
LOANS ORIGINATED
101
$135,547
43
$146,829
240
$171,778
8
$86,179
17
$135,474
6
$96,893
APPLICATIONS APPROVED, NOT ACCEPTED
5
$162,236
6
$192,457
24
$231,715
1
$18,290
3
$152,080
1
$32,860
APPLICATIONS DENIED
17
$134,038
9
$110,439
80
$187,192
9
$86,159
4
$88,145
5
$61,708
APPLICATIONS WITHDRAWN
25
$141,000
5
$174,898
57
$178,126
1
$131,140
3
$170,653
2
$97,470
FILES CLOSED FOR INCOMPLETENESS
4
$144,248
0
$0
12
$244,628
1
$118,840
1
$74,180
0
$0
Aggregated Statistics For Year 2008 (Based on 6 partial tracts)
A) FHA, FSA/RHS & VA Home Purchase Loans
B) Conventional Home Purchase Loans
C) Refinancings
D) Home Improvement Loans
F) Non-occupant Loans on < 5 Family Dwellings (A B C & D)
G) Loans On Manufactured Home Dwelling (A B C & D)
Number
Average Value
Number
Average Value
Number
Average Value
Number
Average Value
Number
Average Value
Number
Average Value
LOANS ORIGINATED
80
$128,476
74
$178,658
149
$181,414
14
$49,166
22
$112,829
6
$83,487
APPLICATIONS APPROVED, NOT ACCEPTED
5
$116,698
10
$225,689
18
$164,687
2
$23,230
2
$75,910
2
$60,970
APPLICATIONS DENIED
18
$134,332
21
$153,980
98
$154,446
16
$53,036
6
$145,852
9
$55,411
APPLICATIONS WITHDRAWN
14
$147,972
12
$179,556
42
$165,560
2
$132,380
3
$109,630
0
$0
FILES CLOSED FOR INCOMPLETENESS
1
$219,270
4
$267,480
6
$138,550
2
$38,715
1
$86,210
0
$0
Aggregated Statistics For Year 2007 (Based on 6 partial tracts)
A) FHA, FSA/RHS & VA Home Purchase Loans
B) Conventional Home Purchase Loans
C) Refinancings
D) Home Improvement Loans
E) Loans on Dwellings For 5+ Families
F) Non-occupant Loans on < 5 Family Dwellings (A B C & D)
G) Loans On Manufactured Home Dwelling (A B C & D)
Number
Average Value
Number
Average Value
Number
Average Value
Number
Average Value
Number
Average Value
Number
Average Value
Number
Average Value
LOANS ORIGINATED
34
$131,007
156
$146,824
154
$159,590
21
$89,123
1
$2,577,470
32
$112,009
10
$67,299
APPLICATIONS APPROVED, NOT ACCEPTED
2
$136,960
20
$150,051
29
$139,577
7
$75,680
0
$0
4
$76,170
2
$71,570
APPLICATIONS DENIED
8
$117,116
32
$170,719
126
$149,054
31
$52,145
0
$0
7
$119,450
9
$67,271
APPLICATIONS WITHDRAWN
4
$137,365
25
$148,043
51
$155,475
5
$50,314
0
$0
4
$128,532
0
$0
FILES CLOSED FOR INCOMPLETENESS
1
$124,890
7
$160,744
17
$164,426
0
$0
0
$0
1
$109,170
0
$0
Aggregated Statistics For Year 2006 (Based on 6 partial tracts)
A) FHA, FSA/RHS & VA Home Purchase Loans
B) Conventional Home Purchase Loans
C) Refinancings
D) Home Improvement Loans
E) Loans on Dwellings For 5+ Families
F) Non-occupant Loans on < 5 Family Dwellings (A B C & D)
G) Loans On Manufactured Home Dwelling (A B C & D)
Number
Average Value
Number
Average Value
Number
Average Value
Number
Average Value
Number
Average Value
Number
Average Value
Number
Average Value
LOANS ORIGINATED
35
$130,173
181
$124,416
170
$155,289
30
$44,144
1
$26,760
44
$103,811
12
$71,822
APPLICATIONS APPROVED, NOT ACCEPTED
1
$146,370
21
$115,815
24
$126,167
4
$24,495
0
$0
3
$85,277
4
$46,888
APPLICATIONS DENIED
4
$128,925
40
$137,025
131
$126,954
25
$46,196
0
$0
15
$107,973
13
$77,258
APPLICATIONS WITHDRAWN
5
$131,906
31
$136,930
60
$145,060
4
$52,562
0
$0
6
$111,005
1
$33,700
FILES CLOSED FOR INCOMPLETENESS
1
$149,340
6
$182,487
27
$175,337
0
$0
0
$0
0
$0
0
$0
Aggregated Statistics For Year 2005 (Based on 6 partial tracts)
A) FHA, FSA/RHS & VA Home Purchase Loans
B) Conventional Home Purchase Loans
C) Refinancings
D) Home Improvement Loans
F) Non-occupant Loans on < 5 Family Dwellings (A B C & D)
G) Loans On Manufactured Home Dwelling (A B C & D)
Number
Average Value
Number
Average Value
Number
Average Value
Number
Average Value
Number
Average Value
Number
Average Value
LOANS ORIGINATED
28
$121,302
175
$134,821
215
$143,610
28
$92,463
28
$97,844
16
$69,681
APPLICATIONS APPROVED, NOT ACCEPTED
1
$142,060
18
$139,562
23
$133,272
5
$76,646
2
$130,400
4
$82,945
APPLICATIONS DENIED
4
$110,582
42
$122,619
140
$119,160
31
$45,644
12
$96,782
18
$63,016
APPLICATIONS WITHDRAWN
3
$104,477
25
$144,176
72
$136,979
13
$153,554
1
$52,070
1
$62,570
FILES CLOSED FOR INCOMPLETENESS
0
$0
9
$165,649
55
$159,209
0
$0
2
$283,255
2
$60,135
Aggregated Statistics For Year 2004 (Based on 6 partial tracts)
A) FHA, FSA/RHS & VA Home Purchase Loans
B) Conventional Home Purchase Loans
C) Refinancings
D) Home Improvement Loans
F) Non-occupant Loans on < 5 Family Dwellings (A B C & D)
G) Loans On Manufactured Home Dwelling (A B C & D)
Number
Average Value
Number
Average Value
Number
Average Value
Number
Average Value
Number
Average Value
Number
Average Value
LOANS ORIGINATED
35
$114,447
156
$137,446
259
$137,352
19
$74,978
29
$108,183
9
$76,259
APPLICATIONS APPROVED, NOT ACCEPTED
1
$87,440
19
$115,756
33
$125,272
6
$65,823
5
$72,434
3
$99,307
APPLICATIONS DENIED
4
$139,848
32
$100,945
120
$110,441
20
$53,262
7
$106,546
15
$55,029
APPLICATIONS WITHDRAWN
4
$151,935
14
$132,917
76
$139,520
5
$65,176
5
$106,188
4
$65,742
FILES CLOSED FOR INCOMPLETENESS
0
$0
5
$113,288
35
$127,835
1
$34,820
1
$101,340
2
$73,250
Aggregated Statistics For Year 2003 (Based on 6 partial tracts)
A) FHA, FSA/RHS & VA Home Purchase Loans
B) Conventional Home Purchase Loans
C) Refinancings
D) Home Improvement Loans
F) Non-occupant Loans on < 5 Family Dwellings (A B C & D)
Number
Average Value
Number
Average Value
Number
Average Value
Number
Average Value
Number
Average Value
LOANS ORIGINATED
36
$121,889
104
$152,678
521
$132,011
23
$18,290
30
$106,710
APPLICATIONS APPROVED, NOT ACCEPTED
2
$138,560
10
$156,816
58
$118,204
5
$13,576
3
$189,353
APPLICATIONS DENIED
4
$100,785
13
$101,241
148
$118,177
14
$27,874
5
$83,872
APPLICATIONS WITHDRAWN
2
$129,635
7
$162,296
76
$122,388
3
$25,657
4
$166,098
FILES CLOSED FOR INCOMPLETENESS
1
$71,790
4
$85,870
28
$144,453
1
$34,320
2
$62,345
Aggregated Statistics For Year 2002 (Based on 6 partial tracts)
A) FHA, FSA/RHS & VA Home Purchase Loans
B) Conventional Home Purchase Loans
C) Refinancings
D) Home Improvement Loans
F) Non-occupant Loans on < 5 Family Dwellings (A B C & D)
Number
Average Value
Number
Average Value
Number
Average Value
Number
Average Value
Number
Average Value
LOANS ORIGINATED
57
$122,009
103
$138,747
403
$130,080
19
$23,129
25
$93,351
APPLICATIONS APPROVED, NOT ACCEPTED
2
$95,445
10
$156,896
58
$125,318
3
$42,563
0
$0
APPLICATIONS DENIED
3
$105,567
23
$60,737
101
$120,441
13
$15,882
3
$66,213
APPLICATIONS WITHDRAWN
3
$110,667
10
$168,296
43
$134,070
6
$15,687
1
$194,500
FILES CLOSED FOR INCOMPLETENESS
1
$117,730
4
$107,832
31
$128,753
1
$58,880
1
$98,590
Aggregated Statistics For Year 2001 (Based on 6 partial tracts)
A) FHA, FSA/RHS & VA Home Purchase Loans
B) Conventional Home Purchase Loans
C) Refinancings
D) Home Improvement Loans
F) Non-occupant Loans on < 5 Family Dwellings (A B C & D)
Number
Average Value
Number
Average Value
Number
Average Value
Number
Average Value
Number
Average Value
LOANS ORIGINATED
54
$116,959
91
$130,434
312
$120,023
37
$27,261
19
$111,010
APPLICATIONS APPROVED, NOT ACCEPTED
0
$0
11
$122,464
33
$118,296
4
$18,782
0
$0
APPLICATIONS DENIED
2
$92,710
18
$69,376
98
$100,298
15
$17,255
1
$100,470
APPLICATIONS WITHDRAWN
5
$99,110
11
$114,743
53
$108,194
3
$21,050
4
$73,968
FILES CLOSED FOR INCOMPLETENESS
0
$0
2
$78,495
28
$111,308
0
$0
1
$65,260
Aggregated Statistics For Year 2000 (Based on 6 partial tracts)
A) FHA, FSA/RHS & VA Home Purchase Loans
B) Conventional Home Purchase Loans
C) Refinancings
D) Home Improvement Loans
F) Non-occupant Loans on < 5 Family Dwellings (A B C & D)
Number
Average Value
Number
Average Value
Number
Average Value
Number
Average Value
Number
Average Value
LOANS ORIGINATED
23
$107,774
84
$129,920
103
$94,830
45
$19,179
6
$75,757
APPLICATIONS APPROVED, NOT ACCEPTED
0
$0
20
$96,436
31
$91,125
9
$20,050
2
$56,700
APPLICATIONS DENIED
2
$80,940
34
$58,595
80
$82,412
24
$29,270
1
$25,450
APPLICATIONS WITHDRAWN
1
$145,200
4
$98,965
35
$86,545
4
$35,412
0
$0
FILES CLOSED FOR INCOMPLETENESS
0
$0
1
$41,120
20
$90,760
1
$26,680
0
$0
Aggregated Statistics For Year 1999 (Based on 3 partial tracts)
A) FHA, FSA/RHS & VA Home Purchase Loans
B) Conventional Home Purchase Loans
C) Refinancings
D) Home Improvement Loans
F) Non-occupant Loans on < 5 Family Dwellings (A B C & D)
2002 - 2018 National Fire Incident Reporting System (NFIRS) incidents
Based on the data from the years 2002 - 2018 the average number of fires per year is 17. The highest number of fires - 36 took place in 2005, and the least - 1 in 2014. The data has a declining trend.
When looking into fire subcategories, the most reports belonged to: Outside Fires (37.0%), and Structure Fires (35.7%).
Fire incident types reported to NFIRS in Zip Code 46030


+$2,742
-$2,212
 Nearest zip codes: 46031, 46034, 46062, 46047, 46072, 46060.


 Based on the data from the years 2002 - 2018 the average number of fires per year is 17. The highest number of fires - 36 took place in 2005, and the least - 1 in 2014. The data has a declining trend.
 When looking into fire subcategories, the most reports belonged to: Outside Fires (37.0%), and Structure Fires (35.7%).