Estimated zip code population in 2022: 2,809 Zip code population in 2010: 2,621 Zip code population in 2000: 2,669
Houses and condos: 2,295 Renter-occupied apartments: 291
% of renters here:
22%
State:
27%
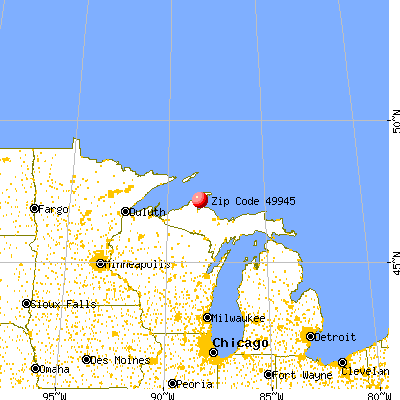
March 2022 cost of living index in zip code 49945: 74.5 (low, U.S. average is 100)
Land area: 165.9 sq. mi. Water area: 16.9 sq. mi.
Population density: 17 people per square mile
(very low).
OSM Map
General Map
Google Map
MSN Map
OSM Map
General Map
Google Map
MSN Map
OSM Map
General Map
Google Map
MSN Map
OSM Map
General Map
Google Map
MSN Map
Please wait while loading the map...
Real estate property taxes paid for housing units in 2022:
This zip code:
1.3% ($1,743)
Michigan:
1.2% ($2,746)
Median real estate property taxes paid for housing units with mortgages in 2022: $1,928 (1.1%) Median real estate property taxes paid for housing units with no mortgage in 2022: $1,623 (1.5%)
Business Search- 14 Million verified businesses
Males: 1,456
(51.9%)
Females: 1,352
(48.1%)
For population 25 years and over in 49945:
High school or higher: 93.9%
Bachelor's degree or higher: 26.8%
Graduate or professional degree: 9.9%
Unemployed: 5.2%
Mean travel time to work (commute): 18.8 minutes
For population 15 years and over in 49945:
Never married: 28.9%
Now married: 53.8%
Separated: 0.3%
Widowed: 7.5%
Divorced: 9.5%
Zip code 49945 compared to state average:
Median house value below state average.
Black race population percentage significantly below state average.
Hispanic race population percentage significantly below state average.
Median age above state average.
Foreign-born population percentage significantly below state average.
Length of stay since moving in significantly above state average.
Estimated median house/condo value in 2022: $134,796
49945:
$134,796
Michigan:
$224,400
According to our research of Michigan and other state lists, there were 6 registered sex offenders living in 49945 zip code as of June 16, 2024. The ratio of all residents to sex offenders in zip code 49945 is 446 to 1. The ratio of registered sex offenders to all residents in this zip code is lower than the state average.
Median resident age:
This zip code:
47.6 years
Michigan median age:
40.3 years
Average household size:
This zip code:
2.1 people
Michigan:
2.4 people
Averages for the 2020 tax year for zip code 49945, filed in 2021:
Average Adjusted Gross Income (AGI) in 2020: $51,593 (Individual Income Tax Returns)
Here:
$51,593
State:
$68,945
Salary/wage: $43,651 (reported on 72.2% of returns)
Here:
$43,651
State:
$57,142
(% of AGI for various income ranges: 1032.6% for AGIs below $25k, 3074.1% for AGIs $25k-50k, 5085.0% for AGIs $50k-75k, 8658.6% for AGIs $75k-100k, 12914.4% for AGIs $100k-200k)
Taxable interest for individuals: $588 (reported on 37.6% of returns)
This zip code:
$588
Michigan:
$1,630
(% of AGI for various income ranges: 19.4% for AGIs below $25k, 13.3% for AGIs $25k-50k, 13.6% for AGIs $50k-75k, 34.3% for AGIs $75k-100k, 172.2% for AGIs $100k-200k)
Ordinary dividends: $3,717 (reported on 21.8% of returns)
Here:
$3,717
State:
$6,972
(% of AGI for various income ranges: 37.7% for AGIs below $25k, 41.9% for AGIs $25k-50k, 100.0% for AGIs $50k-75k, 184.3% for AGIs $75k-100k, 643.3% for AGIs $100k-200k)
Net capital gain/loss in AGI: +$5,844 (reported on 18.8% of returns)
Here:
+$5,844
State:
+$20,064
(% of AGI for various income ranges: 19.0% for AGIs below $25k, 41.9% for AGIs $25k-50k, 101.4% for AGIs $50k-75k, 215.7% for AGIs $75k-100k, 1106.7% for AGIs $100k-200k)
Profit/loss from business: +$7,541 (reported on 12.8% of returns)
Here:
+$7,541
State:
+$11,172
(% of AGI for various income ranges: 63.5% for AGIs below $25k, 121.9% for AGIs $25k-50k, 298.6% for AGIs $50k-75k, 375.6% for AGIs $100k-200k)
Taxable individual retirement arrangement distribution: $17,584 (reported on 14.3% of returns)
49945:
$17,584
Michigan:
$19,803
(% of AGI for various income ranges: 102.9% for AGIs below $25k, 172.6% for AGIs $25k-50k, 315.0% for AGIs $50k-75k, 711.4% for AGIs $75k-100k, 1796.7% for AGIs $100k-200k)
Total itemized deductions: $26,575 (reported on 3.0% of returns)
Here:
$26,575
State:
$34,117
(% of AGI for various income ranges: 759.3% for AGIs $50k-75k)
Taxes paid: $5,375 (reported on 3.0% of returns)
49945:
$5,375
State:
$7,972
(% of AGI for various income ranges: 153.6% for AGIs $50k-75k)
Earned income credit: $2,267 (reported on 13.5% of returns)
Here:
$2,267
State:
$2,251
(% of AGI for various income ranges: 77.7% for AGIs below $25k, 61.9% for AGIs $25k-50k)
Percentage of individuals using paid preparers for their 2020 taxes: 91.7%
Here:
92%
State:
93%
(% for various income ranges: 91.7% for AGIs below $25k, 89.2% for AGIs $25k-50k, 89.5% for AGIs $50k-75k, 100.0% for AGIs $75k-100k, 93.3% for AGIs $100k-200k, 100.0% for AGIs over 200k)
Averages for the 2012 tax year for zip code 49945, filed in 2013:
Average Adjusted Gross Income (AGI) in 2012: $43,935 (Individual Income Tax Returns)
Here:
$43,935
State:
$55,609
Salary/wage: $36,837 (reported on 76.7% of returns)
Here:
$36,837
State:
$46,782
(% of AGI for various income ranges: 62.8% for AGIs below $25k, 62.7% for AGIs $25k-50k, 65.4% for AGIs $50k-75k, 63.5% for AGIs $75k-100k, 65.8% for AGIs $100k-200k)
Taxable interest for individuals: $838 (reported on 48.3% of returns)
This zip code:
$838
Michigan:
$1,491
(% of AGI for various income ranges: 1.7% for AGIs below $25k, 1.2% for AGIs $25k-50k, 0.7% for AGIs $50k-75k, 0.9% for AGIs $75k-100k, 0.6% for AGIs $100k-200k)
Ordinary dividends: $2,710 (reported on 25.0% of returns)
Here:
$2,710
State:
$6,225
(% of AGI for various income ranges: 1.9% for AGIs below $25k, 1.6% for AGIs $25k-50k, 1.2% for AGIs $50k-75k, 2.0% for AGIs $75k-100k, 1.4% for AGIs $100k-200k)
Net capital gain/loss in AGI: +$2,544 (reported on 15.5% of returns)
Here:
+$2,544
State:
+$9,326
(% of AGI for various income ranges: 0.5% for AGIs $25k-50k, 0.2% for AGIs $50k-75k, 0.9% for AGIs $75k-100k, 2.5% for AGIs $100k-200k)
Profit/loss from business: +$7,436 (reported on 12.1% of returns)
Here:
+$7,436
State:
+$11,523
(% of AGI for various income ranges: 2.3% for AGIs below $25k, 2.4% for AGIs $25k-50k, 2.3% for AGIs $50k-75k, 4.4% for AGIs $75k-100k)
Taxable individual retirement arrangement distribution: $10,790 (reported on 18.1% of returns)
49945:
$10,790
Michigan:
$15,298
(% of AGI for various income ranges: 7.3% for AGIs below $25k, 5.1% for AGIs $25k-50k, 3.0% for AGIs $50k-75k, 3.3% for AGIs $75k-100k, 4.6% for AGIs $100k-200k)
Total itemized deductions: $20,328 (20% of AGI, reported on 15.5% of returns)
Here:
$20,328
State:
$21,628
Here:
20.4% of AGI
State:
18.4% of AGI
(% of AGI for various income ranges: 5.3% for AGIs below $25k, 4.3% for AGIs $25k-50k, 6.2% for AGIs $50k-75k, 7.4% for AGIs $75k-100k, 10.8% for AGIs $100k-200k)
Charity contributions: $2,450 (reported on 12.1% of returns)
Here:
$2,450
State:
$4,225
(% of AGI for various income ranges: 0.5% for AGIs $25k-50k, 0.5% for AGIs $50k-75k, 0.5% for AGIs $75k-100k, 1.3% for AGIs $100k-200k)
Taxes paid: $7,078 (reported on 15.5% of returns)
49945:
$7,078
State:
$8,327
(% of AGI for various income ranges: 0.7% for AGIs below $25k, 1.1% for AGIs $25k-50k, 1.7% for AGIs $50k-75k, 2.5% for AGIs $75k-100k, 5.0% for AGIs $100k-200k)
Earned income credit: $1,891 (reported on 19.0% of returns)
Here:
$1,891
State:
$2,306
(% of AGI for various income ranges: 5.1% for AGIs below $25k, 1.0% for AGIs $25k-50k)
Percentage of individuals using paid preparers for their 2012 taxes: 51.7%
Here:
52%
State:
57%
(% for various income ranges: 48.0% for AGIs below $25k, 51.7% for AGIs $25k-50k, 52.6% for AGIs $50k-75k, 60.0% for AGIs $75k-100k, 62.5% for AGIs $100k-200k)
Averages for the 2004 tax year for zip code 49945, filed in 2005:
Average Adjusted Gross Income (AGI) in 2004: $33,054 (Individual Income Tax Returns)
Here:
$33,054
State:
$48,204
Salary/wage: $28,159 (reported on 80.0% of returns)
Here:
$28,159
State:
$42,791
(% of AGI for various income ranges: 110.5% for AGIs below $10k, 63.8% for AGIs $10k-25k, 70.9% for AGIs $25k-50k, 73.0% for AGIs $50k-75k, 77.1% for AGIs $75k-100k, 46.5% for AGIs over 100k)
Taxable interest for individuals: $1,438 (reported on 57.8% of returns)
This zip code:
$1,438
Michigan:
$1,725
(% of AGI for various income ranges: 7.2% for AGIs below $10k, 3.0% for AGIs $10k-25k, 2.6% for AGIs $25k-50k, 1.2% for AGIs $50k-75k, 1.0% for AGIs $75k-100k, 4.2% for AGIs over 100k)
Taxable dividends: $2,161 (reported on 27.5% of returns)
Here:
$2,161
State:
$3,420
(% of AGI for various income ranges: 3.8% for AGIs below $10k, 2.4% for AGIs $10k-25k, 1.8% for AGIs $25k-50k, 1.9% for AGIs $50k-75k, 0.5% for AGIs $75k-100k, 1.9% for AGIs over 100k)
Net capital gain/loss: +$2,872 (reported on 19.3% of returns)
Here:
+$2,872
State:
+$8,532
(% of AGI for various income ranges: 0.5% for AGIs below $10k, -0.4% for AGIs $10k-25k, 1.9% for AGIs $25k-50k, 0.3% for AGIs $50k-75k, 0.6% for AGIs $75k-100k, 5.9% for AGIs over 100k)
Profit/loss from business: +$8,727 (reported on 14.1% of returns)
Here:
+$8,727
State:
+$9,547
(% of AGI for various income ranges: 6.8% for AGIs below $10k, 4.1% for AGIs $10k-25k, 2.6% for AGIs $25k-50k, 2.3% for AGIs $50k-75k, 3.3% for AGIs $75k-100k, 6.8% for AGIs over 100k)
IRA payment deduction: $2,944 (reported on 3.0% of returns)
49945:
$2,944
Michigan:
$2,875
Total itemized deductions: $14,117 (19% of AGI, reported on 14.7% of returns)
Here:
$14,117
State:
$18,509
Here:
19.1% of AGI
State:
20.7% of AGI
(% of AGI for various income ranges: 18.3% for AGIs below $10k, 5.2% for AGIs $10k-25k, 6.3% for AGIs $25k-50k, 5.2% for AGIs $50k-75k, 8.5% for AGIs $75k-100k, 4.9% for AGIs over 100k)
Charity contributions deductions: $1,819 (2% of AGI, reported on 13.2% of returns)
Here:
$1,819
State:
$3,365
Here:
2.3% of AGI
State:
3.6% of AGI
(% of AGI for various income ranges: 1.0% for AGIs $10k-25k, 0.9% for AGIs $25k-50k, 0.3% for AGIs $50k-75k, 1.0% for AGIs $75k-100k, 0.7% for AGIs over 100k)
Total tax: $3,960 (reported on 69.4% of returns)
49945:
$3,960
State:
$7,691
(% of AGI for various income ranges: 2.5% for AGIs below $10k, 3.8% for AGIs $10k-25k, 6.2% for AGIs $25k-50k, 8.4% for AGIs $50k-75k, 10.9% for AGIs $75k-100k, 13.7% for AGIs over 100k)
Earned income credit: $1,471 (reported on 15.5% of returns)
Here:
$1,471
State:
$1,737
Percentage of individuals using paid preparers for their 2004 taxes: 51.4%
Here:
51%
State:
60%
(% for various income ranges: 45.0% for AGIs below $10k, 49.4% for AGIs $10k-25k, 57.9% for AGIs $25k-50k, 47.9% for AGIs $50k-75k, 60.0% for AGIs $75k-100k, 78.8% for AGIs over 100k)
Likely homosexual households (counted as self-reported same-sex unmarried-partner households)
Lesbian couples: 0.3% of all households
Gay men: 0.0% of all households
Household received Food Stamps/SNAP in the past 12 months: 145 Household did not receive Food Stamps/SNAP in the past 12 months: 1,169
Women who had a birth in the past 12 months: 17 (8 now married, 8 unmarried) Women who did not have a birth in the past 12 months: 508 (244 now married, 263 unmarried)
Housing units in zip code 49945 with a mortgage: 437 (80 second mortgage, 66 both second mortgage and home equity loan) Median monthly owner costs for units with a mortgage: $1,154 Median monthly owner costs for units without a mortgage: $494
Residents with income below the poverty level in 2022:
This zip code:
16.7%
Whole state:
13.4%
Residents with income below 50% of the poverty level in 2022:
This zip code:
8.3%
Whole state:
6.9%
Median number of rooms in houses and condos:
Here:
6.3
State:
6.5
Median number of rooms in apartments:
Here:
4.4
State:
4.3
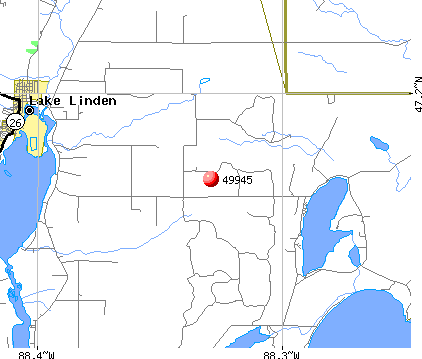
Notable locations in this zip code not listed on our city pages
Notable locations in zip code 49945: Lepisto Marine Ramp (A), Minneyata Camp (B), Bootjack Fire Hall (C), Houghton County Historical Museum (D), Lake Linden Village Police (E), Lake Linden-Hubbell Public Library (F), Bootjack Fire and Rescue Department (G), Lake Linden Village Fire Department (H), Sherman Township Fire Department (I). Display/hide their locations on the map
Churches in zip code 49945 include: Saint John's Lutheran Church (A), Lake Linden United Methodist Church (B), Saint Joseph Church (C). Display/hide their locations on the map
Lakes and swamps: Rice Lake (A), Portage Lake (B), Little Rice Lake (C), Mud Lake (D), Deer Lake (E), Stone Quarry Lake (F), Thayer Lake (G), Torch Lake (H). Display/hide their locations on the map
Rivers and creeks: Giles Creek (A), Traverse River (B), Trap Rock River (C), Tobacco River (D), Big Betsy River (E), Big Creek (F), Hammell Creek (G), Winters Creek (H), Finns Creek (I). Display/hide their locations on the map
In group quarters: 7 (-1 institutionalized population)
Size of family households: 470 2-persons, 143 3-persons, 92 4-persons, 48 5-persons, 25 6-persons, 4 7-or-more-persons
Size of nonfamily households: 457 1-person, 80 2-persons
297 married couples with children.
142 single-parent households (25 men, 117 women).
97.1% of residents of 49945 zip code speak English at home.
2.1% of residents speak Spanish at home (100% very well).
0.8% of residents speak other Indo-European language at home (100% very well).
0.1% of residents speak Asian or Pacific Island language at home (100% well).
0.1% of residents speak other language at home (100% very well).
Foreign born population: 46 (1.6%) (62.1% of them are naturalized citizens)
This zip code:
1.6%
Whole state:
6.9%
54%Chile
9%France
7%Japan
4%Germany
24%Finnish
14%American
11%French Canadian
9%German
8%English
7%Italian
7%French
Year of entry for the foreign-born population
342010 or later
02000 to 2009
231990 to 1999
23Before 1990
Facilities with environmental interests located in this zip code:
MI DEPT/TRANSPORTATION (52705 M-26 in LAKE LINDEN, MI)
Small Quantity Generators, between 100 kg and 1000 kg of hazardous waste/month (Resource Conservation and Recovery Act (tracking hazardous waste))
GAY DUMP (SHERMAN TOWNSHIP) (RT SIDE OF CO RD, 1/4 MI N GAY in GAY, MI)
CRITERIA AND HAZARDOUS AIR POLLUTANT INVENTORY (Inventory of air pollution sources) Business SIC classification: REFUSE SYSTEMS Business NAICS classification: SOLID WASTE LANDFILL.
Housing units lacking complete plumbing facilities: 9.3% Housing units lacking complete kitchen facilities: 2.0%
59.7%Utility gas
27.1%Bottled, tank, or LP gas
5.2%Electricity
5.1%Wood
2.1%Other fuel
0.5%No fuel used
Population in 1990: 3,365.
Place of birth for U.S.-born residents:
This state: 2,290
Northeast: 15
Midwest: 294
South: 76
West: 50
64% of the 49945 zip code residents lived in the same house 5 years ago. Out of people who lived in different houses, 61% lived in this county. Out of people who lived in different counties, 50% lived in Michigan.
89% of the 49945 zip code residents lived in the same house 1 year ago. Out of people who lived in different houses, 63% moved from this county. Out of people who lived in different houses, 19% moved from different county within same state. Out of people who lived in different houses, 15% moved from different state. Out of people who lived in different houses, 1% moved from abroad.
Private vs. public school enrollment:
Students in private schools in grades 1 to 8 (elementary and middle school): 21
Here:
11.8%
Michigan:
12.4%
Students in private schools in grades 9 to 12 (high school): 5
Here:
3.6%
Michigan:
9.8%
Students in private undergraduate colleges:
Here:
0.0%
Michigan:
14.9%
Occupation by median earnings in the past 12 months ($)
80,404Management occupations
69,170Architecture and engineering occupations
66,366Health diagnosing and treating practitioners and other technical occupations
58,677Business and financial operations occupations
54,724Education, training, and library occupations
54,596Computer and mathematical occupations
Companies with federal contracts located in this zip code:
THE NITRATE ELIMINATION COMPAN (334 HECLA STREET in LAKE LINDEN, MI)
$45,046 with Army for Pollution Control and Abatement -- Basic Research (R&D). Signed on 2000-04-19. Completion date: 2000-12-31.
Top industries in this zip code by the number of employees in 2005:
Construction: New Single-Family Housing Construction (except Operative Builders) (10-19 employees: 1 establishment, 5-9 employees: 1 establishment, 1-4 employees: 4 establishments)
Accommodation and Food Services: Full-Service Restaurants (10-19: 1, 1-4: 3)
Other Services (except Public Administration): Civic and Social Organizations (5-9: 1, 1-4: 1)
Other Services (except Public Administration): Religious Organizations (5-9: 1, 1-4: 1)
Other Services (except Public Administration): General Automotive Repair (5-9: 1)
People in group quarters in 2010:
8 people in workers' group living quarters and job corps centers
People in group quarters in 2000:
64 people in nursing homes
13 people in other group homes
6 people in other noninstitutional group quarters
2002 - 2018 National Fire Incident Reporting System (NFIRS) incidents
According to the data from the years 2002 - 2018 the average number of fire incidents per year is 9. The highest number of fires - 27 took place in 2003, and the least - 1 in 2011. The data has an increasing trend.
When looking into fire subcategories, the most incidents belonged to: Structure Fires (47.1%), and Outside Fires (33.5%).
Fire incident types reported to NFIRS in Zip Code 49945


 Nearest zip codes: 49917, 49934, 49942, 49901, 49913, 49805.


 According to the data from the years 2002 - 2018 the average number of fire incidents per year is 9. The highest number of fires - 27 took place in 2003, and the least - 1 in 2011. The data has an increasing trend.
 When looking into fire subcategories, the most incidents belonged to: Structure Fires (47.1%), and Outside Fires (33.5%).