Estimated zip code population in 2022: 962 Zip code population in 2010: 1,195 Zip code population in 2000: 795
Houses and condos: 485 Renter-occupied apartments: 55
% of renters here:
12%
State:
28%
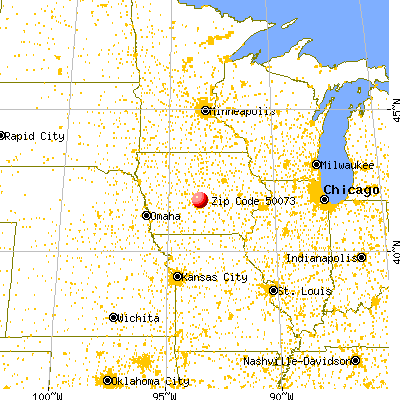
March 2022 cost of living index in zip code 50073: 83.5 (less than average, U.S. average is 100)
Land area: 26.0 sq. mi. Water area: 0.1 sq. mi.
Population density: 37 people per square mile
(very low).
OSM Map
General Map
Google Map
MSN Map
OSM Map
General Map
Google Map
MSN Map
OSM Map
General Map
Google Map
MSN Map
OSM Map
General Map
Google Map
MSN Map
Please wait while loading the map...
Real estate property taxes paid for housing units in 2022:
This zip code:
1.4% ($4,116)
Iowa:
1.4% ($2,724)
Median real estate property taxes paid for housing units with mortgages in 2022: $4,263 (1.3%) Median real estate property taxes paid for housing units with no mortgage in 2022: $2,547 (1.3%)
Business Search- 14 Million verified businesses
Males: 493
(51.3%)
Females: 468
(48.7%)
For population 25 years and over in 50073:
High school or higher: 97.2%
Bachelor's degree or higher: 41.6%
Graduate or professional degree: 6.1%
Unemployed: 0.3%
Mean travel time to work (commute): 25.8 minutes
For population 15 years and over in 50073:
Never married: 18.7%
Now married: 55.0%
Separated: 3.6%
Widowed: 2.8%
Divorced: 20.0%
Zip code 50073 compared to state average:
Unemployed percentage significantly below state average.
Black race population percentage significantly below state average.
Hispanic race population percentage significantly below state average.
Median age significantly above state average.
Foreign-born population percentage significantly below state average.
Renting percentage significantly below state average.
House age below state average.
Number of college students significantly below state average.
Percentage of population with a bachelor's degree or higher above state average.
Estimated median house/condo value in 2022: $291,579
50073:
$291,579
Iowa:
$194,600
According to our research of Iowa and other state lists, there was 1 registered sex offender living in 50073 zip code as of June 16, 2024. The ratio of all residents to sex offenders in zip code 50073 is 1,136 to 1. The ratio of registered sex offenders to all residents in this zip code is lower than the state average.
Median resident age:
This zip code:
56.8 years
Iowa median age:
38.9 years
Average household size:
This zip code:
2.1 people
Iowa:
2.3 people
Averages for the 2020 tax year for zip code 50073, filed in 2021:
Average Adjusted Gross Income (AGI) in 2020: $81,020 (Individual Income Tax Returns)
Here:
$81,020
State:
$71,087
Salary/wage: $70,056 (reported on 86.5% of returns)
Here:
$70,056
State:
$57,361
(% of AGI for various income ranges: 1300.9% for AGIs below $25k, 3822.0% for AGIs $25k-50k, 6512.7% for AGIs $50k-75k, 10420.0% for AGIs $75k-100k, 14986.4% for AGIs $100k-200k)
Taxable interest for individuals: $862 (reported on 39.2% of returns)
This zip code:
$862
Iowa:
$1,633
(% of AGI for various income ranges: 5.5% for AGIs below $25k, 26.0% for AGIs $25k-50k, 16.4% for AGIs $50k-75k, 12.5% for AGIs $75k-100k, 52.7% for AGIs $100k-200k)
Ordinary dividends: $2,200 (reported on 23.0% of returns)
Here:
$2,200
State:
$5,432
(% of AGI for various income ranges: 45.5% for AGIs below $25k, 68.2% for AGIs $50k-75k, 150.9% for AGIs $100k-200k)
Net capital gain/loss in AGI: +$5,994 (reported on 21.6% of returns)
Here:
+$5,994
State:
+$15,243
(% of AGI for various income ranges: 2.7% for AGIs below $25k, 186.4% for AGIs $50k-75k, 81.2% for AGIs $75k-100k, 342.7% for AGIs $100k-200k)
Profit/loss from business: +$11,018 (reported on 14.9% of returns)
Here:
+$11,018
State:
+$11,763
(% of AGI for various income ranges: 112.7% for AGIs below $25k, 203.6% for AGIs $50k-75k, 785.5% for AGIs $100k-200k)
Taxable individual retirement arrangement distribution: $21,583 (reported on 8.1% of returns)
50073:
$21,583
Iowa:
$17,324
(% of AGI for various income ranges: 128.2% for AGIs below $25k, 358.2% for AGIs $50k-75k, 690.9% for AGIs $100k-200k)
Total itemized deductions: $26,625 (reported on 10.8% of returns)
Here:
$26,625
State:
$33,775
(% of AGI for various income ranges: 856.4% for AGIs $50k-75k, 1080.0% for AGIs $100k-200k)
Charity contributions: $9,050 (reported on 5.4% of returns)
Here:
$9,050
State:
$13,075
(% of AGI for various income ranges: 329.1% for AGIs $100k-200k)
Taxes paid: $7,386 (reported on 9.5% of returns)
50073:
$7,386
State:
$7,704
(% of AGI for various income ranges: 227.3% for AGIs $50k-75k, 242.7% for AGIs $100k-200k)
Earned income credit: $2,133 (reported on 8.1% of returns)
Here:
$2,133
State:
$2,195
(% of AGI for various income ranges: 70.9% for AGIs below $25k, 50.0% for AGIs $25k-50k)
Percentage of individuals using paid preparers for their 2020 taxes: 95.9%
Here:
96%
State:
95%
(% for various income ranges: 87.5% for AGIs below $25k, 100.0% for AGIs $25k-50k, 93.3% for AGIs $50k-75k, 100.0% for AGIs $75k-100k, 100.0% for AGIs $100k-200k, 100.0% for AGIs over 200k)
Averages for the 2012 tax year for zip code 50073, filed in 2013:
Average Adjusted Gross Income (AGI) in 2012: $72,249 (Individual Income Tax Returns)
Here:
$72,249
State:
$58,860
Salary/wage: $55,147 (reported on 86.0% of returns)
Here:
$55,147
State:
$46,659
(% of AGI for various income ranges: 81.1% for AGIs below $25k, 81.4% for AGIs $25k-50k, 78.5% for AGIs $50k-75k, 77.6% for AGIs $75k-100k, 106.9% for AGIs $100k-200k)
Taxable interest for individuals: $671 (reported on 42.1% of returns)
This zip code:
$671
Iowa:
$1,537
(% of AGI for various income ranges: 0.8% for AGIs below $25k, 0.3% for AGIs $25k-50k, 0.4% for AGIs $50k-75k, 0.2% for AGIs $75k-100k, 0.6% for AGIs $100k-200k, 0.2% for AGIs over 200k)
Ordinary dividends: $1,433 (reported on 31.6% of returns)
Here:
$1,433
State:
$4,542
(% of AGI for various income ranges: 0.5% for AGIs below $25k, 0.4% for AGIs $25k-50k, 0.2% for AGIs $50k-75k, 0.5% for AGIs $75k-100k, 1.6% for AGIs $100k-200k)
Net capital gain/loss in AGI: +$3,500 (reported on 15.8% of returns)
Here:
+$3,500
State:
+$11,802
Profit/loss from business: +$9,970 (reported on 17.5% of returns)
Here:
+$9,970
State:
+$10,509
(% of AGI for various income ranges: 6.7% for AGIs $25k-50k, 4.8% for AGIs $50k-75k, 3.4% for AGIs $100k-200k)
Taxable individual retirement arrangement distribution: $9,680 (reported on 8.8% of returns)
50073:
$9,680
Iowa:
$11,773
Total itemized deductions: $19,415 (17% of AGI, reported on 47.4% of returns)
Here:
$19,415
State:
$21,278
Here:
17.1% of AGI
State:
18.9% of AGI
(% of AGI for various income ranges: 15.3% for AGIs $25k-50k, 13.1% for AGIs $50k-75k, 17.2% for AGIs $75k-100k, 14.5% for AGIs $100k-200k, 9.4% for AGIs over 200k)
Charity contributions: $3,362 (reported on 36.8% of returns)
Here:
$3,362
State:
$4,044
(% of AGI for various income ranges: 0.7% for AGIs $25k-50k, 1.2% for AGIs $50k-75k, 1.9% for AGIs $75k-100k, 2.0% for AGIs $100k-200k, 2.3% for AGIs over 200k)
Taxes paid: $8,570 (reported on 47.4% of returns)
50073:
$8,570
State:
$8,846
(% of AGI for various income ranges: 4.5% for AGIs $25k-50k, 4.8% for AGIs $50k-75k, 6.8% for AGIs $75k-100k, 7.1% for AGIs $100k-200k, 5.3% for AGIs over 200k)
Earned income credit: $2,017 (reported on 10.5% of returns)
Here:
$2,017
State:
$2,098
(% of AGI for various income ranges: 4.8% for AGIs below $25k, 0.9% for AGIs $25k-50k)
Percentage of individuals using paid preparers for their 2012 taxes: 57.9%
Here:
58%
State:
65%
(% for various income ranges: 50.0% for AGIs below $25k, 63.6% for AGIs $25k-50k, 54.5% for AGIs $50k-75k, 57.1% for AGIs $75k-100k, 66.7% for AGIs $100k-200k, 66.7% for AGIs over 200k)
Averages for the 2004 tax year for zip code 50073, filed in 2005:
Average Adjusted Gross Income (AGI) in 2004: $49,417 (Individual Income Tax Returns)
Here:
$49,417
State:
$43,875
Salary/wage: $43,479 (reported on 88.0% of returns)
Here:
$43,479
State:
$38,265
(% of AGI for various income ranges: 71.1% for AGIs below $10k, 80.8% for AGIs $10k-25k, 85.7% for AGIs $25k-50k, 90.0% for AGIs $50k-75k, 80.4% for AGIs $75k-100k, 58.4% for AGIs over 100k)
Taxable interest for individuals: $1,183 (reported on 53.5% of returns)
This zip code:
$1,183
Iowa:
$1,768
(% of AGI for various income ranges: 7.9% for AGIs below $10k, 1.4% for AGIs $10k-25k, 0.8% for AGIs $25k-50k, 0.6% for AGIs $50k-75k, 0.3% for AGIs $75k-100k, 2.5% for AGIs over 100k)
Taxable dividends: $548 (reported on 25.0% of returns)
Here:
$548
State:
$2,510
(% of AGI for various income ranges: 2.3% for AGIs below $10k, 0.2% for AGIs $10k-25k, 0.1% for AGIs $25k-50k, 0.3% for AGIs $50k-75k, 0.4% for AGIs $75k-100k, 0.3% for AGIs over 100k)
Net capital gain/loss: +$2,483 (reported on 18.9% of returns)
Here:
+$2,483
State:
+$6,139
(% of AGI for various income ranges: 0.0% for AGIs below $10k, 0.4% for AGIs $25k-50k, 0.0% for AGIs $50k-75k, -0.3% for AGIs $75k-100k, 3.3% for AGIs over 100k)
Profit/loss from business: +$1,904 (reported on 15.9% of returns)
Here:
+$1,904
State:
+$8,574
(% of AGI for various income ranges: 1.7% for AGIs $10k-25k, 1.2% for AGIs $25k-50k, 0.3% for AGIs $50k-75k, 0.9% for AGIs $75k-100k)
Total itemized deductions: $16,056 (21% of AGI, reported on 38.9% of returns)
Here:
$16,056
State:
$16,976
Here:
20.9% of AGI
State:
20.8% of AGI
(% of AGI for various income ranges: 13.4% for AGIs $10k-25k, 7.7% for AGIs $25k-50k, 14.7% for AGIs $50k-75k, 14.8% for AGIs $75k-100k, 13.1% for AGIs over 100k)
Charity contributions deductions: $2,403 (3% of AGI, reported on 34.6% of returns)
Here:
$2,403
State:
$3,089
Here:
3.0% of AGI
State:
3.6% of AGI
(% of AGI for various income ranges: 3.6% for AGIs below $10k, 1.2% for AGIs $25k-50k, 1.7% for AGIs $50k-75k, 2.0% for AGIs $75k-100k, 2.1% for AGIs over 100k)
Total tax: $6,208 (reported on 83.7% of returns)
50073:
$6,208
State:
$6,177
(% of AGI for various income ranges: 3.9% for AGIs below $10k, 5.2% for AGIs $10k-25k, 7.3% for AGIs $25k-50k, 8.1% for AGIs $50k-75k, 10.7% for AGIs $75k-100k, 16.4% for AGIs over 100k)
Earned income credit: $1,641 (reported on 8.5% of returns)
Here:
$1,641
State:
$1,540
Percentage of individuals using paid preparers for their 2004 taxes: 63.3%
Here:
63%
State:
70%
(% for various income ranges: 55.4% for AGIs below $10k, 67.4% for AGIs $10k-25k, 61.3% for AGIs $25k-50k, 64.8% for AGIs $50k-75k, 61.5% for AGIs $75k-100k, 70.7% for AGIs over 100k)
Household received Food Stamps/SNAP in the past 12 months: 18 Household did not receive Food Stamps/SNAP in the past 12 months: 445
Women who had a birth in the past 12 months: 3 (3 now married, 0 unmarried) Women who did not have a birth in the past 12 months: 160 (91 now married, 68 unmarried)
Housing units in zip code 50073 with a mortgage: 309 (12 second mortgage, 9 both second mortgage and home equity loan) Houses without a mortgage: 15
Median monthly owner costs for units with a mortgage: $1,596 Median monthly owner costs for units without a mortgage: $698
Residents with income below the poverty level in 2022:
This zip code:
6.5%
Whole state:
11.0%
Residents with income below 50% of the poverty level in 2022:
This zip code:
3.1%
Whole state:
5.5%
Median number of rooms in houses and condos:
Here:
6.5
State:
6.8
Median number of rooms in apartments:
Here:
3.8
State:
4.2
Notable locations in this zip code not listed on our city pages
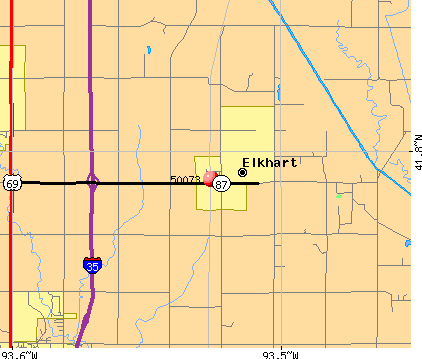
Churches in zip code 50073 include: Faith Christian Fellowship (A), Christian Church (B), Saint Mary's Catholic Church (C). Display/hide their locations on the map
Size of family households: 167 2-persons, 31 3-persons, 36 4-persons, 11 5-persons, 3 6-persons
Size of nonfamily households: 124 1-person, 90 2-persons, 1 3-persons
97 married couples with children.
46 single-parent households (9 men, 37 women).
99.1% of residents of 50073 zip code speak English at home.
0.2% of residents speak Spanish at home (100% not well).
0.5% of residents speak other Indo-European language at home (100% very well).
Foreign born population: 6 (0.7%) (34.1% of them are naturalized citizens)
This zip code:
0.7%
Whole state:
6.0%
33%Japan
17%Costa Rica
33%German
9%American
9%Irish
6%Norwegian
5%English
5%Swedish
2%French
Year of entry for the foreign-born population
02010 or later
32000 to 2009
01990 to 1999
1Before 1990
Facilities with environmental interests located in this zip code:
HEARTLAND COOP (4415 NORTHEAST 108TH AVENUE in ELKHART, IA)
AIR MINOR (AIRS/AFS) COMPLIANCE ACTIVITY (Tracking inspections of insecticide, fungicide, and rodenticide, and toxic substances) (Resource Conservation and Recovery Act (tracking hazardous waste)) Business SIC classification: FARM SUPPLIES Business NAICS classification: FARM MANAGEMENT SERVICES. Alternative names: CENTRAL IOWA F S INC - CB, CENTRAL IOWA FARM SERVICE INC, CENTRAL IOWA FS, INC, HEARTLAND CO-OP ELKHART
ALL TECH (AKA ADVANCED SEALING TECHNOLOGIES) (101 EAST MAIN STREET in ELKHART, IA)
AIR MINOR (AIRS/AFS) Small Quantity Generators, between 100 kg and 1000 kg of hazardous waste/month (Resource Conservation and Recovery Act (tracking hazardous waste)) USED OIL PROGRAM (Resource Conservation and Recovery Act (tracking hazardous waste)) Business SIC classification: WELDING REPAIR Alternative names: ALL TECH INC, ALLTECH INCORPORATED, CLOSED FACILITY -- ALLTECH INCORPORATED
AGRITRONICS CORP (100 MAIN STREET in ELKHART, IA)
AIR MINOR (AIRS/AFS) Business SIC classification: PREPARED FEEDS AND FEED INGREDIENTS FOR ANIMALS AND FOWLS, EXCEPT DOGS AND CATS
HEARTLAND COOP (4300 NORTHEAST 94TH AVENUE in ELKHART, IA)
AIR SYNTHETIC MINOR (AIRS/AFS) COMPLIANCE ACTIVITY (Tracking inspections of insecticide, fungicide, and rodenticide, and toxic substances) Business SIC classification: FLOUR AND OTHER GRAIN MILL PRODUCTS; PREPARED FEEDS AND FEED INGREDIENTS FOR ANIMALS AND FOWLS, EXCEPT DOGS AND CATS Alternative names: ENTERPRISE FARMERS ELEVATOR COMPANY
HEARTLAND COOP (315 S WATER STREET in ELKHART, IA)
AIR MINOR (AIRS/AFS) Alternative names: CLOSED FACILITY -- HEARTLAND COOP
MORGAN VINCENT-RESIDENCE (850 46TH (2 MI N OF ELKHART) in ELKHART, IA)
(Resource Conservation and Recovery Act (tracking hazardous waste))
AGRITRONICS CORPORATION (202 WEST MAPLE STREET in ELKHART, IA)
COMPLIANCE ACTIVITY (Tracking inspections of insecticide, fungicide, and rodenticide, and toxic substances) Business SIC classification: PREPARED FEEDS AND FEED INGREDIENTS FOR ANIMALS AND FOWLS, EXCEPT DOGS AND CATS
CENTRAL IOWA F S, INC. (4415 N.E. AVENUE in ELKHART, IA)
COMPLIANCE ACTIVITY (Tracking inspections of insecticide, fungicide, and rodenticide, and toxic substances)
36.7%Electricity
36.5%Utility gas
25.1%Bottled, tank, or LP gas
1.6%No fuel used
Population in 1990: 1,374.
Place of birth for U.S.-born residents:
This state: 790
Northeast: 8
Midwest: 104
South: 4
West: 47
64% of the 50073 zip code residents lived in the same house 5 years ago. Out of people who lived in different houses, 61% lived in this county. Out of people who lived in different counties, 50% lived in Iowa.
94% of the 50073 zip code residents lived in the same house 1 year ago. Out of people who lived in different houses, 54% moved from this county. Out of people who lived in different houses, 40% moved from different county within same state. Out of people who lived in different houses, 6% moved from different state.
Private vs. public school enrollment:
Students in private schools in grades 1 to 8 (elementary and middle school): 3
Here:
5.8%
Iowa:
10.6%
Students in private schools in grades 9 to 12 (high school): 4
Here:
6.0%
Iowa:
7.9%
Students in private undergraduate colleges: 1
Here:
12.3%
Iowa:
23.9%
Occupation by median earnings in the past 12 months ($)
141,604Computer and mathematical occupations
117,768Management occupations
110,468Transportation occupations
90,172Sales and related occupations
79,352Business and financial operations occupations
74,896Architecture and engineering occupations
Companies with federal contracts located in this zip code:
ALL TECH INCORPORATED (RAILROAD MAIN ST in ELKHART, IA; small business)
$32,079 with U.S. Army Corps of Engineers - civil program financing only for Maintenance, Repair and Rebuilding of Equipment -- Ship and Marine Equipment. Taking place in IL. Signed on 2000-04-24. Completion date: 2000-04-17.
Top industries in this zip code by the number of employees in 2005:
Wholesale Trade: Grain and Field Bean Merchant Wholesalers (10-19 employees: 1 establishment)
Wholesale Trade: Construction and Mining (except Oil Well) Machinery and Equipment Merchant Wholesalers (10-19: 1)
Other Services (except Public Administration): Religious Organizations (5-9: 1, 1-4: 2)
Accommodation and Food Services: Full-Service Restaurants (5-9: 1)
Construction: New Single-Family Housing Construction (except Operative Builders) (5-9: 1)
Construction: Residential Remodelers (1-4: 1)
Accommodation and Food Services: Drinking Places (Alcoholic Beverages) (1-4: 1)
Other Services (except Public Administration): Car Washes (1-4: 1)
Fatal accident statistics in 2010:
Fatal accident count: 1
Vehicles involved in fatal accidents: 2
Fatal accidents caused by drunken drivers: 0
Fatalities: 1
Persons involved in fatal accidents: 3
Pedestrians involved in fatal accidents: 0
Home Mortgage Disclosure Act Aggregated Statistics For Year 2009 (Based on 2 partial tracts)
A) FHA, FSA/RHS & VA Home Purchase Loans
B) Conventional Home Purchase Loans
C) Refinancings
D) Home Improvement Loans
F) Non-occupant Loans on < 5 Family Dwellings (A B C & D)
G) Loans On Manufactured Home Dwelling (A B C & D)
Number
Average Value
Number
Average Value
Number
Average Value
Number
Average Value
Number
Average Value
Number
Average Value
LOANS ORIGINATED
9
$128,577
11
$183,795
79
$194,302
2
$34,960
2
$107,235
0
$0
APPLICATIONS APPROVED, NOT ACCEPTED
1
$69,920
1
$236,470
11
$177,725
0
$0
0
$0
0
$0
APPLICATIONS DENIED
1
$190,510
2
$141,995
22
$198,935
1
$102,130
0
$0
1
$63,240
APPLICATIONS WITHDRAWN
0
$0
1
$132,370
17
$214,076
1
$30,250
0
$0
0
$0
FILES CLOSED FOR INCOMPLETENESS
0
$0
0
$0
2
$187,760
1
$8,250
0
$0
0
$0
Aggregated Statistics For Year 2008 (Based on 2 partial tracts)
A) FHA, FSA/RHS & VA Home Purchase Loans
B) Conventional Home Purchase Loans
C) Refinancings
D) Home Improvement Loans
F) Non-occupant Loans on < 5 Family Dwellings (A B C & D)
Number
Average Value
Number
Average Value
Number
Average Value
Number
Average Value
Number
Average Value
LOANS ORIGINATED
4
$110,475
16
$176,024
31
$188,759
8
$71,096
1
$77,380
APPLICATIONS APPROVED, NOT ACCEPTED
0
$0
3
$103,043
4
$89,558
2
$39,870
1
$46,350
APPLICATIONS DENIED
0
$0
5
$218,790
17
$169,875
3
$123,600
0
$0
APPLICATIONS WITHDRAWN
0
$0
4
$149,852
8
$172,292
2
$134,535
0
$0
FILES CLOSED FOR INCOMPLETENESS
0
$0
1
$403,010
5
$238,352
0
$0
0
$0
Aggregated Statistics For Year 2007 (Based on 2 partial tracts)
B) Conventional Home Purchase Loans
C) Refinancings
D) Home Improvement Loans
F) Non-occupant Loans on < 5 Family Dwellings (A B C & D)
G) Loans On Manufactured Home Dwelling (A B C & D)
Number
Average Value
Number
Average Value
Number
Average Value
Number
Average Value
Number
Average Value
LOANS ORIGINATED
42
$185,664
40
$170,790
9
$47,921
4
$132,472
2
$62,850
APPLICATIONS APPROVED, NOT ACCEPTED
3
$157,250
4
$200,328
1
$45,960
0
$0
0
$0
APPLICATIONS DENIED
6
$135,778
21
$179,341
5
$81,860
0
$0
1
$31,820
APPLICATIONS WITHDRAWN
3
$127,137
6
$146,645
1
$11,780
0
$0
0
$0
FILES CLOSED FOR INCOMPLETENESS
2
$97,805
6
$145,663
1
$94,270
0
$0
0
$0
Aggregated Statistics For Year 2006 (Based on 2 partial tracts)
A) FHA, FSA/RHS & VA Home Purchase Loans
B) Conventional Home Purchase Loans
C) Refinancings
D) Home Improvement Loans
F) Non-occupant Loans on < 5 Family Dwellings (A B C & D)
G) Loans On Manufactured Home Dwelling (A B C & D)
Number
Average Value
Number
Average Value
Number
Average Value
Number
Average Value
Number
Average Value
Number
Average Value
LOANS ORIGINATED
2
$87,790
42
$129,502
39
$157,815
7
$65,486
3
$104,877
1
$54,210
APPLICATIONS APPROVED, NOT ACCEPTED
0
$0
4
$132,962
4
$107,235
1
$180,690
0
$0
0
$0
APPLICATIONS DENIED
1
$91,130
10
$192,551
23
$133,962
5
$100,556
1
$127,660
2
$46,155
APPLICATIONS WITHDRAWN
0
$0
5
$118,704
11
$169,261
0
$0
0
$0
0
$0
FILES CLOSED FOR INCOMPLETENESS
0
$0
2
$199,935
7
$171,149
0
$0
0
$0
0
$0
Aggregated Statistics For Year 2005 (Based on 2 partial tracts)
A) FHA, FSA/RHS & VA Home Purchase Loans
B) Conventional Home Purchase Loans
C) Refinancings
D) Home Improvement Loans
F) Non-occupant Loans on < 5 Family Dwellings (A B C & D)
G) Loans On Manufactured Home Dwelling (A B C & D)
Number
Average Value
Number
Average Value
Number
Average Value
Number
Average Value
Number
Average Value
Number
Average Value
LOANS ORIGINATED
2
$109,000
50
$140,968
40
$140,396
6
$44,125
5
$114,934
0
$0
APPLICATIONS APPROVED, NOT ACCEPTED
0
$0
5
$183,360
9
$201,856
1
$52,640
0
$0
0
$0
APPLICATIONS DENIED
0
$0
7
$100,837
22
$166,172
6
$55,973
1
$60,100
2
$144,550
APPLICATIONS WITHDRAWN
0
$0
8
$160,360
11
$142,336
1
$251,780
0
$0
0
$0
FILES CLOSED FOR INCOMPLETENESS
0
$0
3
$88,643
7
$159,646
1
$174,800
0
$0
0
$0
Aggregated Statistics For Year 2004 (Based on 2 partial tracts)
B) Conventional Home Purchase Loans
C) Refinancings
D) Home Improvement Loans
F) Non-occupant Loans on < 5 Family Dwellings (A B C & D)
G) Loans On Manufactured Home Dwelling (A B C & D)
Number
Average Value
Number
Average Value
Number
Average Value
Number
Average Value
Number
Average Value
LOANS ORIGINATED
33
$131,885
51
$126,428
11
$48,635
3
$68,740
2
$126,285
APPLICATIONS APPROVED, NOT ACCEPTED
6
$187,365
9
$154,327
0
$0
1
$29,070
0
$0
APPLICATIONS DENIED
7
$117,223
21
$125,977
4
$38,200
0
$0
1
$59,710
APPLICATIONS WITHDRAWN
2
$156,925
12
$152,472
1
$52,640
0
$0
0
$0
FILES CLOSED FOR INCOMPLETENESS
1
$139,440
7
$157,233
0
$0
0
$0
0
$0
Aggregated Statistics For Year 2003 (Based on 2 partial tracts)
A) FHA, FSA/RHS & VA Home Purchase Loans
B) Conventional Home Purchase Loans
C) Refinancings
D) Home Improvement Loans
F) Non-occupant Loans on < 5 Family Dwellings (A B C & D)
Number
Average Value
Number
Average Value
Number
Average Value
Number
Average Value
Number
Average Value
LOANS ORIGINATED
4
$108,805
27
$146,864
94
$132,231
8
$23,421
2
$69,525
APPLICATIONS APPROVED, NOT ACCEPTED
0
$0
1
$156,730
14
$143,765
0
$0
0
$0
APPLICATIONS DENIED
1
$77,380
3
$115,877
21
$152,107
2
$22,195
0
$0
APPLICATIONS WITHDRAWN
0
$0
3
$164,453
14
$135,376
0
$0
0
$0
FILES CLOSED FOR INCOMPLETENESS
0
$0
2
$72,275
5
$124,360
0
$0
0
$0
Aggregated Statistics For Year 2002 (Based on 2 partial tracts)
A) FHA, FSA/RHS & VA Home Purchase Loans
B) Conventional Home Purchase Loans
C) Refinancings
D) Home Improvement Loans
F) Non-occupant Loans on < 5 Family Dwellings (A B C & D)
Number
Average Value
Number
Average Value
Number
Average Value
Number
Average Value
Number
Average Value
LOANS ORIGINATED
0
$0
19
$131,919
46
$130,060
7
$29,797
2
$121,180
APPLICATIONS APPROVED, NOT ACCEPTED
0
$0
3
$120,327
7
$130,186
1
$29,850
0
$0
APPLICATIONS DENIED
1
$80,520
6
$125,303
13
$115,755
1
$23,180
1
$19,640
APPLICATIONS WITHDRAWN
0
$0
3
$101,343
7
$155,886
0
$0
0
$0
FILES CLOSED FOR INCOMPLETENESS
0
$0
1
$42,820
5
$102,364
0
$0
0
$0
Aggregated Statistics For Year 2001 (Based on 2 partial tracts)
A) FHA, FSA/RHS & VA Home Purchase Loans
B) Conventional Home Purchase Loans
C) Refinancings
D) Home Improvement Loans
F) Non-occupant Loans on < 5 Family Dwellings (A B C & D)
Number
Average Value
Number
Average Value
Number
Average Value
Number
Average Value
Number
Average Value
LOANS ORIGINATED
2
$100,950
16
$127,194
44
$117,849
6
$22,128
2
$88,575
APPLICATIONS APPROVED, NOT ACCEPTED
1
$87,590
4
$78,855
6
$121,375
1
$13,750
1
$54,210
APPLICATIONS DENIED
0
$0
5
$114,934
15
$109,434
0
$0
0
$0
APPLICATIONS WITHDRAWN
0
$0
2
$145,530
11
$109,591
0
$0
0
$0
FILES CLOSED FOR INCOMPLETENESS
0
$0
0
$0
1
$140,620
0
$0
0
$0
Aggregated Statistics For Year 2000 (Based on 2 partial tracts)
A) FHA, FSA/RHS & VA Home Purchase Loans
B) Conventional Home Purchase Loans
C) Refinancings
D) Home Improvement Loans
Number
Average Value
Number
Average Value
Number
Average Value
Number
Average Value
LOANS ORIGINATED
2
$66,970
11
$119,411
13
$118,868
5
$20,348
APPLICATIONS APPROVED, NOT ACCEPTED
0
$0
1
$66,380
2
$52,440
0
$0
APPLICATIONS DENIED
0
$0
6
$76,333
5
$99,378
1
$26,320
APPLICATIONS WITHDRAWN
0
$0
2
$123,930
3
$89,560
0
$0
FILES CLOSED FOR INCOMPLETENESS
0
$0
1
$122,550
1
$188,940
0
$0
Aggregated Statistics For Year 1999 (Based on 1 partial tract)
A) FHA, FSA/RHS & VA Home Purchase Loans
B) Conventional Home Purchase Loans
C) Refinancings
D) Home Improvement Loans
F) Non-occupant Loans on < 5 Family Dwellings (A B C & D)
Detailed PMIC statistics for the following Tracts:0101.01
2002 - 2018 National Fire Incident Reporting System (NFIRS) incidents
Based on the data from the years 2002 - 2018 the average number of fires per year is 13. The highest number of fires - 24 took place in 2005, and the least - 0 in 2009. The data has a declining trend.
When looking into fire subcategories, the most reports belonged to: Outside Fires (51.1%), and Structure Fires (19.0%).
Fire incident types reported to NFIRS in Zip Code 50073


 Nearest zip codes: 50007, 50021, 50035, 50046, 50124, 50023.


 Based on the data from the years 2002 - 2018 the average number of fires per year is 13. The highest number of fires - 24 took place in 2005, and the least - 0 in 2009. The data has a declining trend.
 When looking into fire subcategories, the most reports belonged to: Outside Fires (51.1%), and Structure Fires (19.0%).