Estimated zip code population in 2022: 538 Zip code population in 2010: 695 Zip code population in 2000: 869
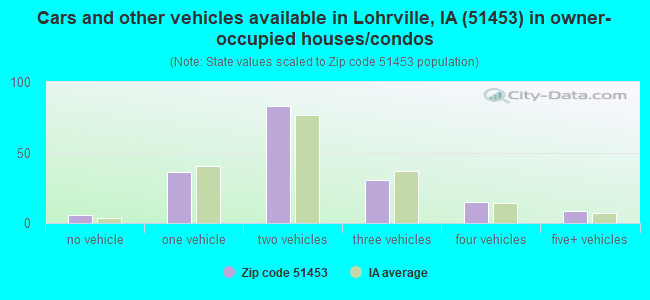
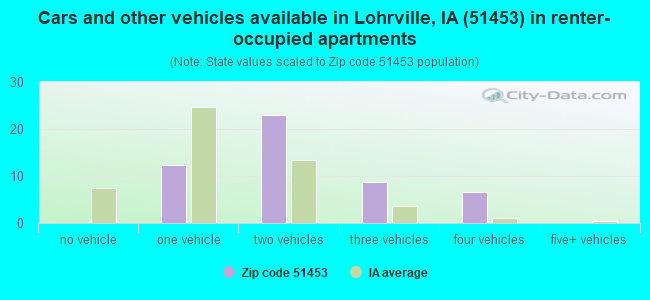
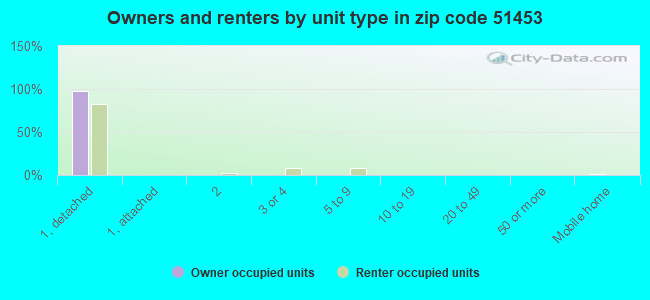
Houses and condos: 260 Renter-occupied apartments: 51
% of renters here:
22%
State:
28%
March 2022 cost of living index in zip code 51453: 82.3 (low, U.S. average is 100)
Land area: 86.2 sq. mi. Water area: 0.0 sq. mi.
Population density: 6 people per square mile
(very low).
OSM Map
General Map
Google Map
MSN Map
OSM Map
General Map
Google Map
MSN Map
OSM Map
General Map
Google Map
MSN Map
OSM Map
General Map
Google Map
MSN Map
Please wait while loading the map...
Real estate property taxes paid for housing units in 2022:
This zip code:
1.0% ($1,019)
Iowa:
1.4% ($2,724)
Median real estate property taxes paid for housing units with mortgages in 2022: $1,128 (1.1%) Median real estate property taxes paid for housing units with no mortgage in 2022: $998 (1.0%)
Business Search- 14 Million verified businesses
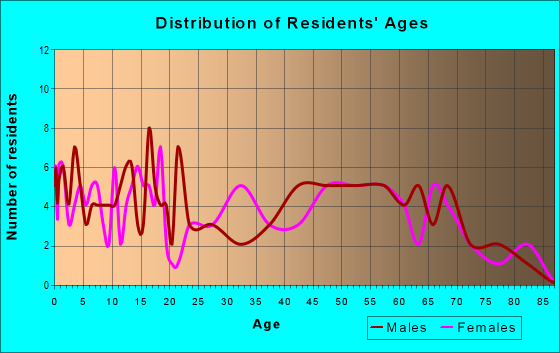
Males: 267
(49.6%)
Females: 271
(50.4%)
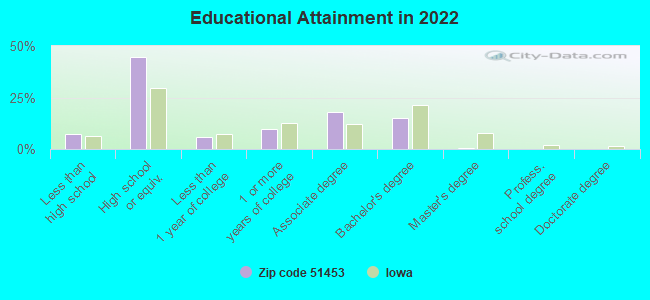
For population 25 years and over in 51453:
High school or higher: 91.6%
Bachelor's degree or higher: 15.1%
Graduate or professional degree: 0.3%
Mean travel time to work (commute): 26.5 minutes
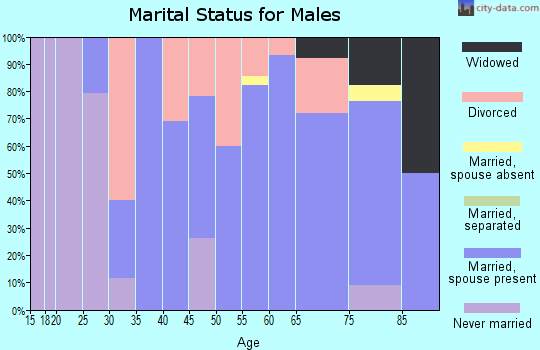
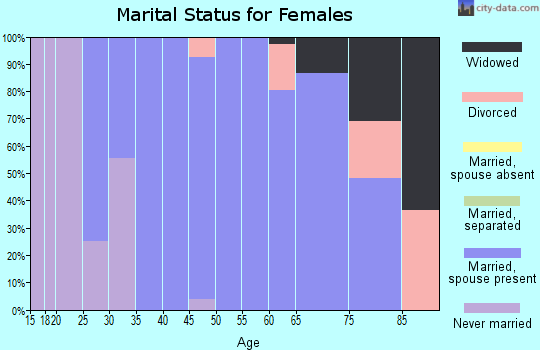
For population 15 years and over in 51453:
Never married: 15.7%
Now married: 59.6%
Separated: 1.2%
Widowed: 5.8%
Divorced: 17.7%
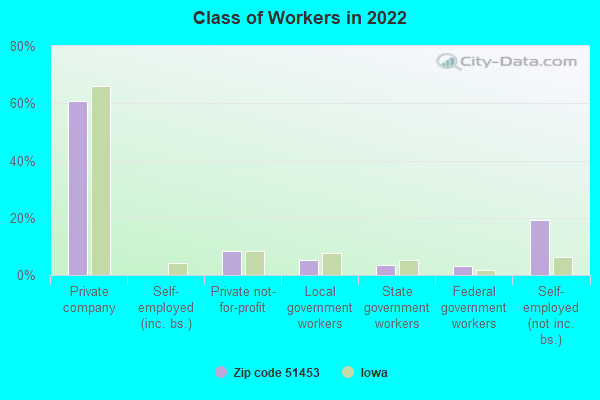
Zip code 51453 compared to state average:
Median house value below state average.
Unemployed percentage significantly below state average.
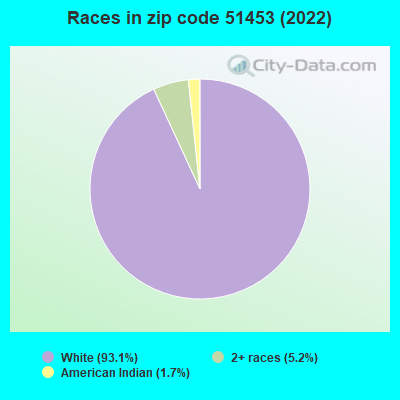
Black race population percentage significantly below state average.
Hispanic race population percentage significantly below state average.
Median age significantly above state average.
Foreign-born population percentage significantly below state average.
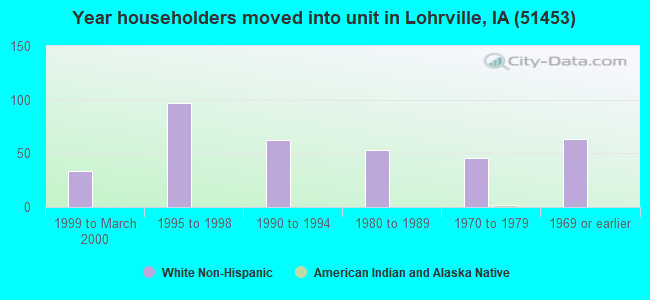
Length of stay since moving in below state average.
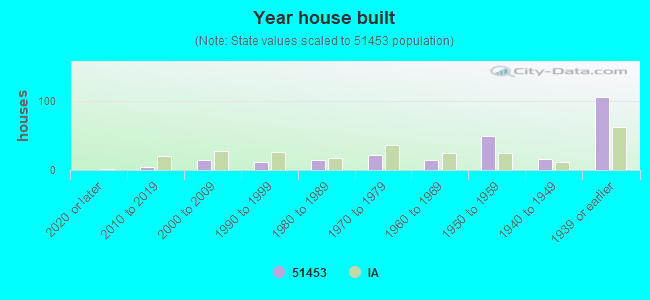
House age above state average.
Number of college students below state average.
Percentage of population with a bachelor's degree or higher below state average.
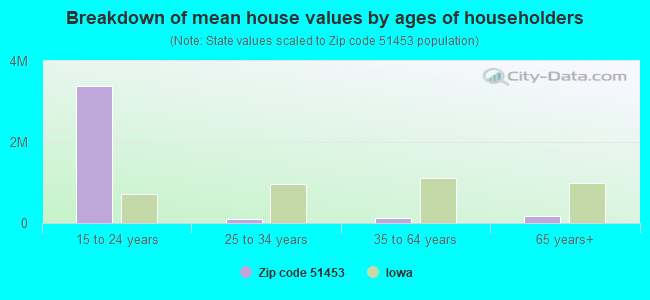
Estimated median house/condo value in 2022: $103,622
51453:
$103,622
Iowa:
$194,600
According to our research of Iowa and other state lists, there was 1 registered sex offender living in 51453 zip code as of June 16, 2024. The ratio of all residents to sex offenders in zip code 51453 is 761 to 1. The ratio of registered sex offenders to all residents in this zip code is lower than the state average.
Median resident age:
This zip code:
48.5 years
Iowa median age:
38.9 years
Average household size:
This zip code:
2.3 people
Iowa:
2.3 people
Averages for the 2020 tax year for zip code 51453, filed in 2021:
Average Adjusted Gross Income (AGI) in 2020: $66,030 (Individual Income Tax Returns)
Here:
$66,030
State:
$71,087
Salary/wage: $49,962 (reported on 77.8% of returns)
Here:
$49,962
State:
$57,361
(% of AGI for various income ranges: 1286.0% for AGIs below $25k, 3756.0% for AGIs $25k-50k, 5423.3% for AGIs $50k-75k, 5212.5% for AGIs $75k-100k)
Taxable interest for individuals: $789 (reported on 33.3% of returns)
This zip code:
$789
Iowa:
$1,633
(% of AGI for various income ranges: 42.0% for AGIs $25k-50k, 33.3% for AGIs $50k-75k)
Ordinary dividends: $1,700 (reported on 14.8% of returns)
Here:
$1,700
State:
$5,432
(% of AGI for various income ranges: 170.0% for AGIs $75k-100k)
Net capital gain/loss in AGI: +$3,950 (reported on 14.8% of returns)
Here:
+$3,950
State:
+$15,243
(% of AGI for various income ranges: 395.0% for AGIs $75k-100k)
Profit/loss from business: +$4,650 (reported on 14.8% of returns)
Here:
+$4,650
State:
+$11,763
(% of AGI for various income ranges: 284.0% for AGIs below $25k, 146.7% for AGIs $50k-75k)
Taxable individual retirement arrangement distribution: $5,833 (reported on 11.1% of returns)
51453:
$5,833
Iowa:
$17,324
(% of AGI for various income ranges: 350.0% for AGIs $25k-50k)
Earned income credit: $2,267 (reported on 11.1% of returns)
Here:
$2,267
State:
$2,195
(% of AGI for various income ranges: 136.0% for AGIs below $25k)
Percentage of individuals using paid preparers for their 2020 taxes: 100.0%
Here:
100%
State:
95%
(% for various income ranges: 100.0% for AGIs below $25k, 100.0% for AGIs $25k-50k, 100.0% for AGIs $50k-75k, 100.0% for AGIs $75k-100k, 100.0% for AGIs $100k-200k)
Averages for the 2012 tax year for zip code 51453, filed in 2013:
Average Adjusted Gross Income (AGI) in 2012: $54,266 (Individual Income Tax Returns)
Here:
$54,266
State:
$58,860
Salary/wage: $34,317 (reported on 82.8% of returns)
Here:
$34,317
State:
$46,659
(% of AGI for various income ranges: 74.1% for AGIs below $25k, 74.0% for AGIs $25k-50k, 67.6% for AGIs $50k-75k, 57.3% for AGIs $75k-100k, 27.8% for AGIs $100k-200k)
Taxable interest for individuals: $836 (reported on 37.9% of returns)
This zip code:
$836
Iowa:
$1,537
(% of AGI for various income ranges: 1.4% for AGIs below $25k, 0.9% for AGIs $25k-50k, 0.6% for AGIs $50k-75k, 0.4% for AGIs $100k-200k)
Ordinary dividends: $700 (reported on 20.7% of returns)
Here:
$700
State:
$4,542
Net capital gain/loss in AGI: +$1,025 (reported on 13.8% of returns)
Here:
+$1,025
State:
+$11,802
Profit/loss from business: +$5,250 (reported on 13.8% of returns)
Here:
+$5,250
State:
+$10,509
Taxable individual retirement arrangement distribution: $5,233 (reported on 10.3% of returns)
51453:
$5,233
Iowa:
$11,773
Total itemized deductions: $15,067 (16% of AGI, reported on 20.7% of returns)
Here:
$15,067
State:
$21,278
Here:
15.7% of AGI
State:
18.9% of AGI
Charity contributions: $2,350 (reported on 13.8% of returns)
Here:
$2,350
State:
$4,044
Taxes paid: $5,760 (reported on 17.2% of returns)
51453:
$5,760
State:
$8,846
Earned income credit: $2,000 (reported on 17.2% of returns)
Here:
$2,000
State:
$2,098
(% of AGI for various income ranges: 7.0% for AGIs below $25k)
Percentage of individuals using paid preparers for their 2012 taxes: 75.9%
Here:
76%
State:
65%
(% for various income ranges: 70.0% for AGIs below $25k, 77.8% for AGIs $25k-50k, 75.0% for AGIs $50k-75k, 66.7% for AGIs $75k-100k, 100.0% for AGIs $100k-200k)
Averages for the 2004 tax year for zip code 51453, filed in 2005:
Average Adjusted Gross Income (AGI) in 2004: $29,939 (Individual Income Tax Returns)
Here:
$29,939
State:
$43,875
Salary/wage: $26,158 (reported on 81.3% of returns)
Here:
$26,158
State:
$38,265
(% of AGI for various income ranges: 193.3% for AGIs below $10k, 75.0% for AGIs $10k-25k, 70.9% for AGIs $25k-50k, 71.7% for AGIs $50k-75k, 52.3% for AGIs $75k-100k)
Taxable interest for individuals: $1,159 (reported on 48.2% of returns)
This zip code:
$1,159
Iowa:
$1,768
(% of AGI for various income ranges: 8.0% for AGIs below $10k, 5.5% for AGIs $10k-25k, 1.2% for AGIs $25k-50k, 1.1% for AGIs $50k-75k, 0.3% for AGIs $75k-100k)
Taxable dividends: $761 (reported on 20.6% of returns)
Here:
$761
State:
$2,510
Net capital gain/loss: +$2,055 (reported on 16.9% of returns)
Here:
+$2,055
State:
+$6,139
Profit/loss from business: +$4,019 (reported on 16.6% of returns)
Here:
+$4,019
State:
+$8,574
Profit/loss from farming: +$6,446 (reported on 19.9% of returns)
Here:
+$6,446
State:
-$74
IRA payment deduction: $2,571 (reported on 4.3% of returns)
51453:
$2,571
Iowa:
$2,970
Total itemized deductions: $11,407 (25% of AGI, reported on 16.6% of returns)
Here:
$11,407
State:
$16,976
Here:
25.2% of AGI
State:
20.8% of AGI
Charity contributions deductions: $1,463 (3% of AGI, reported on 12.6% of returns)
Here:
$1,463
State:
$3,089
Here:
3.2% of AGI
State:
3.6% of AGI
Total tax: $3,145 (reported on 74.2% of returns)
51453:
$3,145
State:
$6,177
(% of AGI for various income ranges: 5.5% for AGIs below $10k, 4.1% for AGIs $10k-25k, 7.6% for AGIs $25k-50k, 9.3% for AGIs $50k-75k, 9.7% for AGIs $75k-100k)
Earned income credit: $1,571 (reported on 12.9% of returns)
Here:
$1,571
State:
$1,540
Percentage of individuals using paid preparers for their 2004 taxes: 80.7%
Here:
81%
State:
70%
(% for various income ranges: 73.1% for AGIs below $10k, 77.4% for AGIs $10k-25k, 82.4% for AGIs $25k-50k, 91.5% for AGIs $50k-75k, 88.2% for AGIs $75k-100k)
Household received Food Stamps/SNAP in the past 12 months: 13 Household did not receive Food Stamps/SNAP in the past 12 months: 217
Women who had a birth in the past 12 months: 9 (8 now married, 0 unmarried) Women who did not have a birth in the past 12 months: 87 (39 now married, 48 unmarried)
Housing units in zip code 51453 with a mortgage: 41 Median monthly owner costs for units with a mortgage: $1,166 Median monthly owner costs for units without a mortgage: $482
Residents with income below the poverty level in 2022:
This zip code:
8.1%
Whole state:
11.0%
Residents with income below 50% of the poverty level in 2022:
This zip code:
6.8%
Whole state:
5.5%
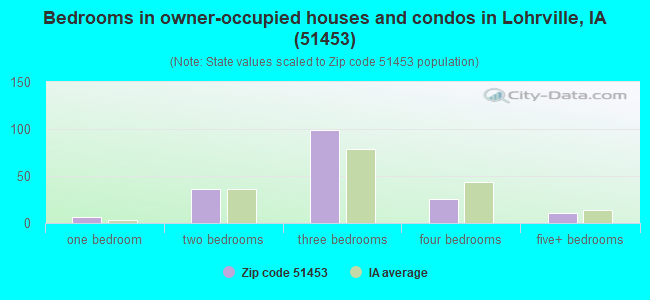
Median number of rooms in houses and condos:
Here:
7.1
State:
6.8
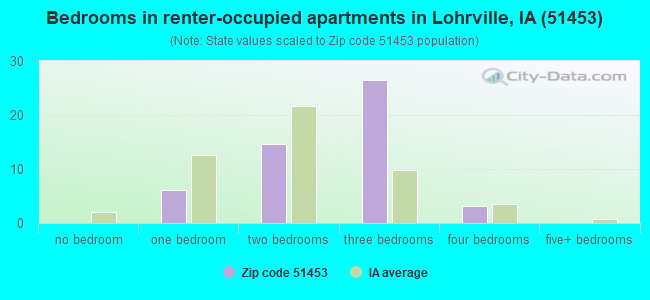
Median number of rooms in apartments:
Here:
5.1
State:
4.2
Notable locations in this zip code not listed on our city pages
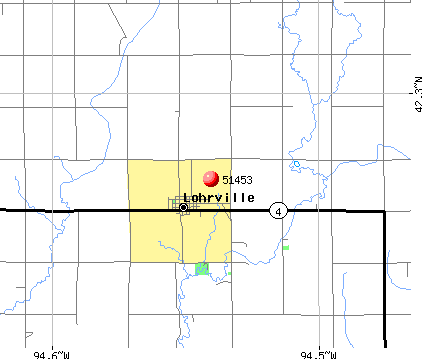
Notable locations in zip code 51453: New Cooperative Incorporated Elevator (A), Lohrville Ambulance Service (B), Lohrville Fire Station (C), J J Hands Library (D), Lohrville City Hall (E). Display/hide their locations on the map
Churches in zip code 51453 include: Church of Christ (A), United Methodist Church (B), Saint Joseph Church (C), Christian Church (D), Share Group Fellowship Church (E). Display/hide their locations on the map
Cemeteries: Bishop Cemetery (1), Saint Joseph Cemetery (2), Cedar Cemetery (3), Evergreen Cemetery (4), Logan Township Cemetery (5). Display/hide their locations on the map
Parks in zip code 51453 include: Davis Preservation Area (1), Lohr Wildlife Refuge (2), Johnson Prairie (3), University Forty County Park (4). Display/hide their locations on the map
Size of family households: 82 2-persons, 21 3-persons, 6 4-persons, 13 5-persons, 10 6-persons, 7 7-or-more-persons
Size of nonfamily households: 72 1-person, 17 2-persons
106 married couples with children.
12 single-parent households (12 men).
98.2% of residents of 51453 zip code speak English at home.
0.2% of residents speak Spanish at home (100% very well).
0.8% of residents speak other Indo-European language at home (100% very well).
1.0% of residents speak other language at home (100% very well).
Foreign born population: 4 (0.8%) (100.0% of them are naturalized citizens)
This zip code:
0.8%
Whole state:
6.0%
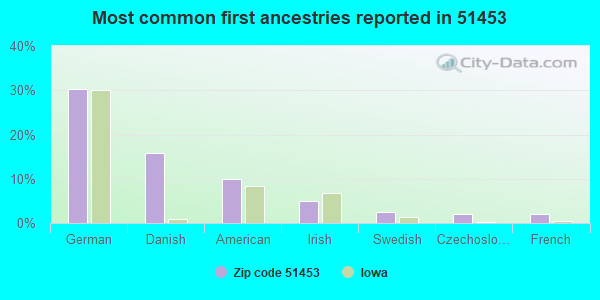
30%German
16%Danish
10%American
5%Irish
2%Swedish
2%Czechoslovakian
2%French
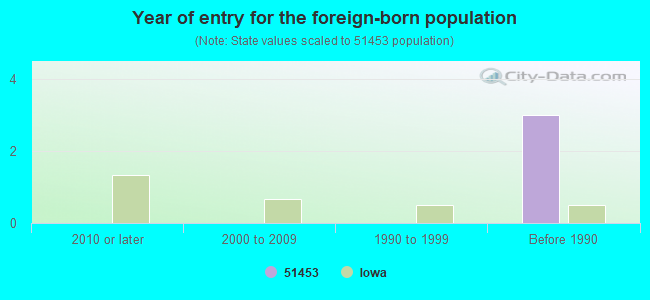
Year of entry for the foreign-born population
02010 or later
02000 to 2009
01990 to 1999
3Before 1990
Facilities with environmental interests located in this zip code:
SOUTHERN CAL MIDDLE SCHOOL (3RD AND MAPLE in LOHRVILLE, IA)
(Geographic Names Information System) (National Center for Education Statistics) - STATE ID-136091 209 Organizations: SOUTHERN CAL COMM SCHOOL DISTRICT (SCHOOL DISTRICT)
AIR ELECTRIC MACHINE COMPANY INCORPORATED (100 MAIN ST in LOHRVILLE, IA)
AIR SYNTHETIC MINOR (AIRS/AFS) ENFORCEMENT/COMPLIANCE ACTIVITY (Integrated Compliance Information System) Small Quantity Generators, between 100 kg and 1000 kg of hazardous waste/month (Resource Conservation and Recovery Act (tracking hazardous waste)) Business SIC classification: MANUFACTURING INDUSTRIES Business NAICS classification: ALL OTHER MISCELLANEOUS FABRICATED METAL PRODUCT MANUFACTURING.; LAWN AND GARDEN TRACTOR AND HOME LAWN AND GARDEN EQUIPMENT MANUFACTURING.
SIMPLOT SOILBUILDERS-FORMER SITE OF (SW CORNER OF 5TH & ELM in LOHRVILLE, IA)
(Resource Conservation and Recovery Act (tracking hazardous waste))
MORRIS, EUGENE (RT 1 BOX 218 in LOHRVILLE, IA)
COMPLIANCE ACTIVITY (Tracking inspections of insecticide, fungicide, and rodenticide, and toxic substances)
NEW COOPERATIVE INC (1213 3RD ST BOX 26 in LOHRVILLE, IA)
COMPLIANCE ACTIVITY (Tracking inspections of insecticide, fungicide, and rodenticide, and toxic substances)
Housing units lacking complete plumbing facilities: 6.1% Housing units lacking complete kitchen facilities: 5.1%
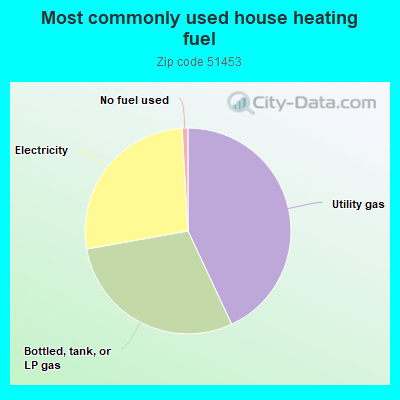
43.2%Utility gas
29.3%Bottled, tank, or LP gas
27.0%Electricity
0.9%No fuel used
Population in 1990: 615. Population change in the 1990s: +254 (+41.3%).
Place of birth for U.S.-born residents:
This state: 456
Midwest: 54
South: 5
West: 17
69% of the 51453 zip code residents lived in the same house 5 years ago. Out of people who lived in different houses, 52% lived in this county. Out of people who lived in different counties, 50% lived in Iowa.
86% of the 51453 zip code residents lived in the same house 1 year ago. Out of people who lived in different houses, 56% moved from this county. Out of people who lived in different houses, 39% moved from different county within same state. Out of people who lived in different houses, 2% moved from abroad.
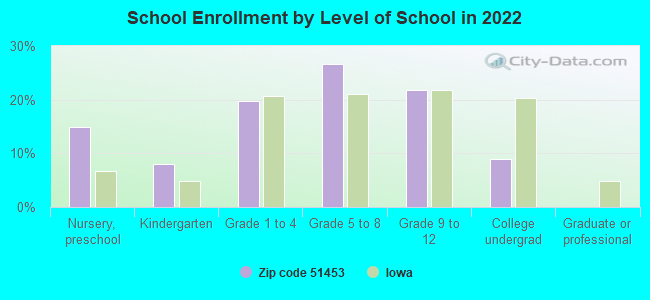
Private vs. public school enrollment:
Students in private schools in grades 1 to 8 (elementary and middle school):
Here:
0.0%
Iowa:
10.6%
Students in private schools in grades 9 to 12 (high school):
Here:
0.0%
Iowa:
7.9%
Students in private undergraduate colleges: 2
Here:
28.9%
Iowa:
23.9%
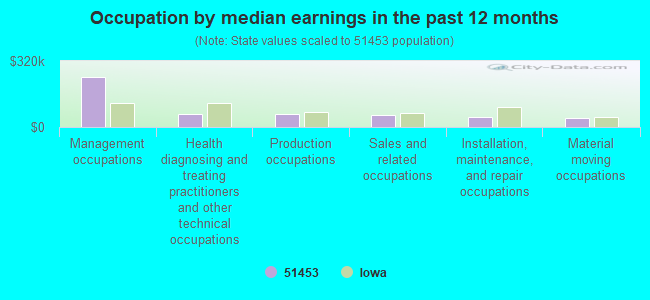
Occupation by median earnings in the past 12 months ($)
243,901Management occupations
64,801Health diagnosing and treating practitioners and other technical occupations
62,244Production occupations
57,571Sales and related occupations
48,022Installation, maintenance, and repair occupations
44,482Material moving occupations
Top industries in this zip code by the number of employees in 2005:
Other Services (except Public Administration): Religious Organizations (1-4 employees: 4 establishments)
Construction: Other Heavy and Civil Engineering Construction (5-9: 1)
Finance and Insurance: Commercial Banking (5-9: 1)
Other Services (except Public Administration): Automotive Body, Paint, and Interior Repair and Maintenance (1-4: 1)
Finance and Insurance: Insurance Agencies and Brokerages (1-4: 1)
Construction: Commercial and Institutional Building Construction (1-4: 1)
Accommodation and Food Services: Drinking Places (Alcoholic Beverages) (1-4: 1)


+$6,446
-$74
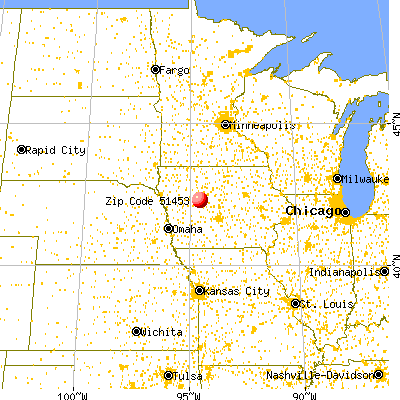
 Nearest zip codes: 50538, 50050, 50579, 51451, 51449, 50586.