Estimated zip code population in 2022: 1,354 Zip code population in 2010: 1,299 Zip code population in 2000: 1,620
Houses and condos: 670 Renter-occupied apartments: 137
% of renters here:
22%
State:
28%
March 2022 cost of living index in zip code 51638: 81.6 (low, U.S. average is 100)
Land area: 85.1 sq. mi. Water area: 0.2 sq. mi.
Population density: 16 people per square mile
(very low).
OSM Map
General Map
Google Map
MSN Map
OSM Map
General Map
Google Map
MSN Map
OSM Map
General Map
Google Map
MSN Map
OSM Map
General Map
Google Map
MSN Map
Please wait while loading the map...
Real estate property taxes paid for housing units in 2022:
This zip code:
1.4% ($1,471)
Iowa:
1.4% ($2,724)
Median real estate property taxes paid for housing units with mortgages in 2022: $1,519 (1.3%) Median real estate property taxes paid for housing units with no mortgage in 2022: $1,407 (1.5%)
Business Search- 14 Million verified businesses
Males: 678
(50.1%)
Females: 676
(49.9%)
For population 25 years and over in 51638:
High school or higher: 89.3%
Bachelor's degree or higher: 17.1%
Graduate or professional degree: 4.4%
Unemployed: 3.4%
Mean travel time to work (commute): 27.1 minutes
For population 15 years and over in 51638:
Never married: 23.3%
Now married: 52.5%
Separated: 2.2%
Widowed: 7.0%
Divorced: 15.0%
Zip code 51638 compared to state average:
Median house value below state average.
Black race population percentage significantly below state average.
Median age significantly above state average.
Foreign-born population percentage significantly below state average.
Length of stay since moving in significantly above state average.
House age above state average.
Number of college students below state average.
Percentage of population with a bachelor's degree or higher below state average.
Estimated median house/condo value in 2022: $107,373
51638:
$107,373
Iowa:
$194,600
According to our research of Iowa and other state lists, there were 2 registered sex offenders living in 51638 zip code as of June 20, 2024. The ratio of all residents to sex offenders in zip code 51638 is 660 to 1. The ratio of registered sex offenders to all residents in this zip code is lower than the state average.
Median resident age:
This zip code:
51.7 years
Iowa median age:
38.9 years
Average household size:
This zip code:
2.2 people
Iowa:
2.3 people
Averages for the 2020 tax year for zip code 51638, filed in 2021:
Average Adjusted Gross Income (AGI) in 2020: $60,489 (Individual Income Tax Returns)
Here:
$60,489
State:
$71,087
Salary/wage: $43,428 (reported on 79.6% of returns)
Here:
$43,428
State:
$57,361
(% of AGI for various income ranges: 1364.4% for AGIs below $25k, 3768.2% for AGIs $25k-50k, 6636.7% for AGIs $50k-75k, 9675.0% for AGIs $75k-100k, 27245.0% for AGIs $100k-200k)
Taxable interest for individuals: $916 (reported on 35.2% of returns)
This zip code:
$916
Iowa:
$1,633
(% of AGI for various income ranges: 8.9% for AGIs below $25k, 14.5% for AGIs $25k-50k, 33.3% for AGIs $50k-75k, 60.0% for AGIs $75k-100k, 530.0% for AGIs $100k-200k)
Ordinary dividends: $2,573 (reported on 20.4% of returns)
Here:
$2,573
State:
$5,432
(% of AGI for various income ranges: 38.2% for AGIs $25k-50k, 100.0% for AGIs $75k-100k, 1005.0% for AGIs $100k-200k)
Net capital gain/loss in AGI: +$7,440 (reported on 18.5% of returns)
Here:
+$7,440
State:
+$15,243
(% of AGI for various income ranges: 58.9% for AGIs below $25k, 70.0% for AGIs $50k-75k, 3245.0% for AGIs $100k-200k)
Profit/loss from business: +$8,667 (reported on 11.1% of returns)
Here:
+$8,667
State:
+$11,763
(% of AGI for various income ranges: 225.5% for AGIs $25k-50k, 680.0% for AGIs $75k-100k)
Taxable individual retirement arrangement distribution: $15,329 (reported on 13.0% of returns)
51638:
$15,329
Iowa:
$17,324
(% of AGI for various income ranges: 580.9% for AGIs $25k-50k, 1085.0% for AGIs $75k-100k)
Earned income credit: $2,250 (reported on 14.8% of returns)
Here:
$2,250
State:
$2,195
(% of AGI for various income ranges: 121.1% for AGIs below $25k, 64.5% for AGIs $25k-50k)
Percentage of individuals using paid preparers for their 2020 taxes: 98.1%
Here:
98%
State:
95%
(% for various income ranges: 100.0% for AGIs below $25k, 93.8% for AGIs $25k-50k, 100.0% for AGIs $50k-75k, 100.0% for AGIs $75k-100k, 100.0% for AGIs $100k-200k)
Averages for the 2012 tax year for zip code 51638, filed in 2013:
Average Adjusted Gross Income (AGI) in 2012: $51,898 (Individual Income Tax Returns)
Here:
$51,898
State:
$58,860
Salary/wage: $37,400 (reported on 83.9% of returns)
Here:
$37,400
State:
$46,659
(% of AGI for various income ranges: 72.1% for AGIs below $25k, 79.1% for AGIs $25k-50k, 73.2% for AGIs $50k-75k, 65.4% for AGIs $75k-100k, 38.5% for AGIs $100k-200k)
Taxable interest for individuals: $809 (reported on 37.1% of returns)
This zip code:
$809
Iowa:
$1,537
(% of AGI for various income ranges: 1.6% for AGIs below $25k, 0.4% for AGIs $25k-50k, 0.3% for AGIs $50k-75k, 0.5% for AGIs $75k-100k, 0.7% for AGIs $100k-200k)
Ordinary dividends: $1,458 (reported on 19.4% of returns)
Here:
$1,458
State:
$4,542
(% of AGI for various income ranges: 0.6% for AGIs below $25k, 0.6% for AGIs $25k-50k, 0.2% for AGIs $50k-75k, 0.3% for AGIs $75k-100k, 0.9% for AGIs $100k-200k)
Net capital gain/loss in AGI: +$2,667 (reported on 14.5% of returns)
Here:
+$2,667
State:
+$11,802
(% of AGI for various income ranges: 4.2% for AGIs below $25k, 0.4% for AGIs $50k-75k, 0.9% for AGIs $100k-200k)
Profit/loss from business: +$7,175 (reported on 12.9% of returns)
Here:
+$7,175
State:
+$10,509
Taxable individual retirement arrangement distribution: $9,014 (reported on 11.3% of returns)
51638:
$9,014
Iowa:
$11,773
Total itemized deductions: $17,990 (16% of AGI, reported on 16.1% of returns)
Here:
$17,990
State:
$21,278
Here:
16.3% of AGI
State:
18.9% of AGI
(% of AGI for various income ranges: 7.1% for AGIs $50k-75k, 9.8% for AGIs $75k-100k, 6.9% for AGIs $100k-200k)
Charity contributions: $4,243 (reported on 11.3% of returns)
Here:
$4,243
State:
$4,044
Taxes paid: $7,180 (reported on 16.1% of returns)
51638:
$7,180
State:
$8,846
(% of AGI for various income ranges: 2.0% for AGIs $50k-75k, 2.7% for AGIs $75k-100k, 3.8% for AGIs $100k-200k)
Earned income credit: $1,800 (reported on 17.7% of returns)
Here:
$1,800
State:
$2,098
(% of AGI for various income ranges: 5.2% for AGIs below $25k, 1.1% for AGIs $25k-50k)
Percentage of individuals using paid preparers for their 2012 taxes: 71.0%
Here:
71%
State:
65%
(% for various income ranges: 61.9% for AGIs below $25k, 68.8% for AGIs $25k-50k, 75.0% for AGIs $50k-75k, 83.3% for AGIs $75k-100k, 85.7% for AGIs $100k-200k)
Averages for the 2004 tax year for zip code 51638, filed in 2005:
Average Adjusted Gross Income (AGI) in 2004: $37,904 (Individual Income Tax Returns)
Here:
$37,904
State:
$43,875
Salary/wage: $33,516 (reported on 84.5% of returns)
Here:
$33,516
State:
$38,265
(% of AGI for various income ranges: 88.2% for AGIs below $10k, 72.6% for AGIs $10k-25k, 77.7% for AGIs $25k-50k, 78.1% for AGIs $50k-75k, 79.1% for AGIs $75k-100k, 55.6% for AGIs over 100k)
Taxable interest for individuals: $1,162 (reported on 54.2% of returns)
This zip code:
$1,162
Iowa:
$1,768
(% of AGI for various income ranges: 2.6% for AGIs below $10k, 3.8% for AGIs $10k-25k, 1.3% for AGIs $25k-50k, 2.2% for AGIs $50k-75k, 0.5% for AGIs $75k-100k, 0.7% for AGIs over 100k)
Taxable dividends: $566 (reported on 32.2% of returns)
Here:
$566
State:
$2,510
(% of AGI for various income ranges: 0.9% for AGIs below $10k, 0.9% for AGIs $10k-25k, 0.5% for AGIs $25k-50k, 0.5% for AGIs $50k-75k, 0.1% for AGIs $75k-100k, 0.5% for AGIs over 100k)
Net capital gain/loss: +$1,049 (reported on 20.0% of returns)
Here:
+$1,049
State:
+$6,139
(% of AGI for various income ranges: 0.2% for AGIs below $10k, 0.1% for AGIs $10k-25k, 0.2% for AGIs $25k-50k, 0.2% for AGIs $50k-75k, 3.1% for AGIs over 100k)
Profit/loss from business: +$6,794 (reported on 15.8% of returns)
Here:
+$6,794
State:
+$8,574
(% of AGI for various income ranges: -0.2% for AGIs below $10k, 7.3% for AGIs $10k-25k, 5.3% for AGIs $25k-50k, 1.4% for AGIs $50k-75k, -0.1% for AGIs $75k-100k)
Profit/loss from farming: +$12,882 (reported on 13.8% of returns)
Here:
+$12,882
State:
-$74
(% of AGI for various income ranges: -0.7% for AGIs $10k-25k, 5.1% for AGIs $25k-50k, 3.6% for AGIs $50k-75k, 16.7% for AGIs over 100k)
IRA payment deduction: $2,900 (reported on 3.3% of returns)
51638:
$2,900
Iowa:
$2,970
Total itemized deductions: $13,817 (22% of AGI, reported on 17.8% of returns)
Here:
$13,817
State:
$16,976
Here:
22.3% of AGI
State:
20.8% of AGI
(% of AGI for various income ranges: 10.8% for AGIs $10k-25k, 4.6% for AGIs $25k-50k, 4.8% for AGIs $50k-75k, 7.1% for AGIs $75k-100k, 11.1% for AGIs over 100k)
Charity contributions deductions: $2,141 (3% of AGI, reported on 13.8% of returns)
Here:
$2,141
State:
$3,089
Here:
3.4% of AGI
State:
3.6% of AGI
(% of AGI for various income ranges: 0.5% for AGIs $10k-25k, 0.7% for AGIs $25k-50k, 0.5% for AGIs $50k-75k, 0.9% for AGIs $75k-100k, 1.9% for AGIs over 100k)
Total tax: $4,445 (reported on 78.7% of returns)
51638:
$4,445
State:
$6,177
(% of AGI for various income ranges: 3.9% for AGIs below $10k, 4.7% for AGIs $10k-25k, 7.7% for AGIs $25k-50k, 9.0% for AGIs $50k-75k, 10.5% for AGIs $75k-100k, 16.3% for AGIs over 100k)
Earned income credit: $1,493 (reported on 11.9% of returns)
Here:
$1,493
State:
$1,540
Percentage of individuals using paid preparers for their 2004 taxes: 78.3%
Here:
78%
State:
70%
(% for various income ranges: 62.9% for AGIs below $10k, 80.7% for AGIs $10k-25k, 81.2% for AGIs $25k-50k, 81.0% for AGIs $50k-75k, 85.4% for AGIs $75k-100k, 84.6% for AGIs over 100k)
Likely homosexual households (counted as self-reported same-sex unmarried-partner households)
Lesbian couples: 0.0% of all households
Gay men: 0.7% of all households
Household received Food Stamps/SNAP in the past 12 months: 28 Household did not receive Food Stamps/SNAP in the past 12 months: 602
Women who had a birth in the past 12 months: 12 (12 now married, 0 unmarried) Women who did not have a birth in the past 12 months: 255 (89 now married, 166 unmarried)
Housing units in zip code 51638 with a mortgage: 216 (14 second mortgage, 14 both second mortgage and home equity loan) Houses without a mortgage: 3
Median monthly owner costs for units with a mortgage: $916 Median monthly owner costs for units without a mortgage: $471
Residents with income below the poverty level in 2022:
This zip code:
8.5%
Whole state:
11.0%
Residents with income below 50% of the poverty level in 2022:
This zip code:
3.7%
Whole state:
5.5%
Median number of rooms in houses and condos:
Here:
6.9
State:
6.8
Median number of rooms in apartments:
Here:
6.0
State:
4.2
Notable locations in this zip code not listed on our city pages
Notable locations in zip code 51638: North Grove (A), Franklin Grove (B), Essex Elevator Incorporated Elevator (C), Essex (D), Essex Golf and Recreation (E), Essex Police Department (F), Essex Fire Department (G), Essex City Hall (H), Essex Public Library (I). Display/hide their locations on the map
Churches in zip code 51638 include: Fremont Church (A), Saint Johns Lutheran Church (B), Faith Covenant Church (C), Presbyterian Church (D). Display/hide their locations on the map
Cemeteries: Saint John Evangelical Lutheran Cemetery (1), Essex Cemetery (2), Franklin Cemetery (3), Hadden Cemetery (4). Display/hide their locations on the map
Size of family households: 195 2-persons, 65 3-persons, 28 4-persons, 28 5-persons, 5 6-persons, 7 7-or-more-persons
Size of nonfamily households: 280 1-person, 13 2-persons, 4 3-persons
99 married couples with children.
30 single-parent households (28 men, 2 women).
98.4% of residents of 51638 zip code speak English at home.
1.4% of residents speak Spanish at home (89% very well, 11% well).
0.4% of residents speak other language at home (60% very well, 40% not well).
Foreign born population: 23 (1.7%) (18.7% of them are naturalized citizens)
This zip code:
1.7%
Whole state:
6.0%
59%Guyana
9%Scotland
9%Algeria
5%Sweden
5%United Kingdom, excluding England and Scotland
5%Honduras
26%German
22%Swedish
11%English
11%American
6%Irish
3%European
3%Italian
Year of entry for the foreign-born population
62010 or later
12000 to 2009
121990 to 1999
1Before 1990
Facilities with environmental interests located in this zip code:
ESSEX JUNIOR-SENIOR HIGH SCHOOL (111 FORBES ST in ESSEX, IA)
(Geographic Names Information System) (National Center for Education Statistics) - STATE ID-732113 172 Conditionally Exempt Small Quantity Generators, less than 100 kg/month of hazardous waste (Resource Conservation and Recovery Act (tracking hazardous waste)) - ICIS-, ENFORCEMENT/COMPLIANCE ACTIVITY Organizations: ESSEX COMMUNITY SCHOOL DISTRICT (CONTACT/OPERATOR)
, ESSEX COMM SCHOOL DISTRICT (SCHOOL DISTRICT)
ESSEX ELEMENTARY SCHOOL (111 FORBES ST in ESSEX, IA)
(National Center for Education Statistics) - STATE ID-732113 409 Organizations: ESSEX COMM SCHOOL DISTRICT (SCHOOL DISTRICT)
ESSEX C.S.D. (111 FORBES STREET in ESSEX, IA)
COMPLIANCE ACTIVITY (Tracking inspections of insecticide, fungicide, and rodenticide, and toxic substances) Alternative names: ESSEX CSD
ESSEX CITY OF STP (CITY CLERK in ESSEX, IA)
National Pollutant Discharge Elimination System NON-MAJOR (Tracking pollutant discharge elimination systems) - permit Business SIC classification: SEWERAGE SYSTEMS Organizations: CITY OF ESSEX (CONTACT/OWNER)
JOHNSON BROS-MILL (NO STREET ADDRESS in ESSEX, IA)
AIR MINOR (AIRS/AFS) Business SIC classification: NONCLASSIFIABLE ESTABLISHMENTS
ESSEX ELEVATOR INCORPORATED (411 NORTH STREET in ESSEX, IA)
COMPLIANCE ACTIVITY (Tracking inspections of insecticide, fungicide, and rodenticide, and toxic substances) Alternative names: SOUTH ELEVATOR
ESSEX ELEVATOR INC (HWY 48, BOX 119 in ESSEX, IA)
COMPLIANCE ACTIVITY (Tracking inspections of insecticide, fungicide, and rodenticide, and toxic substances)
ESSEX SCHOOLS (RR in ESSEX, IA)
COMPLIANCE ACTIVITY (Tracking inspections of insecticide, fungicide, and rodenticide, and toxic substances)
JOHNSON BROTHERS MILLS INCORPORATED (706 RAILROAD STREET in ESSEX, IA)
COMPLIANCE ACTIVITY (Tracking inspections of insecticide, fungicide, and rodenticide, and toxic substances)
Housing units lacking complete plumbing facilities: 3.9% Housing units lacking complete kitchen facilities: 5.1%
47.1%Utility gas
27.5%Bottled, tank, or LP gas
24.2%Electricity
0.7%Other fuel
Population in 1990: 1,433. Population change in the 1990s: +187 (+13.0%).
Place of birth for U.S.-born residents:
This state: 767
Northeast: 2
Midwest: 418
South: 80
West: 54
67% of the 51638 zip code residents lived in the same house 5 years ago. Out of people who lived in different houses, 60% lived in this county. Out of people who lived in different counties, 50% lived in Iowa.
84% of the 51638 zip code residents lived in the same house 1 year ago. Out of people who lived in different houses, 58% moved from this county. Out of people who lived in different houses, 21% moved from different county within same state. Out of people who lived in different houses, 17% moved from different state.
Private vs. public school enrollment:
Students in private schools in grades 1 to 8 (elementary and middle school): 4
Here:
6.6%
Iowa:
10.6%
Students in private schools in grades 9 to 12 (high school): 6
Here:
14.4%
Iowa:
7.9%
Students in private undergraduate colleges:
Here:
0.0%
Iowa:
23.9%
Occupation by median earnings in the past 12 months ($)
97,773Business and financial operations occupations
92,948Health diagnosing and treating practitioners and other technical occupations
59,633Management occupations
54,306Installation, maintenance, and repair occupations
53,153Construction and extraction occupations
52,641Community and social service occupations
Top industries in this zip code by the number of employees in 2005:


+$12,882
-$74
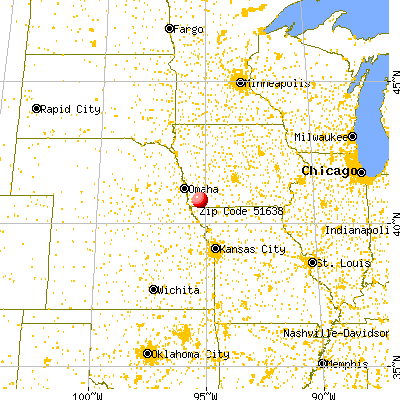
(% of AGI for various income ranges: -0.7% for AGIs $10k-25k, 5.1% for AGIs $25k-50k, 3.6% for AGIs $50k-75k, 16.7% for AGIs over 100k) Nearest zip codes: 51601, 51645, 51656, 51636, 51566, 51639.


