Estimated zip code population in 2022: 2,672 Zip code population in 2010: 2,127 Zip code population in 2000: 2,049
Houses and condos: 968 Renter-occupied apartments: 194
% of renters here:
20%
State:
28%
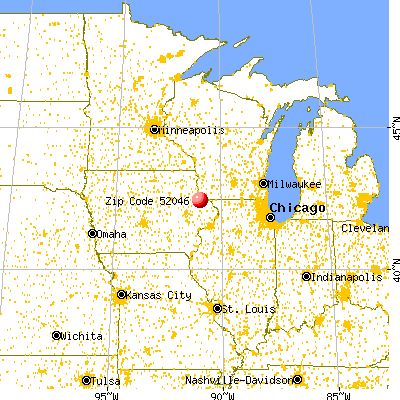
March 2022 cost of living index in zip code 52046: 83.7 (less than average, U.S. average is 100)
Land area: 46.0 sq. mi. Water area: 0.0 sq. mi.
Population density: 58 people per square mile
(very low).
OSM Map
General Map
Google Map
MSN Map
OSM Map
General Map
Google Map
MSN Map
OSM Map
General Map
Google Map
MSN Map
OSM Map
General Map
Google Map
MSN Map
Please wait while loading the map...
Real estate property taxes paid for housing units in 2022:
This zip code:
1.2% ($3,192)
Iowa:
1.4% ($2,724)
Median real estate property taxes paid for housing units with mortgages in 2022: $2,932 (1.0%) Median real estate property taxes paid for housing units with no mortgage in 2022: $3,393 (1.4%)
Business Search- 14 Million verified businesses
Males: 1,268
(47.5%)
Females: 1,404
(52.5%)
For population 25 years and over in 52046:
High school or higher: 89.8%
Bachelor's degree or higher: 29.3%
Graduate or professional degree: 11.3%
Unemployed: 4.2%
Mean travel time to work (commute): 22.3 minutes
For population 15 years and over in 52046:
Never married: 21.7%
Now married: 70.8%
Separated: 0.1%
Widowed: 2.8%
Divorced: 4.6%
Zip code 52046 compared to state average:
Black race population percentage significantly below state average.
Foreign-born population percentage below state average.
Length of stay since moving in significantly above state average.
Estimated median house/condo value in 2022: $265,753
52046:
$265,753
Iowa:
$194,600
According to our research of Iowa and other state lists, there were 2 registered sex offenders living in 52046 zip code as of June 16, 2024. The ratio of all residents to sex offenders in zip code 52046 is 1,090 to 1. The ratio of registered sex offenders to all residents in this zip code is lower than the state average.
Median resident age:
This zip code:
38.4 years
Iowa median age:
38.9 years
Average household size:
This zip code:
2.8 people
Iowa:
2.3 people
Averages for the 2020 tax year for zip code 52046, filed in 2021:
Average Adjusted Gross Income (AGI) in 2020: $66,746 (Individual Income Tax Returns)
Here:
$66,746
State:
$71,087
Salary/wage: $54,742 (reported on 88.4% of returns)
Here:
$54,742
State:
$57,361
(% of AGI for various income ranges: 1555.0% for AGIs below $25k, 4206.1% for AGIs $25k-50k, 7503.8% for AGIs $50k-75k, 9392.0% for AGIs $75k-100k, 16240.0% for AGIs $100k-200k)
Taxable interest for individuals: $1,209 (reported on 50.0% of returns)
This zip code:
$1,209
Iowa:
$1,633
(% of AGI for various income ranges: 36.7% for AGIs below $25k, 34.8% for AGIs $25k-50k, 86.9% for AGIs $50k-75k, 62.0% for AGIs $75k-100k, 192.7% for AGIs $100k-200k)
Ordinary dividends: $1,933 (reported on 21.4% of returns)
Here:
$1,933
State:
$5,432
(% of AGI for various income ranges: 24.4% for AGIs below $25k, 25.2% for AGIs $25k-50k, 43.8% for AGIs $50k-75k, 43.0% for AGIs $75k-100k, 238.2% for AGIs $100k-200k)
Net capital gain/loss in AGI: +$9,183 (reported on 20.5% of returns)
Here:
+$9,183
State:
+$15,243
(% of AGI for various income ranges: 77.2% for AGIs below $25k, 54.8% for AGIs $25k-50k, 154.6% for AGIs $50k-75k, 259.0% for AGIs $75k-100k, 1007.3% for AGIs $100k-200k)
Profit/loss from business: +$5,547 (reported on 13.4% of returns)
Here:
+$5,547
State:
+$11,763
(% of AGI for various income ranges: 30.0% for AGIs below $25k, 54.8% for AGIs $25k-50k, 124.6% for AGIs $50k-75k, 445.5% for AGIs $100k-200k)
Taxable individual retirement arrangement distribution: $8,457 (reported on 6.2% of returns)
52046:
$8,457
Iowa:
$17,324
(% of AGI for various income ranges: 154.8% for AGIs $25k-50k, 236.0% for AGIs $75k-100k)
Total itemized deductions: $34,400 (reported on 3.6% of returns)
Here:
$34,400
State:
$33,775
(% of AGI for various income ranges: 1250.9% for AGIs $100k-200k)
Charity contributions: $6,325 (reported on 3.6% of returns)
Here:
$6,325
State:
$13,075
(% of AGI for various income ranges: 230.0% for AGIs $100k-200k)
Taxes paid: $6,680 (reported on 4.5% of returns)
52046:
$6,680
State:
$7,704
(% of AGI for various income ranges: 50.6% for AGIs below $25k, 220.9% for AGIs $100k-200k)
Earned income credit: $2,300 (reported on 8.0% of returns)
Here:
$2,300
State:
$2,195
(% of AGI for various income ranges: 65.0% for AGIs below $25k, 39.1% for AGIs $25k-50k)
Percentage of individuals using paid preparers for their 2020 taxes: 96.4%
Here:
96%
State:
95%
(% for various income ranges: 96.6% for AGIs below $25k, 96.6% for AGIs $25k-50k, 95.0% for AGIs $50k-75k, 100.0% for AGIs $75k-100k, 94.4% for AGIs $100k-200k, 100.0% for AGIs over 200k)
Averages for the 2012 tax year for zip code 52046, filed in 2013:
Average Adjusted Gross Income (AGI) in 2012: $57,032 (Individual Income Tax Returns)
Here:
$57,032
State:
$58,860
Salary/wage: $45,633 (reported on 88.5% of returns)
Here:
$45,633
State:
$46,659
(% of AGI for various income ranges: 82.7% for AGIs below $25k, 85.6% for AGIs $25k-50k, 79.3% for AGIs $50k-75k, 76.7% for AGIs $75k-100k, 71.6% for AGIs $100k-200k, 37.8% for AGIs over 200k)
Taxable interest for individuals: $1,009 (reported on 53.8% of returns)
This zip code:
$1,009
Iowa:
$1,537
(% of AGI for various income ranges: 3.4% for AGIs below $25k, 1.2% for AGIs $25k-50k, 0.6% for AGIs $50k-75k, 1.0% for AGIs $75k-100k, 0.6% for AGIs $100k-200k, 0.6% for AGIs over 200k)
Ordinary dividends: $1,664 (reported on 21.2% of returns)
Here:
$1,664
State:
$4,542
(% of AGI for various income ranges: 1.6% for AGIs below $25k, 0.7% for AGIs $25k-50k, 0.6% for AGIs $50k-75k, 0.4% for AGIs $75k-100k, 1.1% for AGIs $100k-200k)
Net capital gain/loss in AGI: +$8,490 (reported on 19.2% of returns)
Here:
+$8,490
State:
+$11,802
(% of AGI for various income ranges: 1.9% for AGIs below $25k, 1.6% for AGIs $25k-50k, 1.9% for AGIs $50k-75k, 3.3% for AGIs $75k-100k, 7.5% for AGIs $100k-200k)
Profit/loss from business: +$7,100 (reported on 13.5% of returns)
Here:
+$7,100
State:
+$10,509
(% of AGI for various income ranges: 2.4% for AGIs below $25k, 2.4% for AGIs $25k-50k, 1.4% for AGIs $50k-75k, 4.7% for AGIs $75k-100k)
Taxable individual retirement arrangement distribution: $5,020 (reported on 9.6% of returns)
52046:
$5,020
Iowa:
$11,773
(% of AGI for various income ranges: 5.8% for AGIs below $25k, 0.8% for AGIs $50k-75k, 1.7% for AGIs $75k-100k)
Total itemized deductions: $19,358 (19% of AGI, reported on 29.8% of returns)
Here:
$19,358
State:
$21,278
Here:
19.2% of AGI
State:
18.9% of AGI
(% of AGI for various income ranges: 11.9% for AGIs below $25k, 7.3% for AGIs $25k-50k, 9.1% for AGIs $50k-75k, 8.4% for AGIs $75k-100k, 13.8% for AGIs $100k-200k, 10.8% for AGIs over 200k)
Charity contributions: $3,081 (reported on 25.0% of returns)
Here:
$3,081
State:
$4,044
(% of AGI for various income ranges: 1.1% for AGIs below $25k, 0.7% for AGIs $25k-50k, 0.7% for AGIs $50k-75k, 1.1% for AGIs $75k-100k, 1.7% for AGIs $100k-200k, 2.6% for AGIs over 200k)
Taxes paid: $7,858 (reported on 29.8% of returns)
52046:
$7,858
State:
$8,846
(% of AGI for various income ranges: 1.7% for AGIs below $25k, 1.8% for AGIs $25k-50k, 3.0% for AGIs $50k-75k, 3.4% for AGIs $75k-100k, 5.9% for AGIs $100k-200k, 6.9% for AGIs over 200k)
Earned income credit: $2,030 (reported on 9.6% of returns)
Here:
$2,030
State:
$2,098
(% of AGI for various income ranges: 2.9% for AGIs below $25k, 0.9% for AGIs $25k-50k)
Percentage of individuals using paid preparers for their 2012 taxes: 77.9%
Here:
78%
State:
65%
(% for various income ranges: 75.8% for AGIs below $25k, 71.4% for AGIs $25k-50k, 84.2% for AGIs $50k-75k, 76.9% for AGIs $75k-100k, 88.9% for AGIs $100k-200k, 100.0% for AGIs over 200k)
Averages for the 2004 tax year for zip code 52046, filed in 2005:
Average Adjusted Gross Income (AGI) in 2004: $40,127 (Individual Income Tax Returns)
Here:
$40,127
State:
$43,875
Salary/wage: $35,739 (reported on 86.2% of returns)
Here:
$35,739
State:
$38,265
(% of AGI for various income ranges: 100.2% for AGIs below $10k, 75.7% for AGIs $10k-25k, 80.6% for AGIs $25k-50k, 84.3% for AGIs $50k-75k, 85.2% for AGIs $75k-100k, 45.5% for AGIs over 100k)
Taxable interest for individuals: $1,423 (reported on 66.3% of returns)
This zip code:
$1,423
Iowa:
$1,768
(% of AGI for various income ranges: 10.7% for AGIs below $10k, 5.4% for AGIs $10k-25k, 2.2% for AGIs $25k-50k, 1.0% for AGIs $50k-75k, 1.2% for AGIs $75k-100k, 3.7% for AGIs over 100k)
Taxable dividends: $983 (reported on 26.0% of returns)
Here:
$983
State:
$2,510
(% of AGI for various income ranges: 2.7% for AGIs below $10k, 1.5% for AGIs $10k-25k, 0.9% for AGIs $25k-50k, 0.3% for AGIs $50k-75k, 0.6% for AGIs $75k-100k)
Net capital gain/loss: +$5,498 (reported on 23.3% of returns)
Here:
+$5,498
State:
+$6,139
(% of AGI for various income ranges: 0.0% for AGIs below $10k, 4.2% for AGIs $10k-25k, 2.6% for AGIs $25k-50k, 2.4% for AGIs $50k-75k, 1.8% for AGIs $75k-100k, 6.9% for AGIs over 100k)
Profit/loss from business: +$4,576 (reported on 14.4% of returns)
Here:
+$4,576
State:
+$8,574
(% of AGI for various income ranges: 3.7% for AGIs below $10k, 4.9% for AGIs $10k-25k, 2.9% for AGIs $25k-50k, 0.8% for AGIs $50k-75k, 0.1% for AGIs $75k-100k)
Profit/loss from farming: +$781 (reported on 11.5% of returns)
Here:
+$781
State:
-$74
(% of AGI for various income ranges: -31.4% for AGIs below $10k, -4.2% for AGIs $10k-25k, 2.8% for AGIs $25k-50k, 0.8% for AGIs $50k-75k)
IRA payment deduction: $2,590 (reported on 4.3% of returns)
52046:
$2,590
Iowa:
$2,970
Total itemized deductions: $14,830 (23% of AGI, reported on 29.6% of returns)
Here:
$14,830
State:
$16,976
Here:
22.8% of AGI
State:
20.8% of AGI
(% of AGI for various income ranges: 8.5% for AGIs $10k-25k, 9.1% for AGIs $25k-50k, 11.4% for AGIs $50k-75k, 14.7% for AGIs $75k-100k, 13.1% for AGIs over 100k)
Charity contributions deductions: $1,757 (3% of AGI, reported on 26.1% of returns)
Here:
$1,757
State:
$3,089
Here:
2.6% of AGI
State:
3.6% of AGI
(% of AGI for various income ranges: 1.0% for AGIs $10k-25k, 0.7% for AGIs $25k-50k, 1.2% for AGIs $50k-75k, 1.7% for AGIs $75k-100k, 1.5% for AGIs over 100k)
Total tax: $3,886 (reported on 80.7% of returns)
52046:
$3,886
State:
$6,177
(% of AGI for various income ranges: 3.1% for AGIs below $10k, 4.6% for AGIs $10k-25k, 6.7% for AGIs $25k-50k, 6.5% for AGIs $50k-75k, 9.1% for AGIs $75k-100k, 13.9% for AGIs over 100k)
Earned income credit: $1,468 (reported on 8.4% of returns)
Here:
$1,468
State:
$1,540
Percentage of individuals using paid preparers for their 2004 taxes: 82.0%
Here:
82%
State:
70%
(% for various income ranges: 73.5% for AGIs below $10k, 85.0% for AGIs $10k-25k, 83.6% for AGIs $25k-50k, 81.8% for AGIs $50k-75k, 75.4% for AGIs $75k-100k, 93.9% for AGIs over 100k)
Household received Food Stamps/SNAP in the past 12 months: 26 Household did not receive Food Stamps/SNAP in the past 12 months: 943
Women who had a birth in the past 12 months: 59 (51 now married, 8 unmarried) Women who did not have a birth in the past 12 months: 531 (301 now married, 229 unmarried)
Housing units in zip code 52046 with a mortgage: 441 (111 second mortgage, 110 both second mortgage and home equity loan) Houses without a mortgage: 5
Median monthly owner costs for units with a mortgage: $1,680 Median monthly owner costs for units without a mortgage: $658
Residents with income below the poverty level in 2022:
This zip code:
3.4%
Whole state:
11.0%
Residents with income below 50% of the poverty level in 2022:
This zip code:
0.8%
Whole state:
5.5%
Median number of rooms in houses and condos:
Here:
7.7
State:
6.8
Median number of rooms in apartments:
Here:
4.6
State:
4.2
Notable locations in this zip code not listed on our city pages
Notable locations in zip code 52046: Farley Racetrack (A), Farley (B), Reiff Ambulance Service (C), Dubuque County Library (D), Farley Volunteer Fire Department (E). Display/hide their locations on the map
Cemeteries: Saint Josephs Cemetery (1), Fairview Cemetery (2), Johns Creek Cemetery (3), Hogan Cemetery (4), McGee Cemetery (5). Display/hide their locations on the map
In group quarters: 4 (-1 institutionalized population)
Size of family households: 404 2-persons, 126 3-persons, 104 4-persons, 111 5-persons, 19 6-persons, 20 7-or-more-persons
Size of nonfamily households: 147 1-person, 24 2-persons, 2 3-persons
662 married couples with children.
74 single-parent households (16 men, 58 women).
95.3% of residents of 52046 zip code speak English at home.
4.0% of residents speak Spanish at home (100% very well).
0.7% of residents speak other Indo-European language at home (100% very well).
Foreign born population: 76 (2.9%) (39.7% of them are naturalized citizens)
This zip code:
2.9%
Whole state:
6.0%
97%Honduras
55%German
13%American
8%Irish
3%English
1%Swiss
1%European
1%British
Year of entry for the foreign-born population
322010 or later
02000 to 2009
01990 to 1999
45Before 1990
Facilities with environmental interests located in this zip code:
DREXLER ELEMENTARY SCHOOL (3RD AVE NE in FARLEY, IA)
(National Center for Education Statistics) - STATE ID-316961 445 Organizations: WESTERN DUBUQUE COMM SCHOOL DISTRICT (SCHOOL DISTRICT)
DREXLER MIDDLE SCHOOL (3RD AVENE in FARLEY, IA)
(National Center for Education Statistics) - STATE ID-316961 209 Organizations: WESTERN DUBUQUE COMM SCHOOL DISTRICT (SCHOOL DISTRICT)
CROP PRODUCTION SERVICES (11155 HOLY CROSS in FARLEY, IA)
(Resource Conservation and Recovery Act (tracking hazardous waste))
SWISS VALLEY FARMS CO (HWY 20 W in FARLEY, IA)
COMPLIANCE ACTIVITY (Tracking inspections of insecticide, fungicide, and rodenticide, and toxic substances)
SIMON TRUCKING (201 1ST ST NW in FARLEY, IA)
COMPLIANCE ACTIVITY (Tracking inspections of insecticide, fungicide, and rodenticide, and toxic substances)
Housing units lacking complete plumbing facilities: 0.8%
59.9%Utility gas
19.1%Bottled, tank, or LP gas
12.0%Electricity
4.4%Other fuel
2.7%Wood
1.8%Fuel oil, kerosene, etc.
Population in 1990: 2,120.
Place of birth for U.S.-born residents:
This state: 2,273
Northeast: 6
Midwest: 281
South: 6
West: 25
72% of the 52046 zip code residents lived in the same house 5 years ago. Out of people who lived in different houses, 80% lived in this county. Out of people who lived in different counties, 50% lived in Iowa.
97% of the 52046 zip code residents lived in the same house 1 year ago. Out of people who lived in different houses, 26% moved from this county. Out of people who lived in different houses, 57% moved from different county within same state. Out of people who lived in different houses, 30% moved from different state.
Private vs. public school enrollment:
Students in private schools in grades 1 to 8 (elementary and middle school): 85
Here:
25.8%
Iowa:
10.6%
Students in private schools in grades 9 to 12 (high school): 36
Here:
20.4%
Iowa:
7.9%
Students in private undergraduate colleges: 18
Here:
36.2%
Iowa:
23.9%
Occupation by median earnings in the past 12 months ($)
110,566Health diagnosing and treating practitioners and other technical occupations
76,214Business and financial operations occupations
72,769Transportation occupations
68,305Architecture and engineering occupations
64,716Installation, maintenance, and repair occupations
53,371Management occupations
Top industries in this zip code by the number of employees in 2005:
Other Services (except Public Administration): Religious Organizations (50-99 employees: 1 establishment)
Wholesale Trade: Grain and Field Bean Merchant Wholesalers (10-19: 1)
Wholesale Trade: Farm and Garden Machinery and Equipment Merchant Wholesalers (10-19: 1)
Construction: Poured Concrete Foundation and Structure Contractors (5-9: 2)
Construction: Site Preparation Contractors (5-9: 1, 1-4: 1)
People in group quarters in 2010:
3 people in other noninstitutional facilities
Fatal accident statistics in 2014:
Fatal accident count: 1
Vehicles involved in fatal accidents: 1
Fatal accidents caused by drunken drivers: 1
Fatalities: 1
Persons involved in fatal accidents: 3
Pedestrians involved in fatal accidents: 1
Fatal accident statistics in 2011:
Fatal accident count: 1
Vehicles involved in fatal accidents: 1
Fatal accidents caused by drunken drivers: 0
Fatalities: 1
Persons involved in fatal accidents: 1
Pedestrians involved in fatal accidents: 0
Home Mortgage Disclosure Act Aggregated Statistics For Year 2009 (Based on 4 partial tracts)
A) FHA, FSA/RHS & VA Home Purchase Loans
B) Conventional Home Purchase Loans
C) Refinancings
D) Home Improvement Loans
F) Non-occupant Loans on < 5 Family Dwellings (A B C & D)
G) Loans On Manufactured Home Dwelling (A B C & D)
Number
Average Value
Number
Average Value
Number
Average Value
Number
Average Value
Number
Average Value
Number
Average Value
LOANS ORIGINATED
12
$154,952
39
$153,428
224
$156,115
8
$62,095
6
$272,932
1
$5,980
APPLICATIONS APPROVED, NOT ACCEPTED
0
$0
1
$154,510
4
$127,502
0
$0
0
$0
0
$0
APPLICATIONS DENIED
3
$165,853
2
$132,475
16
$145,206
1
$26,930
1
$26,450
1
$8,880
APPLICATIONS WITHDRAWN
0
$0
2
$238,980
23
$132,477
0
$0
0
$0
0
$0
FILES CLOSED FOR INCOMPLETENESS
0
$0
0
$0
1
$58,610
0
$0
0
$0
0
$0
Aggregated Statistics For Year 2008 (Based on 4 partial tracts)
A) FHA, FSA/RHS & VA Home Purchase Loans
B) Conventional Home Purchase Loans
C) Refinancings
D) Home Improvement Loans
E) Loans on Dwellings For 5+ Families
F) Non-occupant Loans on < 5 Family Dwellings (A B C & D)
G) Loans On Manufactured Home Dwelling (A B C & D)
Number
Average Value
Number
Average Value
Number
Average Value
Number
Average Value
Number
Average Value
Number
Average Value
Number
Average Value
LOANS ORIGINATED
9
$120,070
49
$141,518
90
$157,264
7
$39,177
1
$192,480
6
$139,235
1
$41,790
APPLICATIONS APPROVED, NOT ACCEPTED
0
$0
2
$116,990
5
$107,414
1
$10,600
0
$0
0
$0
0
$0
APPLICATIONS DENIED
0
$0
3
$118,107
18
$136,107
2
$76,850
0
$0
1
$30,480
1
$22,990
APPLICATIONS WITHDRAWN
1
$92,200
4
$147,345
11
$159,231
0
$0
0
$0
0
$0
0
$0
FILES CLOSED FOR INCOMPLETENESS
0
$0
1
$78,590
2
$142,745
0
$0
0
$0
0
$0
0
$0
Aggregated Statistics For Year 2007 (Based on 4 partial tracts)
A) FHA, FSA/RHS & VA Home Purchase Loans
B) Conventional Home Purchase Loans
C) Refinancings
D) Home Improvement Loans
F) Non-occupant Loans on < 5 Family Dwellings (A B C & D)
G) Loans On Manufactured Home Dwelling (A B C & D)
Number
Average Value
Number
Average Value
Number
Average Value
Number
Average Value
Number
Average Value
Number
Average Value
LOANS ORIGINATED
3
$136,803
65
$134,166
62
$129,521
11
$44,896
6
$133,900
2
$31,475
APPLICATIONS APPROVED, NOT ACCEPTED
0
$0
3
$183,773
7
$130,820
1
$23,010
0
$0
0
$0
APPLICATIONS DENIED
0
$0
3
$93,200
15
$107,747
3
$57,680
0
$0
1
$35,780
APPLICATIONS WITHDRAWN
0
$0
4
$112,702
6
$155,472
1
$66,340
0
$0
0
$0
FILES CLOSED FOR INCOMPLETENESS
0
$0
1
$30,760
3
$114,280
0
$0
0
$0
0
$0
Aggregated Statistics For Year 2006 (Based on 4 partial tracts)
A) FHA, FSA/RHS & VA Home Purchase Loans
B) Conventional Home Purchase Loans
C) Refinancings
D) Home Improvement Loans
E) Loans on Dwellings For 5+ Families
F) Non-occupant Loans on < 5 Family Dwellings (A B C & D)
G) Loans On Manufactured Home Dwelling (A B C & D)
Number
Average Value
Number
Average Value
Number
Average Value
Number
Average Value
Number
Average Value
Number
Average Value
Number
Average Value
LOANS ORIGINATED
3
$108,717
76
$133,563
47
$114,178
13
$36,726
1
$5,383,590
6
$125,503
1
$11,700
APPLICATIONS APPROVED, NOT ACCEPTED
0
$0
4
$149,012
4
$119,968
1
$41,010
0
$0
0
$0
0
$0
APPLICATIONS DENIED
0
$0
2
$72,330
20
$140,378
2
$102,185
0
$0
0
$0
1
$4,440
APPLICATIONS WITHDRAWN
0
$0
2
$163,065
12
$131,900
0
$0
0
$0
0
$0
0
$0
FILES CLOSED FOR INCOMPLETENESS
0
$0
1
$135,040
4
$168,742
0
$0
0
$0
1
$94,030
0
$0
Aggregated Statistics For Year 2005 (Based on 4 partial tracts)
A) FHA, FSA/RHS & VA Home Purchase Loans
B) Conventional Home Purchase Loans
C) Refinancings
D) Home Improvement Loans
F) Non-occupant Loans on < 5 Family Dwellings (A B C & D)
G) Loans On Manufactured Home Dwelling (A B C & D)
Number
Average Value
Number
Average Value
Number
Average Value
Number
Average Value
Number
Average Value
Number
Average Value
LOANS ORIGINATED
4
$90,458
69
$129,306
59
$117,853
8
$40,452
4
$88,672
1
$9,140
APPLICATIONS APPROVED, NOT ACCEPTED
0
$0
3
$131,360
6
$92,603
1
$11,490
1
$56,780
0
$0
APPLICATIONS DENIED
0
$0
7
$97,184
21
$116,764
4
$65,995
0
$0
2
$23,510
APPLICATIONS WITHDRAWN
1
$120,150
3
$145,877
15
$118,998
1
$11,750
1
$53,980
0
$0
FILES CLOSED FOR INCOMPLETENESS
0
$0
0
$0
4
$154,822
1
$59,450
0
$0
0
$0
Aggregated Statistics For Year 2004 (Based on 4 partial tracts)
A) FHA, FSA/RHS & VA Home Purchase Loans
B) Conventional Home Purchase Loans
C) Refinancings
D) Home Improvement Loans
E) Loans on Dwellings For 5+ Families
F) Non-occupant Loans on < 5 Family Dwellings (A B C & D)
G) Loans On Manufactured Home Dwelling (A B C & D)
Number
Average Value
Number
Average Value
Number
Average Value
Number
Average Value
Number
Average Value
Number
Average Value
Number
Average Value
LOANS ORIGINATED
1
$131,640
63
$134,486
85
$118,171
8
$32,966
1
$719,030
7
$139,383
1
$35,090
APPLICATIONS APPROVED, NOT ACCEPTED
0
$0
2
$139,220
8
$101,928
1
$61,180
0
$0
0
$0
1
$29,520
APPLICATIONS DENIED
1
$74,150
5
$54,844
23
$97,332
3
$67,243
0
$0
1
$58,440
4
$33,432
APPLICATIONS WITHDRAWN
0
$0
2
$77,255
9
$116,714
1
$20,900
0
$0
0
$0
0
$0
FILES CLOSED FOR INCOMPLETENESS
0
$0
1
$163,780
4
$122,818
1
$30,040
0
$0
0
$0
0
$0
Aggregated Statistics For Year 2003 (Based on 4 partial tracts)
A) FHA, FSA/RHS & VA Home Purchase Loans
B) Conventional Home Purchase Loans
C) Refinancings
D) Home Improvement Loans
E) Loans on Dwellings For 5+ Families
F) Non-occupant Loans on < 5 Family Dwellings (A B C & D)
Number
Average Value
Number
Average Value
Number
Average Value
Number
Average Value
Number
Average Value
Number
Average Value
LOANS ORIGINATED
3
$80,657
66
$124,013
236
$114,263
7
$45,136
1
$45,530
5
$79,466
APPLICATIONS APPROVED, NOT ACCEPTED
0
$0
3
$103,923
4
$78,120
0
$0
0
$0
0
$0
APPLICATIONS DENIED
0
$0
5
$69,062
20
$105,213
2
$22,305
0
$0
1
$99,970
APPLICATIONS WITHDRAWN
0
$0
3
$78,470
13
$101,170
0
$0
0
$0
0
$0
FILES CLOSED FOR INCOMPLETENESS
0
$0
1
$62,200
2
$99,675
0
$0
0
$0
0
$0
Aggregated Statistics For Year 2002 (Based on 4 partial tracts)
A) FHA, FSA/RHS & VA Home Purchase Loans
B) Conventional Home Purchase Loans
C) Refinancings
D) Home Improvement Loans
F) Non-occupant Loans on < 5 Family Dwellings (A B C & D)
Number
Average Value
Number
Average Value
Number
Average Value
Number
Average Value
Number
Average Value
LOANS ORIGINATED
2
$111,160
51
$115,073
138
$111,962
7
$40,241
3
$72,730
APPLICATIONS APPROVED, NOT ACCEPTED
0
$0
3
$134,400
5
$102,184
0
$0
0
$0
APPLICATIONS DENIED
0
$0
6
$65,942
16
$101,485
2
$19,330
1
$31,870
APPLICATIONS WITHDRAWN
0
$0
4
$107,798
8
$102,268
2
$18,860
0
$0
FILES CLOSED FOR INCOMPLETENESS
0
$0
0
$0
1
$171,350
0
$0
0
$0
Aggregated Statistics For Year 2001 (Based on 4 partial tracts)
A) FHA, FSA/RHS & VA Home Purchase Loans
B) Conventional Home Purchase Loans
C) Refinancings
D) Home Improvement Loans
F) Non-occupant Loans on < 5 Family Dwellings (A B C & D)
Number
Average Value
Number
Average Value
Number
Average Value
Number
Average Value
Number
Average Value
LOANS ORIGINATED
4
$94,182
43
$116,763
104
$103,341
5
$17,988
2
$30,830
APPLICATIONS APPROVED, NOT ACCEPTED
0
$0
1
$94,820
4
$84,585
0
$0
0
$0
APPLICATIONS DENIED
0
$0
4
$50,478
11
$97,223
1
$15,360
0
$0
APPLICATIONS WITHDRAWN
0
$0
4
$93,718
6
$85,703
1
$19,590
0
$0
FILES CLOSED FOR INCOMPLETENESS
0
$0
1
$40,490
1
$65,210
0
$0
0
$0
Aggregated Statistics For Year 2000 (Based on 4 partial tracts)
A) FHA, FSA/RHS & VA Home Purchase Loans
B) Conventional Home Purchase Loans
C) Refinancings
D) Home Improvement Loans
F) Non-occupant Loans on < 5 Family Dwellings (A B C & D)
Number
Average Value
Number
Average Value
Number
Average Value
Number
Average Value
Number
Average Value
LOANS ORIGINATED
3
$104,993
38
$98,354
16
$83,750
4
$14,615
1
$62,950
APPLICATIONS APPROVED, NOT ACCEPTED
0
$0
1
$130,900
2
$77,685
2
$34,615
0
$0
APPLICATIONS DENIED
0
$0
4
$76,945
7
$75,459
2
$13,715
0
$0
APPLICATIONS WITHDRAWN
0
$0
2
$127,205
9
$74,962
0
$0
0
$0
FILES CLOSED FOR INCOMPLETENESS
0
$0
0
$0
1
$29,780
0
$0
0
$0
Aggregated Statistics For Year 1999 (Based on 2 partial tracts)
A) FHA, FSA/RHS & VA Home Purchase Loans
B) Conventional Home Purchase Loans
C) Refinancings
D) Home Improvement Loans
F) Non-occupant Loans on < 5 Family Dwellings (A B C & D)


+$781
-$74
(% of AGI for various income ranges: -31.4% for AGIs below $10k, -4.2% for AGIs $10k-25k, 2.8% for AGIs $25k-50k, 0.8% for AGIs $50k-75k)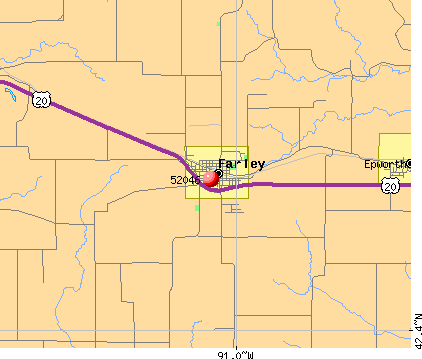 Nearest zip codes: 52045, 52078, 52040, 52033, 52053, 52065.


