Estimated zip code population in 2022: 751 Zip code population in 2010: 940 Zip code population in 2000: 959
Houses and condos: 362 Renter-occupied apartments: 47
% of renters here:
14%
State:
28%
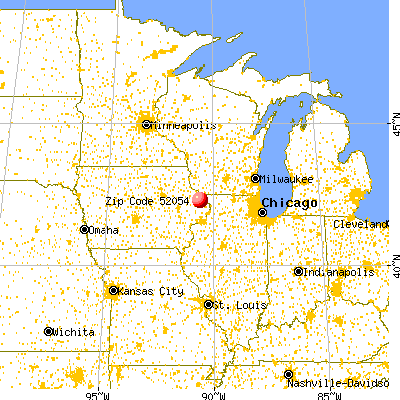
March 2022 cost of living index in zip code 52054: 83.8 (less than average, U.S. average is 100)
Land area: 53.4 sq. mi. Water area: 0.0 sq. mi.
Population density: 14 people per square mile
(very low).
OSM Map
General Map
Google Map
MSN Map
OSM Map
General Map
Google Map
MSN Map
OSM Map
General Map
Google Map
MSN Map
OSM Map
General Map
Google Map
MSN Map
Please wait while loading the map...
Real estate property taxes paid for housing units in 2022:
This zip code:
1.1% ($2,202)
Iowa:
1.4% ($2,724)
Median real estate property taxes paid for housing units with mortgages in 2022: $2,280 (1.2%) Median real estate property taxes paid for housing units with no mortgage in 2022: $2,128 (0.8%)
Business Search- 14 Million verified businesses
Males: 410
(54.6%)
Females: 341
(45.4%)
For population 25 years and over in 52054:
High school or higher: 91.2%
Bachelor's degree or higher: 22.8%
Graduate or professional degree: 6.9%
Unemployed: 0.9%
Mean travel time to work (commute): 22.9 minutes
For population 15 years and over in 52054:
Never married: 24.7%
Now married: 64.1%
Separated: 0.1%
Widowed: 1.6%
Divorced: 9.5%
Zip code 52054 compared to state average:
Unemployed percentage significantly below state average.
Black race population percentage significantly below state average.
Hispanic race population percentage significantly below state average.
Median age significantly above state average.
Foreign-born population percentage significantly below state average.
Renting percentage below state average.
Length of stay since moving in significantly above state average.
Estimated median house/condo value in 2022: $207,245
52054:
$207,245
Iowa:
$194,600
According to our research of Iowa and other state lists, there was 1 registered sex offender living in 52054 zip code as of June 16, 2024. The ratio of all residents to sex offenders in zip code 52054 is 832 to 1. The ratio of registered sex offenders to all residents in this zip code is lower than the state average.
Median resident age:
This zip code:
53.9 years
Iowa median age:
38.9 years
Average household size:
This zip code:
2.2 people
Iowa:
2.3 people
Averages for the 2020 tax year for zip code 52054, filed in 2021:
Average Adjusted Gross Income (AGI) in 2020: $69,293 (Individual Income Tax Returns)
Here:
$69,293
State:
$71,087
Salary/wage: $60,653 (reported on 80.0% of returns)
Here:
$60,653
State:
$57,361
(% of AGI for various income ranges: 1478.3% for AGIs below $25k, 4178.6% for AGIs $25k-50k, 6834.0% for AGIs $50k-75k, 9782.0% for AGIs $75k-100k, 19430.0% for AGIs $100k-200k)
Taxable interest for individuals: $1,104 (reported on 60.0% of returns)
This zip code:
$1,104
Iowa:
$1,633
(% of AGI for various income ranges: 15.0% for AGIs below $25k, 25.7% for AGIs $25k-50k, 138.0% for AGIs $50k-75k, 110.0% for AGIs $75k-100k, 294.0% for AGIs $100k-200k)
Ordinary dividends: $2,287 (reported on 33.3% of returns)
Here:
$2,287
State:
$5,432
(% of AGI for various income ranges: 40.0% for AGIs below $25k, 41.4% for AGIs $25k-50k, 128.0% for AGIs $50k-75k, 42.0% for AGIs $75k-100k, 410.0% for AGIs $100k-200k)
Net capital gain/loss in AGI: +$18,182 (reported on 24.4% of returns)
Here:
+$18,182
State:
+$15,243
(% of AGI for various income ranges: 123.3% for AGIs below $25k, 158.6% for AGIs $25k-50k, 442.0% for AGIs $50k-75k, 3188.0% for AGIs $100k-200k)
Profit/loss from business: +$5,557 (reported on 15.6% of returns)
Here:
+$5,557
State:
+$11,763
(% of AGI for various income ranges: 380.0% for AGIs $25k-50k, 246.0% for AGIs $75k-100k)
Taxable individual retirement arrangement distribution: $13,240 (reported on 11.1% of returns)
52054:
$13,240
Iowa:
$17,324
(% of AGI for various income ranges: 352.9% for AGIs $25k-50k, 830.0% for AGIs $75k-100k)
Earned income credit: $1,633 (reported on 6.7% of returns)
Here:
$1,633
State:
$2,195
(% of AGI for various income ranges: 81.7% for AGIs below $25k)
Percentage of individuals using paid preparers for their 2020 taxes: 100.0%
Here:
100%
State:
95%
(% for various income ranges: 100.0% for AGIs below $25k, 100.0% for AGIs $25k-50k, 100.0% for AGIs $50k-75k, 100.0% for AGIs $75k-100k, 100.0% for AGIs $100k-200k)
Averages for the 2012 tax year for zip code 52054, filed in 2013:
Average Adjusted Gross Income (AGI) in 2012: $55,313 (Individual Income Tax Returns)
Here:
$55,313
State:
$58,860
Salary/wage: $48,028 (reported on 83.0% of returns)
Here:
$48,028
State:
$46,659
(% of AGI for various income ranges: 74.2% for AGIs below $25k, 74.1% for AGIs $25k-50k, 74.3% for AGIs $50k-75k, 75.7% for AGIs $75k-100k, 67.3% for AGIs $100k-200k)
Taxable interest for individuals: $1,111 (reported on 59.6% of returns)
This zip code:
$1,111
Iowa:
$1,537
(% of AGI for various income ranges: 1.6% for AGIs below $25k, 1.3% for AGIs $25k-50k, 0.9% for AGIs $50k-75k, 1.1% for AGIs $75k-100k, 1.3% for AGIs $100k-200k)
Ordinary dividends: $660 (reported on 31.9% of returns)
Here:
$660
State:
$4,542
(% of AGI for various income ranges: 0.9% for AGIs below $25k, 0.5% for AGIs $25k-50k, 0.5% for AGIs $50k-75k, 0.3% for AGIs $75k-100k, 0.2% for AGIs $100k-200k)
Net capital gain/loss in AGI: +$12,533 (reported on 25.5% of returns)
Here:
+$12,533
State:
+$11,802
(% of AGI for various income ranges: 8.1% for AGIs below $25k, 3.5% for AGIs $50k-75k, 3.1% for AGIs $75k-100k, 10.6% for AGIs $100k-200k)
Profit/loss from business: +$11,157 (reported on 14.9% of returns)
Here:
+$11,157
State:
+$10,509
(% of AGI for various income ranges: 13.3% for AGIs below $25k, 12.5% for AGIs $25k-50k, 1.5% for AGIs $75k-100k)
Taxable individual retirement arrangement distribution: $5,625 (reported on 8.5% of returns)
52054:
$5,625
Iowa:
$11,773
Total itemized deductions: $18,345 (19% of AGI, reported on 23.4% of returns)
Here:
$18,345
State:
$21,278
Here:
18.8% of AGI
State:
18.9% of AGI
(% of AGI for various income ranges: 17.5% for AGIs below $25k, 6.0% for AGIs $50k-75k, 9.7% for AGIs $75k-100k, 9.0% for AGIs $100k-200k)
Charity contributions: $1,644 (reported on 19.1% of returns)
Here:
$1,644
State:
$4,044
(% of AGI for various income ranges: 1.0% for AGIs $25k-50k, 1.0% for AGIs $75k-100k, 0.6% for AGIs $100k-200k)
Taxes paid: $7,836 (reported on 23.4% of returns)
52054:
$7,836
State:
$8,846
(% of AGI for various income ranges: 3.3% for AGIs below $25k, 1.8% for AGIs $50k-75k, 3.6% for AGIs $75k-100k, 5.4% for AGIs $100k-200k)
Earned income credit: $1,800 (reported on 14.9% of returns)
Here:
$1,800
State:
$2,098
(% of AGI for various income ranges: 5.2% for AGIs below $25k, 1.0% for AGIs $25k-50k)
Percentage of individuals using paid preparers for their 2012 taxes: 83.0%
Here:
83%
State:
65%
(% for various income ranges: 80.0% for AGIs below $25k, 72.7% for AGIs $25k-50k, 88.9% for AGIs $50k-75k, 100.0% for AGIs $75k-100k, 83.3% for AGIs $100k-200k)
Averages for the 2004 tax year for zip code 52054, filed in 2005:
Average Adjusted Gross Income (AGI) in 2004: $35,404 (Individual Income Tax Returns)
Here:
$35,404
State:
$43,875
Salary/wage: $34,482 (reported on 85.1% of returns)
Here:
$34,482
State:
$38,265
(% of AGI for various income ranges: 213.6% for AGIs below $10k, 67.6% for AGIs $10k-25k, 78.7% for AGIs $25k-50k, 83.1% for AGIs $50k-75k, 89.8% for AGIs $75k-100k, 78.8% for AGIs over 100k)
Taxable interest for individuals: $968 (reported on 68.6% of returns)
This zip code:
$968
Iowa:
$1,768
(% of AGI for various income ranges: 19.8% for AGIs below $10k, 4.2% for AGIs $10k-25k, 2.4% for AGIs $25k-50k, 1.0% for AGIs $50k-75k, 0.8% for AGIs $75k-100k, 0.4% for AGIs over 100k)
Taxable dividends: $614 (reported on 34.6% of returns)
Here:
$614
State:
$2,510
(% of AGI for various income ranges: 3.7% for AGIs below $10k, 0.5% for AGIs $10k-25k, 0.8% for AGIs $25k-50k, 0.3% for AGIs $50k-75k, 0.2% for AGIs $75k-100k, 1.2% for AGIs over 100k)
Net capital gain/loss: +$4,844 (reported on 29.6% of returns)
Here:
+$4,844
State:
+$6,139
(% of AGI for various income ranges: 23.9% for AGIs below $10k, 5.1% for AGIs $10k-25k, 4.9% for AGIs $25k-50k, 3.7% for AGIs $50k-75k, 2.1% for AGIs $75k-100k, 2.8% for AGIs over 100k)
Profit/loss from business: +$2,958 (reported on 15.6% of returns)
Here:
+$2,958
State:
+$8,574
(% of AGI for various income ranges: -19.8% for AGIs below $10k, 6.3% for AGIs $10k-25k, -0.9% for AGIs $25k-50k, 3.8% for AGIs $50k-75k)
IRA payment deduction: $3,077 (reported on 2.9% of returns)
52054:
$3,077
Iowa:
$2,970
Total itemized deductions: $14,888 (24% of AGI, reported on 19.5% of returns)
Here:
$14,888
State:
$16,976
Here:
23.8% of AGI
State:
20.8% of AGI
(% of AGI for various income ranges: 11.8% for AGIs $10k-25k, 6.0% for AGIs $25k-50k, 5.8% for AGIs $50k-75k, 9.4% for AGIs $75k-100k, 14.5% for AGIs over 100k)
Charity contributions deductions: $1,077 (2% of AGI, reported on 17.1% of returns)
Here:
$1,077
State:
$3,089
Here:
1.8% of AGI
State:
3.6% of AGI
(% of AGI for various income ranges: 4.5% for AGIs below $10k, 0.4% for AGIs $25k-50k, 0.5% for AGIs $50k-75k, 1.0% for AGIs $75k-100k)
Total tax: $3,619 (reported on 77.6% of returns)
52054:
$3,619
State:
$6,177
(% of AGI for various income ranges: 6.6% for AGIs below $10k, 5.1% for AGIs $10k-25k, 6.2% for AGIs $25k-50k, 7.5% for AGIs $50k-75k, 9.0% for AGIs $75k-100k, 13.6% for AGIs over 100k)
Earned income credit: $1,239 (reported on 10.1% of returns)
Here:
$1,239
State:
$1,540
Percentage of individuals using paid preparers for their 2004 taxes: 80.5%
Here:
80%
State:
70%
(% for various income ranges: 74.3% for AGIs below $10k, 72.3% for AGIs $10k-25k, 87.8% for AGIs $25k-50k, 85.0% for AGIs $50k-75k, 91.7% for AGIs $75k-100k, 73.3% for AGIs over 100k)
Household received Food Stamps/SNAP in the past 12 months: 0 Household did not receive Food Stamps/SNAP in the past 12 months: 339
Women who had a birth in the past 12 months: 2 (2 now married, 0 unmarried) Women who did not have a birth in the past 12 months: 151 (56 now married, 94 unmarried)
Housing units in zip code 52054 with a mortgage: 122 (18 second mortgage, 17 both second mortgage and home equity loan) Houses without a mortgage: 5
Median monthly owner costs for units with a mortgage: $1,324 Median monthly owner costs for units without a mortgage: $532
Residents with income below the poverty level in 2022:
This zip code:
8.9%
Whole state:
11.0%
Residents with income below 50% of the poverty level in 2022:
This zip code:
2.0%
Whole state:
5.5%
Median number of rooms in houses and condos:
Here:
7.1
State:
6.8
Median number of rooms in apartments:
Here:
3.2
State:
4.2
Notable locations in this zip code not listed on our city pages
Cemeteries: Cottonville Cemetery (1), Sweezy Cemetery (2), Holy Rosary Cemetery (3), East Hill Catholic Cemetery (4), Saint Theresa Cemetery (5). Display/hide their locations on the map
Size of family households: 147 2-persons, 33 3-persons, 30 4-persons, 24 5-persons, 2 6-persons
Size of nonfamily households: 88 1-person, 10 2-persons
79 married couples with children.
35 single-parent households (21 men, 14 women).
All residents speak English at home
Foreign born population: 0 (0.0%)
:
0.0%
Whole state:
6.0%
67%German
8%Luxembourger
5%American
3%English
3%Irish
3%Scottish
Facilities with environmental interests located in this zip code:
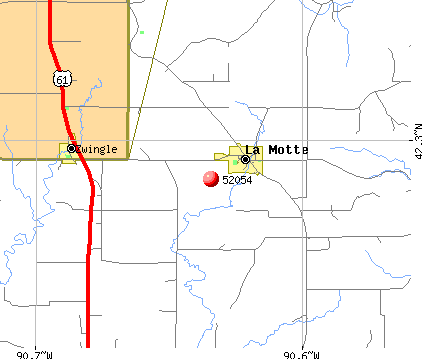
NEW HORIZON FS INCORPORATED (22067 183RD AVENUE in LA MOTTE, IA)
(Resource Conservation and Recovery Act (tracking hazardous waste)) Organizations: C & J SERVICE CO (CONTACT/OWNER)
Alternative names: C & J SERVICE CO
Housing units lacking complete plumbing facilities: 1.9% Housing units lacking complete kitchen facilities: 1.8%
54.2%Bottled, tank, or LP gas
32.3%Utility gas
8.3%Electricity
3.1%Wood
2.8%Fuel oil, kerosene, etc.
Population in 1990: 1,132.
Place of birth for U.S.-born residents:
This state: 674
Midwest: 45
South: 28
West: 2
83% of the 52054 zip code residents lived in the same house 5 years ago. Out of people who lived in different houses, 53% lived in this county. Out of people who lived in different counties, 50% lived in Iowa.
99% of the 52054 zip code residents lived in the same house 1 year ago. Out of people who lived in different houses, 33% moved from this county. Out of people who lived in different houses, 33% moved from different county within same state. Out of people who lived in different houses, 67% moved from different state.
Private vs. public school enrollment:
Students in private schools in grades 1 to 8 (elementary and middle school):
Here:
0.0%
Iowa:
10.6%
Students in private schools in grades 9 to 12 (high school):
Here:
0.0%
Iowa:
7.9%
Students in private undergraduate colleges:
Here:
0.0%
Iowa:
23.9%
Occupation by median earnings in the past 12 months ($)
77,588Construction and extraction occupations
71,950Management occupations
66,242Sales and related occupations
65,599Transportation occupations
65,205Health diagnosing and treating practitioners and other technical occupations
52,671Production occupations
Top industries in this zip code by the number of employees in 2005:
Wholesale Trade: Farm and Garden Machinery and Equipment Merchant Wholesalers (5-9: 1)
Other Services (except Public Administration): Religious Organizations (5-9: 1)
Construction: Painting and Wall Covering Contractors (5-9: 1)
Construction: Masonry Contractors (5-9: 1)
Accommodation and Food Services: Drinking Places (Alcoholic Beverages) (5-9: 1)
Construction: New Single-Family Housing Construction (except Operative Builders) (1-4: 2)
Fatal accident statistics in 2011:
Fatal accident count: 1
Vehicles involved in fatal accidents: 2
Fatal accidents caused by drunken drivers: 0
Fatalities: 1
Persons involved in fatal accidents: 2
Pedestrians involved in fatal accidents: 0
Fatal accident statistics in 2010:
Fatal accident count: 1
Vehicles involved in fatal accidents: 2
Fatal accidents caused by drunken drivers: 1
Fatalities: 1
Persons involved in fatal accidents: 2
Pedestrians involved in fatal accidents: 0
2003 - 2017 National Fire Incident Reporting System (NFIRS) incidents
According to the data from the years 2003 - 2017 the average number of fire incidents per year is 7. The highest number of fire incidents - 15 took place in 2010, and the least - 3 in 2003. The data has a growing trend.
When looking into fire subcategories, the most incidents belonged to: Outside Fires (39.0%), and Structure Fires (31.0%).
Fire incident types reported to NFIRS in Zip Code 52054


 Nearest zip codes: 52079, 52003, 52031, 52030, 61025, 52060.


 According to the data from the years 2003 - 2017 the average number of fire incidents per year is 7. The highest number of fire incidents - 15 took place in 2010, and the least - 3 in 2003. The data has a growing trend.
 When looking into fire subcategories, the most incidents belonged to: Outside Fires (39.0%), and Structure Fires (31.0%).