Estimated zip code population in 2022: 1,527 Zip code population in 2010: 1,728 Zip code population in 2000: 1,691
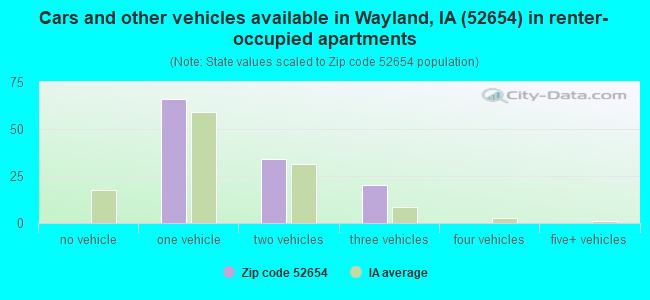
Houses and condos: 616 Renter-occupied apartments: 120
% of renters here:
21%
State:
28%
March 2022 cost of living index in zip code 52654: 81.5 (low, U.S. average is 100)
Land area: 52.3 sq. mi. Water area: 0.2 sq. mi.
Population density: 29 people per square mile
(very low).
OSM Map
General Map
Google Map
MSN Map
OSM Map
General Map
Google Map
MSN Map
OSM Map
General Map
Google Map
MSN Map
OSM Map
General Map
Google Map
MSN Map
Please wait while loading the map...
Real estate property taxes paid for housing units in 2022:
This zip code:
1.4% ($2,015)
Iowa:
1.4% ($2,724)
Median real estate property taxes paid for housing units with mortgages in 2022: $2,098 (1.5%) Median real estate property taxes paid for housing units with no mortgage in 2022: $1,891 (1.2%)
Business Search- 14 Million verified businesses
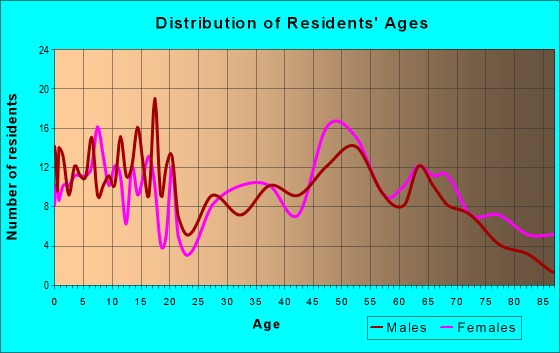
Males: 722
(47.3%)
Females: 805
(52.7%)
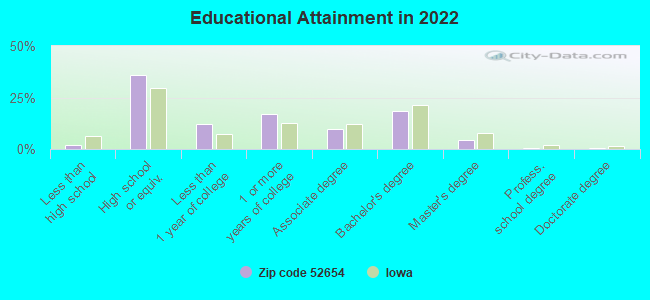
For population 25 years and over in 52654:
High school or higher: 97.4%
Bachelor's degree or higher: 23.4%
Graduate or professional degree: 5.3%
Unemployed: 1.6%
Mean travel time to work (commute): 19.5 minutes
For population 15 years and over in 52654:
Never married: 25.3%
Now married: 51.3%
Separated: 0.8%
Widowed: 6.2%
Divorced: 16.3%
Zip code 52654 compared to state average:
Unemployed percentage below state average.
Black race population percentage significantly below state average.
Hispanic race population percentage significantly below state average.
Median age above state average.
Foreign-born population percentage significantly below state average.
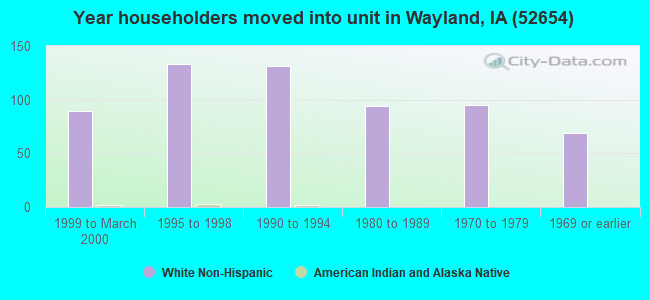
Length of stay since moving in significantly above state average.
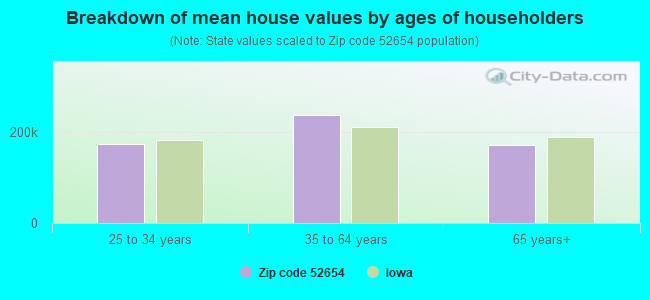
Estimated median house/condo value in 2022: $144,343
52654:
$144,343
Iowa:
$194,600
According to our research of Iowa and other state lists, there were 2 registered sex offenders living in 52654 zip code as of June 16, 2024. The ratio of all residents to sex offenders in zip code 52654 is 790 to 1. The ratio of registered sex offenders to all residents in this zip code is lower than the state average.
Median resident age:
This zip code:
46.1 years
Iowa median age:
38.9 years
Average household size:
This zip code:
2.5 people
Iowa:
2.3 people
Averages for the 2020 tax year for zip code 52654, filed in 2021:
Average Adjusted Gross Income (AGI) in 2020: $60,206 (Individual Income Tax Returns)
Here:
$60,206
State:
$71,087
Salary/wage: $50,023 (reported on 80.3% of returns)
Here:
$50,023
State:
$57,361
(% of AGI for various income ranges: 1256.4% for AGIs below $25k, 3872.9% for AGIs $25k-50k, 7555.7% for AGIs $50k-75k, 11294.0% for AGIs $75k-100k, 20792.0% for AGIs $100k-200k)
Taxable interest for individuals: $3,227 (reported on 42.3% of returns)
This zip code:
$3,227
Iowa:
$1,633
(% of AGI for various income ranges: 32.9% for AGIs below $25k, 20.0% for AGIs $25k-50k, 85.7% for AGIs $50k-75k, 74.0% for AGIs $75k-100k, 1594.0% for AGIs $100k-200k)
Ordinary dividends: $2,205 (reported on 26.8% of returns)
Here:
$2,205
State:
$5,432
(% of AGI for various income ranges: 32.1% for AGIs below $25k, 17.9% for AGIs $25k-50k, 185.7% for AGIs $50k-75k, 74.0% for AGIs $75k-100k, 364.0% for AGIs $100k-200k)
Net capital gain/loss in AGI: +$8,731 (reported on 18.3% of returns)
Here:
+$8,731
State:
+$15,243
(% of AGI for various income ranges: 51.4% for AGIs below $25k, 39.3% for AGIs $25k-50k, 294.3% for AGIs $50k-75k, 120.0% for AGIs $75k-100k, 1484.0% for AGIs $100k-200k)
Profit/loss from business: +$9,715 (reported on 18.3% of returns)
Here:
+$9,715
State:
+$11,763
(% of AGI for various income ranges: 257.1% for AGIs below $25k, 160.0% for AGIs $25k-50k, 680.0% for AGIs $50k-75k, 406.0% for AGIs $100k-200k)
Taxable individual retirement arrangement distribution: $13,920 (reported on 14.1% of returns)
52654:
$13,920
Iowa:
$17,324
(% of AGI for various income ranges: 157.1% for AGIs below $25k, 734.3% for AGIs $50k-75k, 1316.0% for AGIs $100k-200k)
Total itemized deductions: $27,575 (reported on 5.6% of returns)
Here:
$27,575
State:
$33,775
(% of AGI for various income ranges: 2206.0% for AGIs $75k-100k)
Charity contributions: $8,667 (reported on 4.2% of returns)
Here:
$8,667
State:
$13,075
(% of AGI for various income ranges: 520.0% for AGIs $75k-100k)
Taxes paid: $6,300 (reported on 5.6% of returns)
52654:
$6,300
State:
$7,704
(% of AGI for various income ranges: 504.0% for AGIs $75k-100k)
Earned income credit: $2,442 (reported on 16.9% of returns)
Here:
$2,442
State:
$2,195
(% of AGI for various income ranges: 129.3% for AGIs below $25k, 80.0% for AGIs $25k-50k)
Percentage of individuals using paid preparers for their 2020 taxes: 95.8%
Here:
96%
State:
95%
(% for various income ranges: 100.0% for AGIs below $25k, 94.7% for AGIs $25k-50k, 100.0% for AGIs $50k-75k, 88.9% for AGIs $75k-100k, 90.9% for AGIs $100k-200k)
Averages for the 2012 tax year for zip code 52654, filed in 2013:
Average Adjusted Gross Income (AGI) in 2012: $47,360 (Individual Income Tax Returns)
Here:
$47,360
State:
$58,860
Salary/wage: $38,598 (reported on 84.9% of returns)
Here:
$38,598
State:
$46,659
(% of AGI for various income ranges: 72.7% for AGIs below $25k, 79.6% for AGIs $25k-50k, 78.1% for AGIs $50k-75k, 74.9% for AGIs $75k-100k, 49.3% for AGIs $100k-200k)
Taxable interest for individuals: $1,034 (reported on 39.7% of returns)
This zip code:
$1,034
Iowa:
$1,537
(% of AGI for various income ranges: 2.4% for AGIs below $25k, 1.4% for AGIs $25k-50k, 0.5% for AGIs $50k-75k, 0.3% for AGIs $75k-100k, 0.7% for AGIs $100k-200k)
Ordinary dividends: $1,589 (reported on 26.0% of returns)
Here:
$1,589
State:
$4,542
(% of AGI for various income ranges: 1.2% for AGIs below $25k, 1.0% for AGIs $25k-50k, 0.9% for AGIs $50k-75k, 0.3% for AGIs $75k-100k, 1.0% for AGIs $100k-200k)
Net capital gain/loss in AGI: +$17,427 (reported on 20.5% of returns)
Here:
+$17,427
State:
+$11,802
(% of AGI for various income ranges: 0.3% for AGIs below $25k, 1.4% for AGIs $25k-50k, 5.0% for AGIs $50k-75k, 21.3% for AGIs $100k-200k)
Profit/loss from business: +$6,654 (reported on 17.8% of returns)
Here:
+$6,654
State:
+$10,509
(% of AGI for various income ranges: 7.0% for AGIs below $25k, 1.4% for AGIs $25k-50k, 6.4% for AGIs $50k-75k, 0.3% for AGIs $75k-100k)
Taxable individual retirement arrangement distribution: $8,443 (reported on 9.6% of returns)
52654:
$8,443
Iowa:
$11,773
Total itemized deductions: $17,543 (23% of AGI, reported on 28.8% of returns)
Here:
$17,543
State:
$21,278
Here:
23.1% of AGI
State:
18.9% of AGI
(% of AGI for various income ranges: 13.4% for AGIs below $25k, 9.0% for AGIs $25k-50k, 10.0% for AGIs $50k-75k, 10.9% for AGIs $75k-100k, 11.4% for AGIs $100k-200k)
Charity contributions: $4,182 (reported on 23.3% of returns)
Here:
$4,182
State:
$4,044
(% of AGI for various income ranges: 1.6% for AGIs below $25k, 1.9% for AGIs $25k-50k, 2.0% for AGIs $50k-75k, 2.9% for AGIs $75k-100k, 1.9% for AGIs $100k-200k)
Taxes paid: $5,938 (reported on 28.8% of returns)
52654:
$5,938
State:
$8,846
(% of AGI for various income ranges: 2.3% for AGIs below $25k, 2.2% for AGIs $25k-50k, 3.0% for AGIs $50k-75k, 3.7% for AGIs $75k-100k, 5.6% for AGIs $100k-200k)
Earned income credit: $2,000 (reported on 16.4% of returns)
Here:
$2,000
State:
$2,098
(% of AGI for various income ranges: 5.2% for AGIs below $25k, 1.0% for AGIs $25k-50k)
Percentage of individuals using paid preparers for their 2012 taxes: 72.6%
Here:
73%
State:
65%
(% for various income ranges: 66.7% for AGIs below $25k, 71.4% for AGIs $25k-50k, 76.9% for AGIs $50k-75k, 71.4% for AGIs $75k-100k, 100.0% for AGIs $100k-200k)
Averages for the 2004 tax year for zip code 52654, filed in 2005:
Average Adjusted Gross Income (AGI) in 2004: $32,177 (Individual Income Tax Returns)
Here:
$32,177
State:
$43,875
Salary/wage: $28,710 (reported on 84.0% of returns)
Here:
$28,710
State:
$38,265
(% of AGI for various income ranges: 215.8% for AGIs below $10k, 69.6% for AGIs $10k-25k, 80.2% for AGIs $25k-50k, 78.5% for AGIs $50k-75k, 66.1% for AGIs $75k-100k, 46.9% for AGIs over 100k)
Taxable interest for individuals: $1,391 (reported on 52.8% of returns)
This zip code:
$1,391
Iowa:
$1,768
(% of AGI for various income ranges: 12.8% for AGIs below $10k, 3.4% for AGIs $10k-25k, 1.2% for AGIs $25k-50k, 2.0% for AGIs $50k-75k, 1.3% for AGIs $75k-100k, 4.1% for AGIs over 100k)
Taxable dividends: $1,269 (reported on 33.7% of returns)
Here:
$1,269
State:
$2,510
(% of AGI for various income ranges: 4.6% for AGIs below $10k, 3.1% for AGIs $10k-25k, 0.6% for AGIs $25k-50k, 1.6% for AGIs $50k-75k, 0.9% for AGIs $75k-100k, 0.8% for AGIs over 100k)
Net capital gain/loss: +$3,780 (reported on 22.8% of returns)
Here:
+$3,780
State:
+$6,139
(% of AGI for various income ranges: -2.8% for AGIs below $10k, 1.9% for AGIs $10k-25k, 2.4% for AGIs $25k-50k, 2.9% for AGIs $50k-75k, 1.9% for AGIs $75k-100k, 5.5% for AGIs over 100k)
Profit/loss from business: +$4,148 (reported on 17.0% of returns)
Here:
+$4,148
State:
+$8,574
(% of AGI for various income ranges: -28.1% for AGIs below $10k, 4.4% for AGIs $10k-25k, 6.6% for AGIs $25k-50k, -0.1% for AGIs $50k-75k)
IRA payment deduction: $3,043 (reported on 3.2% of returns)
52654:
$3,043
Iowa:
$2,970
Total itemized deductions: $14,366 (27% of AGI, reported on 25.9% of returns)
Here:
$14,366
State:
$16,976
Here:
26.5% of AGI
State:
20.8% of AGI
(% of AGI for various income ranges: 34.3% for AGIs below $10k, 14.5% for AGIs $10k-25k, 10.1% for AGIs $25k-50k, 10.8% for AGIs $50k-75k, 12.0% for AGIs $75k-100k, 10.2% for AGIs over 100k)
Charity contributions deductions: $4,160 (7% of AGI, reported on 22.6% of returns)
Here:
$4,160
State:
$3,089
Here:
7.5% of AGI
State:
3.6% of AGI
(% of AGI for various income ranges: 3.2% for AGIs below $10k, 2.9% for AGIs $10k-25k, 2.6% for AGIs $25k-50k, 3.6% for AGIs $50k-75k, 2.6% for AGIs $75k-100k, 2.5% for AGIs over 100k)
Total tax: $3,440 (reported on 74.4% of returns)
52654:
$3,440
State:
$6,177
(% of AGI for various income ranges: 6.5% for AGIs below $10k, 4.5% for AGIs $10k-25k, 6.5% for AGIs $25k-50k, 7.3% for AGIs $50k-75k, 10.1% for AGIs $75k-100k, 14.8% for AGIs over 100k)
Earned income credit: $1,779 (reported on 13.2% of returns)
Here:
$1,779
State:
$1,540
Percentage of individuals using paid preparers for their 2004 taxes: 77.3%
Here:
77%
State:
70%
(% for various income ranges: 72.0% for AGIs below $10k, 76.6% for AGIs $10k-25k, 78.9% for AGIs $25k-50k, 76.5% for AGIs $50k-75k, 97.1% for AGIs $75k-100k, 84.2% for AGIs over 100k)
Household received Food Stamps/SNAP in the past 12 months: 61 Household did not receive Food Stamps/SNAP in the past 12 months: 523
Women who had a birth in the past 12 months: 27 (13 now married, 13 unmarried) Women who did not have a birth in the past 12 months: 354 (135 now married, 219 unmarried)
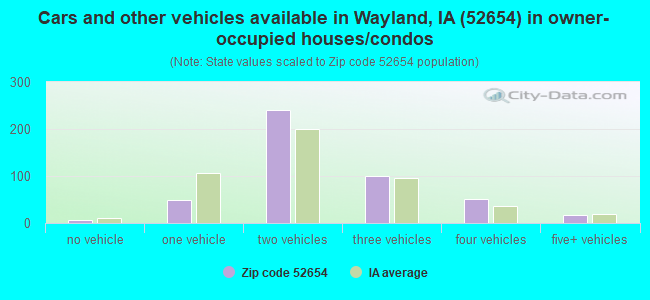
Housing units in zip code 52654 with a mortgage: 289 (38 second mortgage, 9 both second mortgage and home equity loan) Median monthly owner costs for units with a mortgage: $1,126 Median monthly owner costs for units without a mortgage: $605
Residents with income below the poverty level in 2022:
This zip code:
7.5%
Whole state:
11.0%
Residents with income below 50% of the poverty level in 2022:
This zip code:
6.5%
Whole state:
5.5%
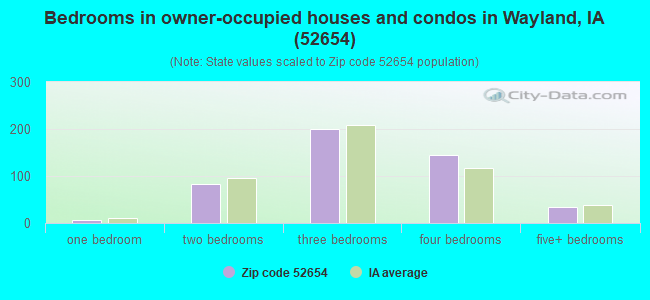
Median number of rooms in houses and condos:
Here:
7.3
State:
6.8
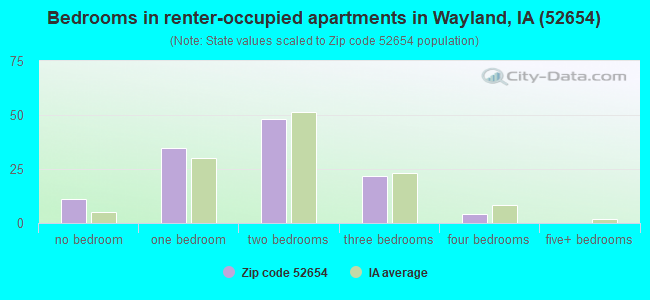
Median number of rooms in apartments:
Here:
4.5
State:
4.2
Notable locations in this zip code not listed on our city pages
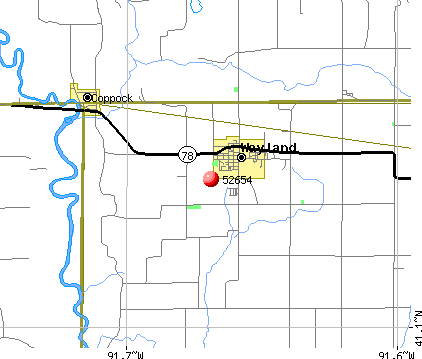
Notable locations in zip code 52654: Coppock Access (A), Wayland Volunteer Fire Department (B), Wayland City Hall (C). Display/hide their locations on the map
Churches in zip code 52654 include: Sugar Creek Church (A), New Life Parish (B), Independent Bible Church (C), Wayland Mennonite Church (D), Bethel Church (E), Cottonwood Church (F), Eicher Emmanuel Church (G), Green Mound Church (H), Fern Cliff Church (I). Display/hide their locations on the map
Cemeteries: Bethel Cemetery (1), Sommers Cemetery (2), Cottonwood Cemetery (3), Eicher Cemetery (4), Sugar Creek Cemetery (5), Martin Cemetery (6), Fern Cliff Evangelic Cemetery (7). Display/hide their locations on the map
In group quarters: 39 (-1 institutionalized population)
Size of family households: 233 2-persons, 62 3-persons, 54 4-persons, 26 5-persons, 10 6-persons, 5 7-or-more-persons
Size of nonfamily households: 130 1-person, 59 2-persons, 5 4-persons
184 married couples with children.
65 single-parent households (8 men, 57 women).
98.8% of residents of 52654 zip code speak English at home.
0.3% of residents speak Spanish at home (100% very well).
0.5% of residents speak other Indo-European language at home (100% very well).
Foreign born population: 0 (0.0%)
:
0.0%
Whole state:
6.0%
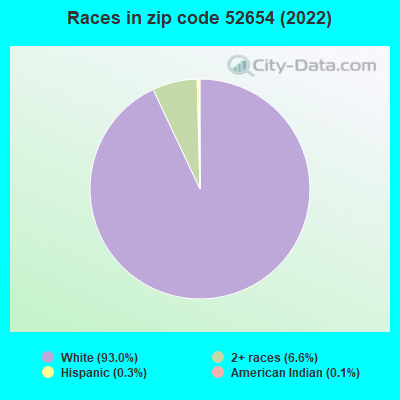
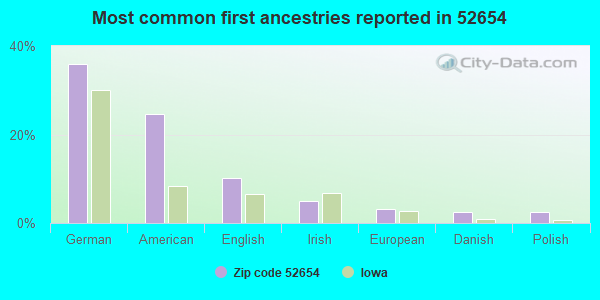
36%German
25%American
10%English
5%Irish
3%European
2%Danish
2%Polish
Facilities with environmental interests located in this zip code:
COPPOCK QUARRY (2271 320TH STREET in WAYLAND, IA)
National Pollutant Discharge Elimination System NON-MAJOR (Tracking pollutant discharge elimination systems) - permit Business SIC classification: CRUSHED AND BROKEN LIMESTONE Organizations: MARTIN MARIETTA AGGREGATES (CONTACT/OWNER)
Alternative names: MARTIN MARIETTA AGGREGATES
TSB & COMPANY (311 E RAILROAD in WAYLAND, IA)
AIR MINOR (AIRS/AFS) Business SIC classification: BURIAL CASKETS
AGRI WAY FEED LTD (HWY 78 EAST BOX 235 in WAYLAND, IA)
COMPLIANCE ACTIVITY (Tracking inspections of insecticide, fungicide, and rodenticide, and toxic substances) Business SIC classification: DOG AND CAT FOOD; PREPARED FEEDS AND FEED INGREDIENTS FOR ANIMALS AND FOWLS, EXCEPT DOGS AND CATS
BOSHART SALES INC (HWY 78 in WAYLAND, IA)
COMPLIANCE ACTIVITY (Tracking inspections of insecticide, fungicide, and rodenticide, and toxic substances)
Housing units lacking complete kitchen facilities: 0.9%
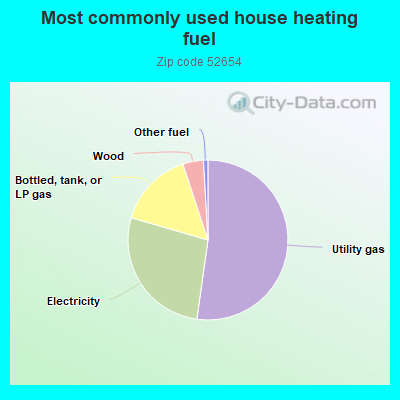
52.5%Utility gas
27.4%Electricity
15.5%Bottled, tank, or LP gas
4.2%Wood
0.9%Other fuel
Population in 1990: 1,626. Population change in the 1990s: +65 (+4.0%).
Place of birth for U.S.-born residents:
This state: 1,264
Northeast: 11
Midwest: 125
South: 45
West: 79
66% of the 52654 zip code residents lived in the same house 5 years ago. Out of people who lived in different houses, 46% lived in this county. Out of people who lived in different counties, 50% lived in Iowa.
93% of the 52654 zip code residents lived in the same house 1 year ago. Out of people who lived in different houses, 52% moved from this county. Out of people who lived in different houses, 37% moved from different county within same state. Out of people who lived in different houses, 10% moved from different state.
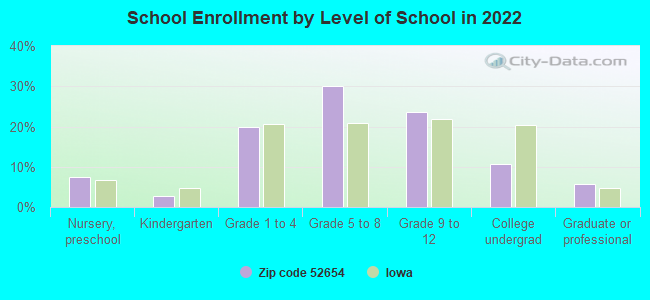
Private vs. public school enrollment:
Students in private schools in grades 1 to 8 (elementary and middle school): 3
Here:
2.5%
Iowa:
10.6%
Students in private schools in grades 9 to 12 (high school):
Here:
0.0%
Iowa:
7.9%
Students in private undergraduate colleges: 20
Here:
66.1%
Iowa:
23.9%
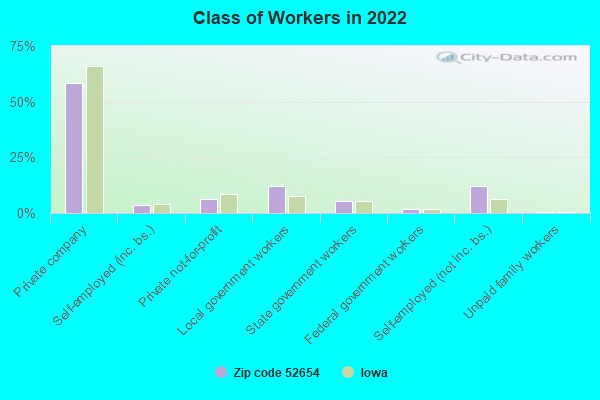
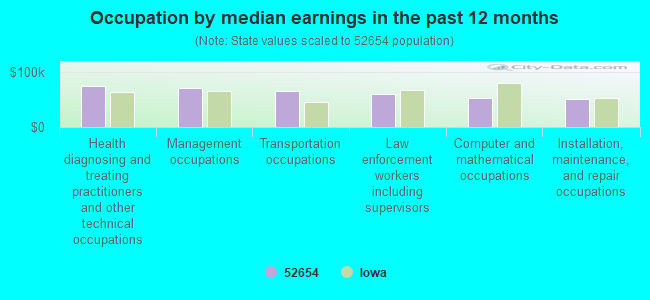
Occupation by median earnings in the past 12 months ($)
74,302Health diagnosing and treating practitioners and other technical occupations
71,950Management occupations
65,692Transportation occupations
60,473Law enforcement workers including supervisors
52,557Computer and mathematical occupations
50,707Installation, maintenance, and repair occupations
Companies with federal contracts located in this zip code:
ARCHITECTURAL CASEWORKS (504 N JEFFERSON ST in WAYLAND, IA; small business)
$26,630 with Air Force for Cabinets, Lockers, Bins, and Shelving. Signed on 2003-07-22. Completion date: 2003-09-09.
Top industries in this zip code by the number of employees in 2005:
Health Care and Social Assistance: Nursing Care Facilities (50-99 employees: 1 establishment)
Accommodation and Food Services: Full-Service Restaurants (10-19: 1, 1-4: 1)
Mining: Crushed and Broken Limestone Mining and Quarrying (10-19: 1)
Finance and Insurance: Commercial Banking (10-19: 1)
Other Services (except Public Administration): Religious Organizations (1-4: 6)
Other Services (except Public Administration): General Automotive Repair (5-9: 1, 1-4: 2)
Accommodation and Food Services: Snack and Nonalcoholic Beverage Bars (5-9: 1)
Construction: Plumbing, Heating, and Air-Conditioning Contractors (5-9: 1)
People in group quarters in 2010:
44 people in nursing facilities/skilled-nursing facilities
People in group quarters in 2000:
45 people in nursing homes
2003 - 2018 National Fire Incident Reporting System (NFIRS) incidents
According to the data from the years 2003 - 2018 the average number of fires per year is 8. The highest number of fire incidents - 22 took place in 2003, and the least - 0 in 2008. The data has a decreasing trend.
When looking into fire subcategories, the most reports belonged to: Outside Fires (45.5%), and Structure Fires (31.3%).
Fire incident types reported to NFIRS in Zip Code 52654
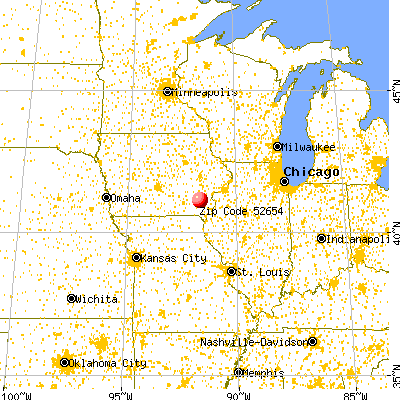


 Nearest zip codes: 52647, 52540, 52621, 52353, 52635, 52641.
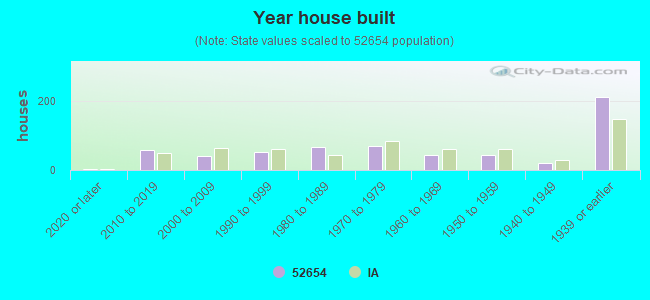


 According to the data from the years 2003 - 2018 the average number of fires per year is 8. The highest number of fire incidents - 22 took place in 2003, and the least - 0 in 2008. The data has a decreasing trend.
 When looking into fire subcategories, the most reports belonged to: Outside Fires (45.5%), and Structure Fires (31.3%).