Estimated zip code population in 2022: 18,119 Zip code population in 2010: 18,320 Zip code population in 2000: 18,484
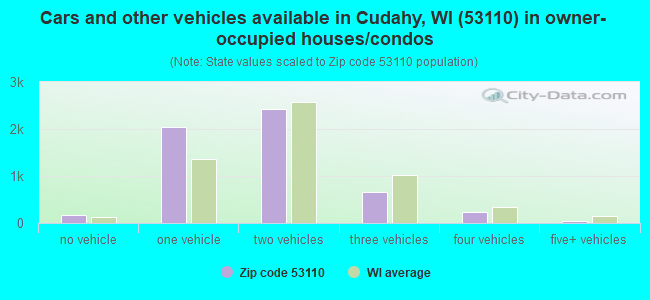
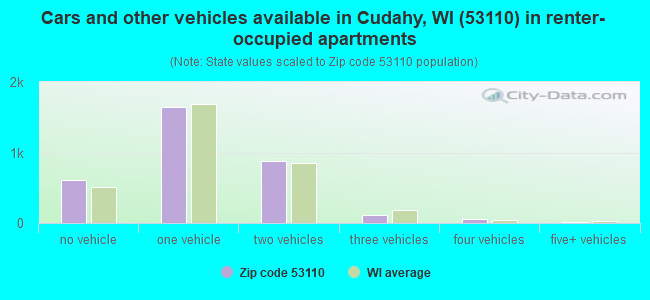
Houses and condos: 8,992 Renter-occupied apartments: 3,301
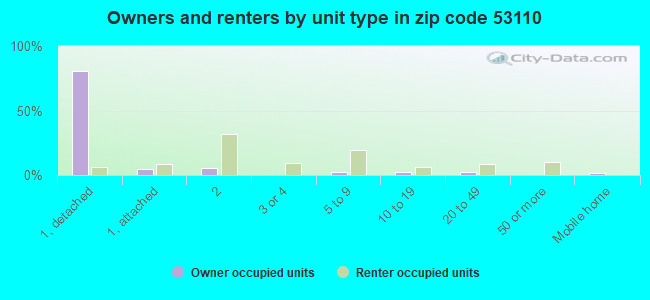
% of renters here:
37%
State:
32%
March 2022 cost of living index in zip code 53110: 96.7 (near average, U.S. average is 100)
Land area: 4.8 sq. mi. Water area: 0.7 sq. mi.
Population density: 3,800 people per square mile
(average).
OSM Map
General Map
Google Map
MSN Map
OSM Map
General Map
Google Map
MSN Map
OSM Map
General Map
Google Map
MSN Map
OSM Map
General Map
Google Map
MSN Map
Please wait while loading the map...
Real estate property taxes paid for housing units in 2022:
This zip code:
2.0% ($4,220)
Wisconsin:
1.4% ($3,497)
Median real estate property taxes paid for housing units with mortgages in 2022: $4,108 (1.9%) Median real estate property taxes paid for housing units with no mortgage in 2022: $4,364 (2.2%)
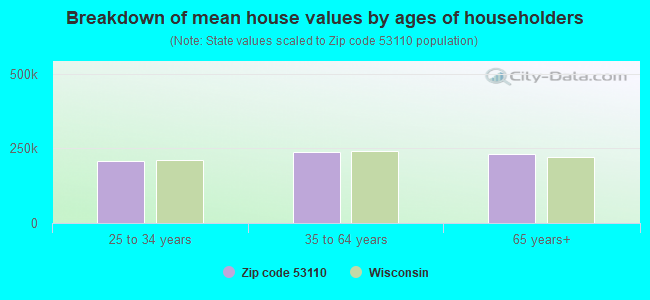
Estimated median house/condo value in 2022: $206,479
53110:
$206,479
Wisconsin:
$252,800
According to our research of Wisconsin and other state lists, there were 29 registered sex offenders living in 53110 zip code as of June 16, 2024. The ratio of all residents to sex offenders in zip code 53110 is 646 to 1. The ratio of registered sex offenders to all residents in this zip code is lower than the state average.
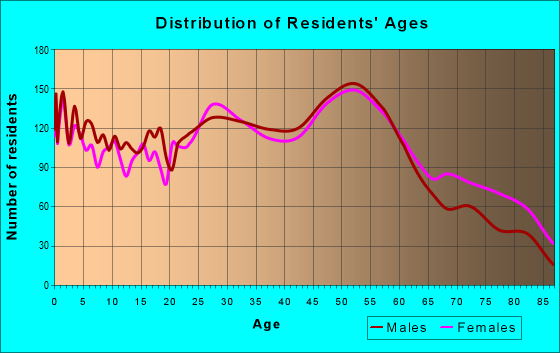
Median resident age:
This zip code:
42.9 years
Wisconsin median age:
40.4 years
Average household size:
This zip code:
2.0 people
Wisconsin:
2.3 people
Averages for the 2020 tax year for zip code 53110, filed in 2021:
Average Adjusted Gross Income (AGI) in 2020: $49,397 (Individual Income Tax Returns)
Here:
$49,397
State:
$72,319
Salary/wage: $46,088 (reported on 82.2% of returns)
Here:
$46,088
State:
$59,242
(% of AGI for various income ranges: 1181.6% for AGIs below $25k, 3659.5% for AGIs $25k-50k, 6645.6% for AGIs $50k-75k, 9706.9% for AGIs $75k-100k, 16767.6% for AGIs $100k-200k, 57645.0% for AGIs over 200k)
Taxable interest for individuals: $811 (reported on 27.2% of returns)
This zip code:
$811
Wisconsin:
$1,431
(% of AGI for various income ranges: 17.0% for AGIs below $25k, 18.0% for AGIs $25k-50k, 33.4% for AGIs $50k-75k, 50.0% for AGIs $75k-100k, 87.3% for AGIs $100k-200k, 505.0% for AGIs over 200k)
Ordinary dividends: $2,290 (reported on 14.7% of returns)
Here:
$2,290
State:
$6,481
(% of AGI for various income ranges: 19.9% for AGIs below $25k, 21.4% for AGIs $25k-50k, 52.9% for AGIs $50k-75k, 69.6% for AGIs $75k-100k, 170.8% for AGIs $100k-200k, 1075.0% for AGIs over 200k)
Net capital gain/loss in AGI: +$6,171 (reported on 11.8% of returns)
Here:
+$6,171
State:
+$18,329
(% of AGI for various income ranges: 8.2% for AGIs below $25k, 17.5% for AGIs $25k-50k, 51.3% for AGIs $50k-75k, 90.3% for AGIs $75k-100k, 434.1% for AGIs $100k-200k, 13105.0% for AGIs over 200k)
Profit/loss from business: +$10,072 (reported on 8.6% of returns)
Here:
+$10,072
State:
+$14,562
(% of AGI for various income ranges: 71.3% for AGIs below $25k, 97.5% for AGIs $25k-50k, 108.0% for AGIs $50k-75k, 128.5% for AGIs $75k-100k, 405.8% for AGIs $100k-200k)
Taxable individual retirement arrangement distribution: $13,630 (reported on 10.3% of returns)
53110:
$13,630
Wisconsin:
$19,348
(% of AGI for various income ranges: 78.5% for AGIs below $25k, 116.1% for AGIs $25k-50k, 229.2% for AGIs $50k-75k, 270.7% for AGIs $75k-100k, 786.1% for AGIs $100k-200k)
Total itemized deductions: $22,198 (reported on 4.5% of returns)
Here:
$22,198
State:
$33,000
(% of AGI for various income ranges: 25.9% for AGIs below $25k, 54.9% for AGIs $25k-50k, 199.6% for AGIs $50k-75k, 207.2% for AGIs $75k-100k, 506.6% for AGIs $100k-200k, 4855.0% for AGIs over 200k)
Charity contributions: $4,468 (reported on 2.9% of returns)
Here:
$4,468
State:
$12,044
(% of AGI for various income ranges: 2.0% for AGIs below $25k, 8.0% for AGIs $25k-50k, 17.5% for AGIs $50k-75k, 19.9% for AGIs $75k-100k, 116.1% for AGIs $100k-200k)
Taxes paid: $7,663 (reported on 4.5% of returns)
53110:
$7,663
State:
$8,228
(% of AGI for various income ranges: 6.7% for AGIs below $25k, 14.8% for AGIs $25k-50k, 83.7% for AGIs $50k-75k, 106.3% for AGIs $75k-100k, 151.0% for AGIs $100k-200k, 1030.0% for AGIs over 200k)
Earned income credit: $2,226 (reported on 14.6% of returns)
Here:
$2,226
State:
$2,155
(% of AGI for various income ranges: 87.2% for AGIs below $25k, 56.8% for AGIs $25k-50k)
Percentage of individuals using paid preparers for their 2020 taxes: 93.0%
Here:
93%
State:
94%
(% for various income ranges: 91.1% for AGIs below $25k, 94.4% for AGIs $25k-50k, 93.5% for AGIs $50k-75k, 93.7% for AGIs $75k-100k, 94.0% for AGIs $100k-200k, 87.5% for AGIs over 200k)
Averages for the 2012 tax year for zip code 53110, filed in 2013:
Average Adjusted Gross Income (AGI) in 2012: $42,430 (Individual Income Tax Returns)
Here:
$42,430
State:
$57,939
Salary/wage: $39,698 (reported on 84.3% of returns)
Here:
$39,698
State:
$48,248
(% of AGI for various income ranges: 71.0% for AGIs below $25k, 81.8% for AGIs $25k-50k, 79.7% for AGIs $50k-75k, 80.7% for AGIs $75k-100k, 79.5% for AGIs $100k-200k, 58.4% for AGIs over 200k)
Taxable interest for individuals: $697 (reported on 32.8% of returns)
This zip code:
$697
Wisconsin:
$1,224
(% of AGI for various income ranges: 1.2% for AGIs below $25k, 0.5% for AGIs $25k-50k, 0.5% for AGIs $50k-75k, 0.4% for AGIs $75k-100k, 0.4% for AGIs $100k-200k, 0.7% for AGIs over 200k)
Ordinary dividends: $2,025 (reported on 17.5% of returns)
Here:
$2,025
State:
$5,137
(% of AGI for various income ranges: 1.1% for AGIs below $25k, 0.5% for AGIs $25k-50k, 0.7% for AGIs $50k-75k, 0.8% for AGIs $75k-100k, 1.3% for AGIs $100k-200k)
Net capital gain/loss in AGI: +$2,128 (reported on 10.6% of returns)
Here:
+$2,128
State:
+$11,137
(% of AGI for various income ranges: 0.2% for AGIs $25k-50k, 0.2% for AGIs $50k-75k, 0.3% for AGIs $75k-100k, 1.9% for AGIs $100k-200k)
Profit/loss from business: +$8,660 (reported on 7.2% of returns)
Here:
+$8,660
State:
+$11,943
(% of AGI for various income ranges: 3.8% for AGIs below $25k, 1.3% for AGIs $25k-50k, 1.0% for AGIs $50k-75k, 0.8% for AGIs $75k-100k, 1.7% for AGIs $100k-200k)
Taxable individual retirement arrangement distribution: $9,685 (reported on 12.4% of returns)
53110:
$9,685
Wisconsin:
$14,087
(% of AGI for various income ranges: 4.8% for AGIs below $25k, 2.4% for AGIs $25k-50k, 2.1% for AGIs $50k-75k, 2.9% for AGIs $75k-100k, 3.3% for AGIs $100k-200k)
Total itemized deductions: $16,332 (23% of AGI, reported on 31.8% of returns)
Here:
$16,332
State:
$22,257
Here:
23.1% of AGI
State:
20.1% of AGI
(% of AGI for various income ranges: 8.9% for AGIs below $25k, 9.1% for AGIs $25k-50k, 13.3% for AGIs $50k-75k, 14.6% for AGIs $75k-100k, 14.6% for AGIs $100k-200k, 12.2% for AGIs over 200k)
Charity contributions: $1,690 (reported on 24.3% of returns)
Here:
$1,690
State:
$3,370
(% of AGI for various income ranges: 0.6% for AGIs below $25k, 0.6% for AGIs $25k-50k, 1.0% for AGIs $50k-75k, 1.2% for AGIs $75k-100k, 1.3% for AGIs $100k-200k, 1.4% for AGIs over 200k)
Taxes paid: $8,018 (reported on 31.6% of returns)
53110:
$8,018
State:
$10,731
(% of AGI for various income ranges: 2.8% for AGIs below $25k, 4.0% for AGIs $25k-50k, 6.3% for AGIs $50k-75k, 7.4% for AGIs $75k-100k, 8.3% for AGIs $100k-200k, 7.6% for AGIs over 200k)
Earned income credit: $2,119 (reported on 16.0% of returns)
Here:
$2,119
State:
$2,094
(% of AGI for various income ranges: 5.1% for AGIs below $25k, 0.9% for AGIs $25k-50k)
Percentage of individuals using paid preparers for their 2012 taxes: 45.6%
Here:
46%
State:
54%
(% for various income ranges: 41.9% for AGIs below $25k, 42.8% for AGIs $25k-50k, 51.3% for AGIs $50k-75k, 53.6% for AGIs $75k-100k, 52.4% for AGIs $100k-200k, 66.7% for AGIs over 200k)
Averages for the 2004 tax year for zip code 53110, filed in 2005:
Average Adjusted Gross Income (AGI) in 2004: $37,801 (Individual Income Tax Returns)
Here:
$37,801
State:
$47,735
Salary/wage: $35,908 (reported on 85.7% of returns)
Here:
$35,908
State:
$41,540
(% of AGI for various income ranges: 74.6% for AGIs below $10k, 73.4% for AGIs $10k-25k, 83.9% for AGIs $25k-50k, 84.3% for AGIs $50k-75k, 86.0% for AGIs $75k-100k, 71.6% for AGIs over 100k)
Taxable interest for individuals: $981 (reported on 48.7% of returns)
This zip code:
$981
Wisconsin:
$1,420
(% of AGI for various income ranges: 5.2% for AGIs below $10k, 2.5% for AGIs $10k-25k, 1.0% for AGIs $25k-50k, 0.8% for AGIs $50k-75k, 1.2% for AGIs $75k-100k, 1.2% for AGIs over 100k)
Taxable dividends: $1,280 (reported on 22.9% of returns)
Here:
$1,280
State:
$2,869
(% of AGI for various income ranges: 2.0% for AGIs below $10k, 1.0% for AGIs $10k-25k, 0.7% for AGIs $25k-50k, 0.5% for AGIs $50k-75k, 0.6% for AGIs $75k-100k, 1.2% for AGIs over 100k)
Net capital gain/loss: +$4,375 (reported on 14.6% of returns)
Here:
+$4,375
State:
+$9,569
(% of AGI for various income ranges: -1.1% for AGIs below $10k, 0.3% for AGIs $10k-25k, 0.5% for AGIs $25k-50k, 0.5% for AGIs $50k-75k, 1.2% for AGIs $75k-100k, 9.2% for AGIs over 100k)
Profit/loss from business: +$7,666 (reported on 7.9% of returns)
Here:
+$7,666
State:
+$10,417
(% of AGI for various income ranges: 3.0% for AGIs below $10k, 3.0% for AGIs $10k-25k, 1.1% for AGIs $25k-50k, 1.5% for AGIs $50k-75k, 1.0% for AGIs $75k-100k, 2.2% for AGIs over 100k)
IRA payment deduction: $2,422 (reported on 2.1% of returns)
53110:
$2,422
Wisconsin:
$2,900
(% of AGI for various income ranges: 0.2% for AGIs $10k-25k, 0.2% for AGIs $25k-50k, 0.1% for AGIs $50k-75k, 0.1% for AGIs $75k-100k)
Self-employed pension: $6,429 (reported on 0.2% of returns)
Here:
$6,429
Wisconsin:
$11,934
Total itemized deductions: $14,287 (23% of AGI, reported on 34.9% of returns)
Here:
$14,287
State:
$18,160
Here:
23.3% of AGI
State:
21.1% of AGI
(% of AGI for various income ranges: 12.5% for AGIs below $10k, 8.5% for AGIs $10k-25k, 11.2% for AGIs $25k-50k, 14.6% for AGIs $50k-75k, 16.4% for AGIs $75k-100k, 14.4% for AGIs over 100k)
Charity contributions deductions: $1,567 (2% of AGI, reported on 29.2% of returns)
Here:
$1,567
State:
$2,711
Here:
2.5% of AGI
State:
3.0% of AGI
(% of AGI for various income ranges: 0.5% for AGIs below $10k, 0.7% for AGIs $10k-25k, 0.9% for AGIs $25k-50k, 1.3% for AGIs $50k-75k, 1.7% for AGIs $75k-100k, 1.7% for AGIs over 100k)
Total tax: $4,298 (reported on 77.6% of returns)
53110:
$4,298
State:
$7,114
(% of AGI for various income ranges: 1.5% for AGIs below $10k, 4.3% for AGIs $10k-25k, 7.5% for AGIs $25k-50k, 8.8% for AGIs $50k-75k, 10.1% for AGIs $75k-100k, 15.2% for AGIs over 100k)
Earned income credit: $1,538 (reported on 12.5% of returns)
Here:
$1,538
State:
$1,544
Percentage of individuals using paid preparers for their 2004 taxes: 51.1%
Here:
51%
State:
57%
(% for various income ranges: 41.9% for AGIs below $10k, 50.6% for AGIs $10k-25k, 52.5% for AGIs $25k-50k, 56.5% for AGIs $50k-75k, 54.7% for AGIs $75k-100k, 52.9% for AGIs over 100k)
Likely homosexual households (counted as self-reported same-sex unmarried-partner households)
Lesbian couples: 0.4% of all households
Gay men: 0.3% of all households
Household received Food Stamps/SNAP in the past 12 months: 1,288 Household did not receive Food Stamps/SNAP in the past 12 months: 7,577
Women who had a birth in the past 12 months: 210 (150 now married, 60 unmarried) Women who did not have a birth in the past 12 months: 3,776 (1,268 now married, 2,507 unmarried)
Housing units in zip code 53110 with a mortgage: 3,353 (293 second mortgage, 215 both second mortgage and home equity loan) Houses without a mortgage: 50
Median monthly owner costs for units with a mortgage: $1,394 Median monthly owner costs for units without a mortgage: $661
Residents with income below the poverty level in 2022:
This zip code:
12.3%
Whole state:
10.7%
Residents with income below 50% of the poverty level in 2022:
This zip code:
7.2%
Whole state:
5.7%
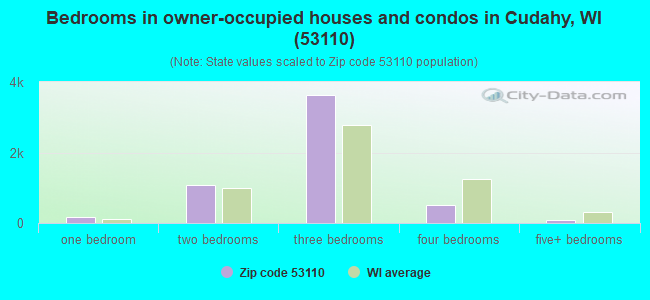
Median number of rooms in houses and condos:
Here:
5.6
State:
6.5
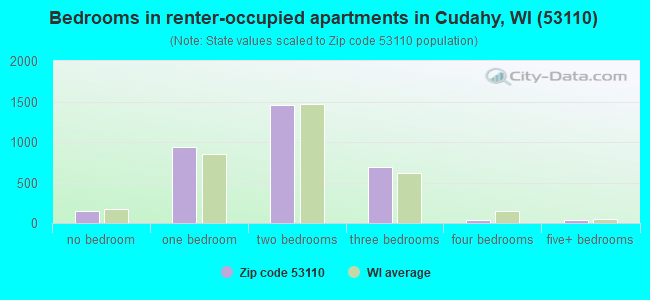
Median number of rooms in apartments:
Here:
4.0
State:
4.1
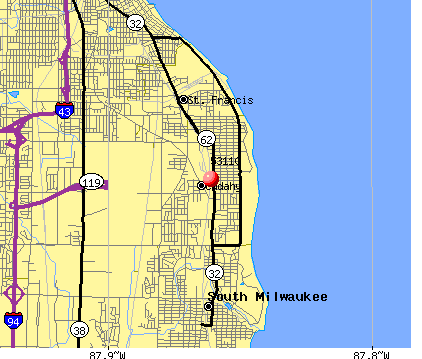
Notable locations in this zip code not listed on our city pages
Notable locations in zip code 53110: Cudahy Water Works (A), Warnimont Golf Course (B), Cudahy Stadium (C), Cudahy Family Library (D), Cudahy Fire Department and Rescue Squad Station 2 (E), Cudahy Fire Department and Rescue Squad Station 1 (F), Cudahy Municipal Building (G), Cudahy Memorial Library (H), Cudahy Branch YMCA (I). Display/hide their locations on the map
Churches in zip code 53110 include: Saint Fredericks Roman Catholic Church (A), Grace Chapel (B), Holy Family Roman Catholic Church (C), Svetinikol Orthodox Church (D), Cudahy Methodist Church (E), Saint Johns Evangelical Lutheran Church (F), Saint Joseph Roman Catholic Church (G), Saint Marks Evangelical Lutheran Church (H), Saint Pauls Evangelical Lutheran Church (I). Display/hide their locations on the map
Parks in zip code 53110 include: Cudahy Park (1), Ladish Park (2), Sheridan Park (3), Pulaski Park (4), Warnimont Park (5). Display/hide their locations on the map
1,381 married couples with children.
1,223 single-parent households (245 men, 978 women).
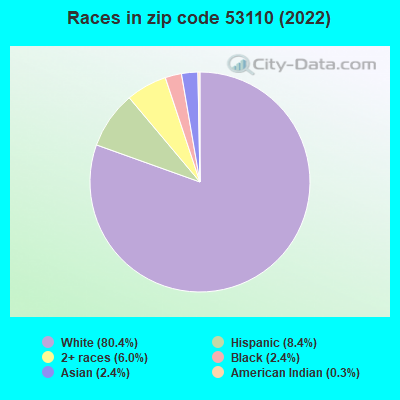
88.8% of residents of 53110 zip code speak English at home.
5.8% of residents speak Spanish at home (70% very well, 8% well, 16% not well, 6% not at all).
2.8% of residents speak other Indo-European language at home (61% very well, 32% well, 4% not well, 3% not at all).
2.4% of residents speak Asian or Pacific Island language at home (33% very well, 49% well, 18% not well).
0.7% of residents speak other language at home (100% very well).
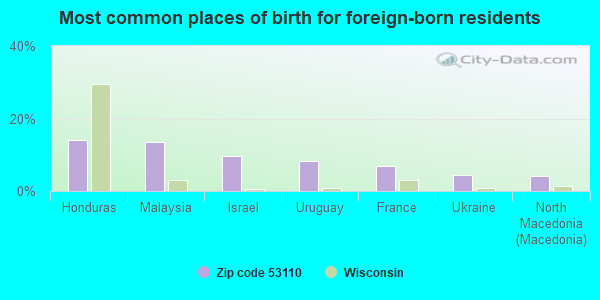
Foreign born population: 1,145 (6.3%) (55.7% of them are naturalized citizens)
This zip code:
6.3%
Whole state:
5.0%
14%Honduras
14%Malaysia
10%Israel
8%Uruguay
7%France
5%Ukraine
4%North Macedonia (Macedonia)
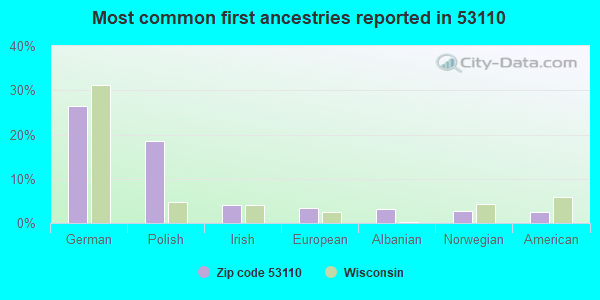
26%German
18%Polish
4%Irish
3%European
3%Albanian
3%Norwegian
2%American
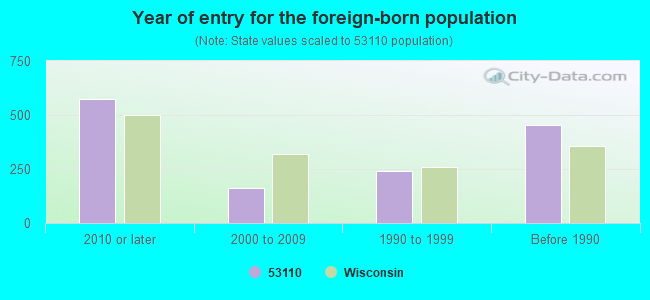
Year of entry for the foreign-born population
5752010 or later
1622000 to 2009
2421990 to 1999
455Before 1990
Facilities with environmental interests located in this zip code:
AMERICAN WELDING& ENGINEERING (6001 S PENNSYLVANIA AVE in CUDAHY, WI)
AIR MINOR (AIRS/AFS) CRITERIA AND HAZARDOUS AIR POLLUTANT INVENTORY (Inventory of air pollution sources) Small Quantity Generators, between 100 kg and 1000 kg of hazardous waste/month (Resource Conservation and Recovery Act (tracking hazardous waste)) - notification STATE MASTER (Wisconsin database) - NEI-WI241079300, AIR PROGRAM, RCRAINFO-WID006097513, SQG Business SIC classification: FABRICATED PLATE WORK (BOILER SHOPS); INDUSTRIAL AND COMMERCIAL MACHINERY AND EQUIPMENT Business NAICS classification: PLATE WORK MANUFACTURING.; METAL TANK (HEAVY GAUGE) MANUFACTURING. Organizations: AIKEN TERRENCE (CONTACT/OWNER)
Alternative names: AMERICAN WELDING AND ENGEG CO
ACE WORLD WIDE MOVING& STORAGE CO (1900 E COLLEGE AVE in CUDAHY, WI)
Conditionally Exempt Small Quantity Generators, less than 100 kg/month of hazardous waste (Resource Conservation and Recovery Act (tracking hazardous waste)) STATE MASTER (Wisconsin database) - RCRAINFO-WID003969417, CESQG Business SIC classification: TRUCKING, EXCEPT LOCAL
AFFORDABLE AUTO BODY INC (5975 S PACKARD AVE in CUDAHY, WI)
Conditionally Exempt Small Quantity Generators, less than 100 kg/month of hazardous waste (Resource Conservation and Recovery Act (tracking hazardous waste)) - notification STATE MASTER (Wisconsin database) - RCRAINFO-WID988588067, CESQG Organizations: ROBB GREGORY J NAD HELM DONALD (CONTACT/OWNER)
ASTRO TOOL& DIE CORP (5201 S WHITALL AVE in CUDAHY, WI)
Conditionally Exempt Small Quantity Generators, less than 100 kg/month of hazardous waste (Resource Conservation and Recovery Act (tracking hazardous waste)) STATE MASTER (Wisconsin database) - RCRAINFO-WID006548952, CESQG Business SIC classification: FABRICATED METAL PRODUCTS
BULK PETROLEUM CORP (2415 E LAYTON AVE in CUDAHY, WI)
Conditionally Exempt Small Quantity Generators, less than 100 kg/month of hazardous waste (Resource Conservation and Recovery Act (tracking hazardous waste)) - notification STATE MASTER (Wisconsin database) - RCRAINFO-WID988640264, CESQG
BULK PETROLEUM CORP - CITGO #202 (2400 E COLLEGE AVE in CUDAHY, WI)
Conditionally Exempt Small Quantity Generators, less than 100 kg/month of hazardous waste (Resource Conservation and Recovery Act (tracking hazardous waste)) - notification STATE MASTER (Wisconsin database) - RCRAINFO-WID988640272, CESQG
CHICAGO NORTHWESTERN RAILROAD (5000 S WHITNAL in CUDAHY, WI)
(Resource Conservation and Recovery Act (tracking hazardous waste)) Organizations: CHICAGO NORTHWESTERN RR (CONTACT/OWNER)
COACHCRAFT AUTO BODY (3441 E RAMSEY in CUDAHY, WI)
(Resource Conservation and Recovery Act (tracking hazardous waste))
BOSTROM SEATING INC. (3326 EAST LAYTON in CUDAHY, WI)
AIR MINOR (AIRS/AFS) Business SIC classification: PUBLIC BUILDING AND RELATED FURNITURE
Housing units lacking complete plumbing facilities: 0.7% Housing units lacking complete kitchen facilities: 1.9%
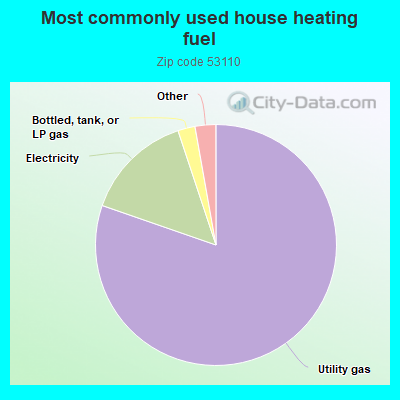
80.4%Utility gas
14.6%Electricity
2.3%Bottled, tank, or LP gas
0.9%No fuel used
0.8%Fuel oil, kerosene, etc.
0.6%Other fuel
Population in 1990: 18,659.
Place of birth for U.S.-born residents:
This state: 14,409
Northeast: 223
Midwest: 1,341
South: 403
West: 272
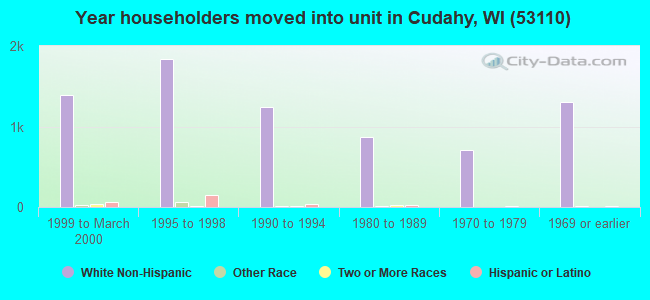
59% of the 53110 zip code residents lived in the same house 5 years ago. Out of people who lived in different houses, 83% lived in this county. Out of people who lived in different counties, 50% lived in Wisconsin.
89% of the 53110 zip code residents lived in the same house 1 year ago. Out of people who lived in different houses, 73% moved from this county. Out of people who lived in different houses, 8% moved from different county within same state. Out of people who lived in different houses, 10% moved from different state. Out of people who lived in different houses, 4% moved from abroad.
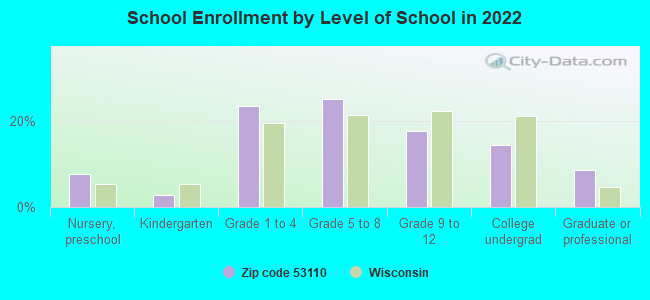
Private vs. public school enrollment:
Students in private schools in grades 1 to 8 (elementary and middle school): 187
Here:
14.2%
Wisconsin:
16.7%
Students in private schools in grades 9 to 12 (high school): 92
Here:
19.0%
Wisconsin:
12.5%
Students in private undergraduate colleges: 14
Here:
3.6%
Wisconsin:
17.5%
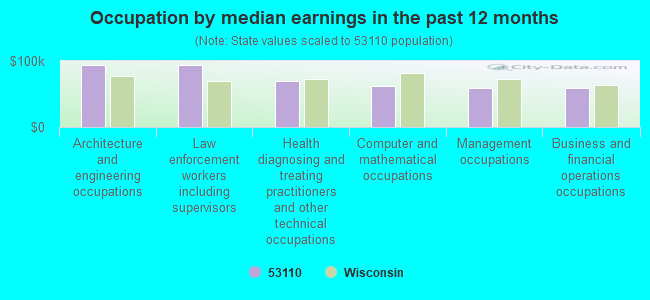
Occupation by median earnings in the past 12 months ($)
94,213Architecture and engineering occupations
93,693Law enforcement workers including supervisors
68,968Health diagnosing and treating practitioners and other technical occupations
61,847Computer and mathematical occupations
59,835Management occupations
59,641Business and financial operations occupations
Companies with federal contracts located in this zip code (CUDAHY, WI):
GENERAL ELECTRIC COMPANY (INC) (2200 E COLLEGE AVE) : $29,215,573 in 132 contractsfrom 1999 to 2006
Contracts for X-Ray Equipment and Supplies: Medical, Dental, Veterinary, Medical and Surgical Instruments, Equipment, and Supplies, Maintenance, Repair and Rebuilding of Equipment -- Miscellaneous, Maintenance, Repair and Rebuilding of Equipment -- Instruments and Laboratory Equipment, and moreby Defense Logistics Agency, Department of Veterans Affairs Signed by year:2000: $19,382,587; 2001: $938,000; 2002: $1,470,177; 2003: $658,346; 2004: $565,595; 2005: $1,184,320; 2006: $103,656.
Biggest contracts:
$2,705,799 with Defense Logistics Agency for X-Ray Equipment and Supplies: Medical, Dental, Veterinary. Signed on 2000-07-27. Completion date: 2000-12-03.
$1,607,960, same as above.Signed on 2000-05-12. Completion date: 2000-09-08.
$1,382,056, same as above.Signed on 2000-07-03. Completion date: 2000-10-28.
$1,174,083, same as above.Signed on 1999-12-21. Completion date: 2000-09-25.
ACTUANT CORPORATION (5877 S PENNSYLVANIA AVE; small business) : $2,197,273 in 30 contractsfrom 2000 to 2005
Contracts for Miscellaneous Power Transmission Equipment, Deck Machinery, Hardware, Weapon System, Packing and Gasket Materials by Navy, Defense Logistics Agency Signed by year:2000: $56,576; 2001: $217,458; 2002: $424,364; 2003: $167,648; 2004: $403,804; 2005: $927,423; 2006: $0.
Biggest contracts:
$230,159 with Navy for Miscellaneous Power Transmission Equipment. Signed on 2005-12-06. Completion date: 2006-08-03.
$226,344 with Navy for Deck Machinery. Signed on 2002-04-10. Completion date: 2002-11-18.
$188,312, same as above.Signed on 2005-11-30. Completion date: 2007-01-10.
$156,927, same as above.Signed on 2005-09-06. Completion date: 2006-05-16.
MAN LIFT ENGINEERING, LLC (2129 E BIRCHWOOD AVE; small business) : $862,491 in 2 contractsfrom 2002 to 2004
$766,391 with Air Force for Aircraft Ground Servicing Equipment. Signed on 2004-08-18. Completion date: 2004-12-09.
$96,100 with Army for Material Handling Equipment, Nonself-Propelled. Taking place in OR. Signed on 2002-09-24. Completion date: 2003-01-16.
REXNORD INDUSTRIES INC (5150 INTERNATIONAL DR) : $93,505 in 8 contractsfrom 2000 to 2006
Contracts for Electrical Control Equipment, Miscellaneous Power Transmission Equipment, Coils and Transformers by Defense Logistics Agency, Navy Signed by year:2000: $48,904; 2001: $0; 2002: $0; 2003: $0; 2004: $5,570; 2005: $21,817; 2006: $17,214.
Biggest contracts:
$48,904 with Defense Logistics Agency for Electrical Control Equipment. Signed on 2000-09-30. Completion date: 2000-11-29.
$17,214, same as above.Signed on 2006-04-29. Completion date: 2006-06-30.
$10,955, same as above.Signed on 2005-12-12. Completion date: 2006-02-10.
$10,955, same as above.Signed on 2005-12-12. Completion date: 2006-02-10.
HURON FABRICATION & MACHINE CO (5355 S KIRKWOOD AVE) : $55,574 in 2 contractsfrom 2002 to 2004
$46,000 with NASA for Construction of Structures and Facilities -- Exhibit Design (Non-Building). Signed on 2002-09-15. Completion date: 2002-12-15.
$9,574 with Defense Logistics Agency for Miscellaneous Vehicular Components. Taking place in NE. Signed on 2004-10-01. Completion date: 2005-09-30.
Top industries in this zip code by the number of employees in 2005:
Health Care and Social Assistance: General Medical and Surgical Hospitals (250-499 employees: 1 establishment)
Administrative and Support and Waste Management and Remediation Services: Janitorial Services (100-249: 1, 10-19: 1, 1-4: 4)
Health Care and Social Assistance: Offices of Physicians (except Mental Health Specialists) (50-99: 1, 20-49: 3, 5-9: 1, 1-4: 3)
Management of Companies and Enterprises: Corporate, Subsidiary, and Regional Managing Offices (100-249: 1, 10-19: 1, 1-4: 2)
Administrative and Support and Waste Management and Remediation Services: Landscaping Services (100-249: 1, 1-4: 2)
People in group quarters in 2010:
37 people in group homes intended for adults
17 people in nursing facilities/skilled-nursing facilities
12 people in workers' group living quarters and job corps centers
People in group quarters in 2000:
32 people in other nonhousehold living situations
32 people in other noninstitutional group quarters
18 people in homes for the mentally retarded
17 people in religious group quarters
16 people in other group homes
Fatal accident statistics in 2012:
Fatal accident count: 1
Vehicles involved in fatal accidents: 2
Fatal accidents caused by drunken drivers: 1
Fatalities: 1
Persons involved in fatal accidents: 3
Pedestrians involved in fatal accidents: 0
Fatal accident statistics in 2010:
Fatal accident count: 1
Vehicles involved in fatal accidents: 1
Fatal accidents caused by drunken drivers: 0
Fatalities: 1
Persons involved in fatal accidents: 1
Pedestrians involved in fatal accidents: 1
Home Mortgage Disclosure Act Aggregated Statistics For Year 2009 (Based on 9 full and 4 partial tracts)
A) FHA, FSA/RHS & VA Home Purchase Loans
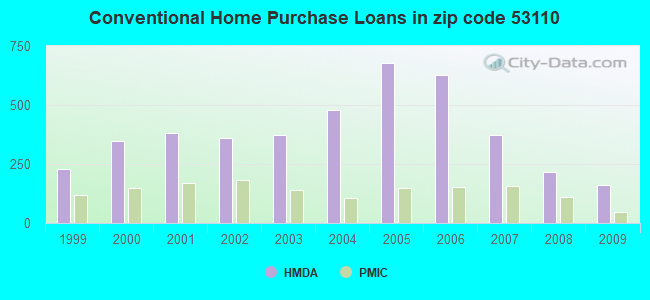
B) Conventional Home Purchase Loans
C) Refinancings
D) Home Improvement Loans
E) Loans on Dwellings For 5+ Families
F) Non-occupant Loans on < 5 Family Dwellings (A B C & D)
G) Loans On Manufactured Home Dwelling (A B C & D)
Number
Average Value
Number
Average Value
Number
Average Value
Number
Average Value
Number
Average Value
Number
Average Value
Number
Average Value
LOANS ORIGINATED
114
$141,257
161
$100,944
739
$127,510
44
$31,086
9
$976,617
22
$107,766
2
$31,790
APPLICATIONS APPROVED, NOT ACCEPTED
1
$151,520
16
$140,874
59
$133,001
10
$14,892
2
$391,275
0
$0
0
$0
APPLICATIONS DENIED
7
$113,437
45
$130,673
281
$149,331
35
$38,969
4
$196,362
23
$160,938
0
$0
APPLICATIONS WITHDRAWN
7
$143,056
25
$99,092
193
$150,900
8
$64,726
2
$446,615
10
$99,977
0
$0
FILES CLOSED FOR INCOMPLETENESS
0
$0
5
$97,140
49
$136,357
0
$0
0
$0
4
$119,822
0
$0
Aggregated Statistics For Year 2008 (Based on 9 full and 4 partial tracts)
A) FHA, FSA/RHS & VA Home Purchase Loans
B) Conventional Home Purchase Loans
C) Refinancings
D) Home Improvement Loans
E) Loans on Dwellings For 5+ Families
F) Non-occupant Loans on < 5 Family Dwellings (A B C & D)
G) Loans On Manufactured Home Dwelling (A B C & D)
Number
Average Value
Number
Average Value
Number
Average Value
Number
Average Value
Number
Average Value
Number
Average Value
Number
Average Value
LOANS ORIGINATED
87
$142,311
214
$126,658
454
$135,008
59
$33,087
7
$286,530
54
$107,659
0
$0
APPLICATIONS APPROVED, NOT ACCEPTED
2
$108,980
17
$126,864
62
$129,627
20
$47,954
0
$0
7
$54,100
2
$11,920
APPLICATIONS DENIED
11
$139,500
36
$138,575
281
$152,208
39
$55,752
1
$500,000
13
$171,708
2
$30,800
APPLICATIONS WITHDRAWN
4
$116,798
18
$136,836
145
$158,335
12
$75,356
0
$0
13
$147,129
0
$0
FILES CLOSED FOR INCOMPLETENESS
2
$154,375
6
$158,940
44
$143,278
9
$27,656
0
$0
3
$115,383
0
$0
Aggregated Statistics For Year 2007 (Based on 9 full and 4 partial tracts)
A) FHA, FSA/RHS & VA Home Purchase Loans
B) Conventional Home Purchase Loans
C) Refinancings
D) Home Improvement Loans
E) Loans on Dwellings For 5+ Families
F) Non-occupant Loans on < 5 Family Dwellings (A B C & D)
G) Loans On Manufactured Home Dwelling (A B C & D)
Number
Average Value
Number
Average Value
Number
Average Value
Number
Average Value
Number
Average Value
Number
Average Value
Number
Average Value
LOANS ORIGINATED
34
$157,405
371
$121,378
574
$123,083
88
$37,483
15
$537,706
77
$116,202
2
$13,910
APPLICATIONS APPROVED, NOT ACCEPTED
0
$0
41
$107,279
105
$118,219
29
$49,696
0
$0
10
$105,609
0
$0
APPLICATIONS DENIED
11
$168,154
77
$123,252
355
$139,804
87
$43,676
0
$0
25
$103,674
0
$0
APPLICATIONS WITHDRAWN
7
$189,263
45
$109,586
175
$142,696
11
$54,649
0
$0
7
$111,181
0
$0
FILES CLOSED FOR INCOMPLETENESS
0
$0
12
$125,186
57
$148,270
0
$0
0
$0
0
$0
0
$0
Aggregated Statistics For Year 2006 (Based on 9 full and 4 partial tracts)
A) FHA, FSA/RHS & VA Home Purchase Loans
B) Conventional Home Purchase Loans
C) Refinancings
D) Home Improvement Loans
E) Loans on Dwellings For 5+ Families
F) Non-occupant Loans on < 5 Family Dwellings (A B C & D)
Number
Average Value
Number
Average Value
Number
Average Value
Number
Average Value
Number
Average Value
Number
Average Value
LOANS ORIGINATED
39
$149,347
628
$122,472
721
$113,372
114
$32,478
7
$1,503,526
81
$146,641
APPLICATIONS APPROVED, NOT ACCEPTED
2
$149,505
53
$128,561
136
$118,238
23
$65,549
1
$360,000
14
$122,510
APPLICATIONS DENIED
8
$163,082
102
$118,580
340
$137,296
72
$48,576
0
$0
25
$129,199
APPLICATIONS WITHDRAWN
5
$137,614
68
$126,447
240
$132,916
10
$58,523
0
$0
12
$101,559
FILES CLOSED FOR INCOMPLETENESS
0
$0
11
$137,229
78
$133,434
2
$91,980
0
$0
5
$102,468
Aggregated Statistics For Year 2005 (Based on 9 full and 4 partial tracts)
A) FHA, FSA/RHS & VA Home Purchase Loans
B) Conventional Home Purchase Loans
C) Refinancings
D) Home Improvement Loans
E) Loans on Dwellings For 5+ Families
F) Non-occupant Loans on < 5 Family Dwellings (A B C & D)
G) Loans On Manufactured Home Dwelling (A B C & D)
Number
Average Value
Number
Average Value
Number
Average Value
Number
Average Value
Number
Average Value
Number
Average Value
Number
Average Value
LOANS ORIGINATED
43
$154,304
680
$117,283
944
$114,373
128
$37,958
16
$449,327
114
$121,935
3
$18,507
APPLICATIONS APPROVED, NOT ACCEPTED
2
$165,450
59
$126,067
104
$124,930
22
$31,539
0
$0
12
$176,020
0
$0
APPLICATIONS DENIED
12
$158,756
110
$98,902
391
$132,847
64
$50,425
0
$0
23
$130,169
2
$17,885
APPLICATIONS WITHDRAWN
7
$169,094
60
$120,136
279
$137,414
26
$95,005
0
$0
16
$125,696
0
$0
FILES CLOSED FOR INCOMPLETENESS
0
$0
19
$116,349
172
$131,463
3
$108,967
0
$0
10
$118,267
0
$0
Aggregated Statistics For Year 2004 (Based on 9 full and 4 partial tracts)
A) FHA, FSA/RHS & VA Home Purchase Loans
B) Conventional Home Purchase Loans
C) Refinancings
D) Home Improvement Loans
E) Loans on Dwellings For 5+ Families
F) Non-occupant Loans on < 5 Family Dwellings (A B C & D)
G) Loans On Manufactured Home Dwelling (A B C & D)
Number
Average Value
Number
Average Value
Number
Average Value
Number
Average Value
Number
Average Value
Number
Average Value
Number
Average Value
LOANS ORIGINATED
47
$139,582
480
$111,612
866
$107,321
98
$28,796
8
$935,120
86
$115,551
4
$31,748
APPLICATIONS APPROVED, NOT ACCEPTED
1
$125,000
37
$116,669
103
$112,869
17
$53,748
0
$0
0
$0
0
$0
APPLICATIONS DENIED
11
$141,282
78
$117,939
341
$111,079
68
$54,836
1
$50,000
23
$111,990
4
$35,230
APPLICATIONS WITHDRAWN
5
$119,056
61
$128,569
207
$114,824
11
$27,220
2
$676,835
10
$149,779
0
$0
FILES CLOSED FOR INCOMPLETENESS
2
$92,340
16
$121,002
114
$120,958
0
$0
0
$0
5
$137,160
0
$0
Aggregated Statistics For Year 2003 (Based on 9 full and 4 partial tracts)
A) FHA, FSA/RHS & VA Home Purchase Loans
B) Conventional Home Purchase Loans
C) Refinancings
D) Home Improvement Loans
E) Loans on Dwellings For 5+ Families
F) Non-occupant Loans on < 5 Family Dwellings (A B C & D)
Number
Average Value
Number
Average Value
Number
Average Value
Number
Average Value
Number
Average Value
Number
Average Value
LOANS ORIGINATED
48
$134,614
375
$107,221
1,689
$95,460
100
$18,041
12
$1,710,149
126
$101,841
APPLICATIONS APPROVED, NOT ACCEPTED
0
$0
16
$95,557
141
$105,291
6
$27,675
2
$311,660
14
$90,716
APPLICATIONS DENIED
1
$135,000
51
$99,830
434
$103,805
43
$17,486
0
$0
18
$96,053
APPLICATIONS WITHDRAWN
3
$113,393
53
$103,251
184
$109,358
9
$18,353
0
$0
16
$102,582
FILES CLOSED FOR INCOMPLETENESS
2
$157,285
10
$271,190
57
$102,591
0
$0
0
$0
2
$93,205
Aggregated Statistics For Year 2002 (Based on 9 full and 4 partial tracts)
A) FHA, FSA/RHS & VA Home Purchase Loans
B) Conventional Home Purchase Loans
C) Refinancings
D) Home Improvement Loans
E) Loans on Dwellings For 5+ Families
F) Non-occupant Loans on < 5 Family Dwellings (A B C & D)
Number
Average Value
Number
Average Value
Number
Average Value
Number
Average Value
Number
Average Value
Number
Average Value
LOANS ORIGINATED
59
$114,200
361
$101,386
1,337
$93,523
117
$16,496
15
$299,485
95
$98,081
APPLICATIONS APPROVED, NOT ACCEPTED
3
$128,637
18
$100,219
140
$91,056
6
$28,195
0
$0
4
$97,218
APPLICATIONS DENIED
5
$114,350
23
$116,654
336
$105,063
44
$8,616
1
$250,000
14
$113,940
APPLICATIONS WITHDRAWN
6
$134,392
50
$93,334
183
$100,497
13
$28,436
3
$805,167
11
$104,400
FILES CLOSED FOR INCOMPLETENESS
2
$88,350
3
$86,960
35
$116,177
0
$0
0
$0
0
$0
Aggregated Statistics For Year 2001 (Based on 9 full and 4 partial tracts)
A) FHA, FSA/RHS & VA Home Purchase Loans
B) Conventional Home Purchase Loans
C) Refinancings
D) Home Improvement Loans
E) Loans on Dwellings For 5+ Families
F) Non-occupant Loans on < 5 Family Dwellings (A B C & D)
Number
Average Value
Number
Average Value
Number
Average Value
Number
Average Value
Number
Average Value
Number
Average Value
LOANS ORIGINATED
76
$112,714
382
$97,990
1,119
$88,370
106
$18,647
15
$962,278
73
$88,886
APPLICATIONS APPROVED, NOT ACCEPTED
5
$119,232
17
$79,908
123
$75,354
7
$7,640
0
$0
3
$89,307
APPLICATIONS DENIED
6
$98,170
36
$80,019
308
$81,494
38
$9,987
0
$0
11
$87,238
APPLICATIONS WITHDRAWN
4
$82,582
27
$105,332
199
$86,292
10
$21,599
0
$0
3
$82,810
FILES CLOSED FOR INCOMPLETENESS
0
$0
12
$89,777
48
$109,040
0
$0
0
$0
4
$80,895
Aggregated Statistics For Year 2000 (Based on 9 full and 4 partial tracts)
A) FHA, FSA/RHS & VA Home Purchase Loans
B) Conventional Home Purchase Loans
C) Refinancings
D) Home Improvement Loans
E) Loans on Dwellings For 5+ Families
F) Non-occupant Loans on < 5 Family Dwellings (A B C & D)
Number
Average Value
Number
Average Value
Number
Average Value
Number
Average Value
Number
Average Value
Number
Average Value
LOANS ORIGINATED
78
$110,159
347
$90,529
275
$65,271
122
$15,998
7
$332,504
37
$79,921
APPLICATIONS APPROVED, NOT ACCEPTED
0
$0
28
$80,211
63
$72,574
17
$15,248
0
$0
4
$30,742
APPLICATIONS DENIED
7
$114,511
60
$72,312
187
$75,386
52
$11,763
0
$0
8
$103,771
APPLICATIONS WITHDRAWN
0
$0
21
$103,829
70
$72,745
16
$19,920
2
$697,690
5
$62,312
FILES CLOSED FOR INCOMPLETENESS
1
$122,060
5
$85,338
22
$100,488
2
$2,915
0
$0
0
$0
Aggregated Statistics For Year 1999 (Based on 4 full and 2 partial tracts)
A) FHA, FSA/RHS & VA Home Purchase Loans
B) Conventional Home Purchase Loans
C) Refinancings
D) Home Improvement Loans
E) Loans on Dwellings For 5+ Families
F) Non-occupant Loans on < 5 Family Dwellings (A B C & D)
2002 - 2018 National Fire Incident Reporting System (NFIRS) incidents
According to the data from the years 2002 - 2018 the average number of fire incidents per year is 57. The highest number of reported fire incidents - 101 took place in 2009, and the least - 8 in 2002. The data has an increasing trend.
When looking into fire subcategories, the most incidents belonged to: Structure Fires (57.0%), and Outside Fires (23.7%).
Fire incident types reported to NFIRS in Zip Code 53110


 Nearest zip codes: 53235, 53172, 53207, 53154, 53221, 53204.
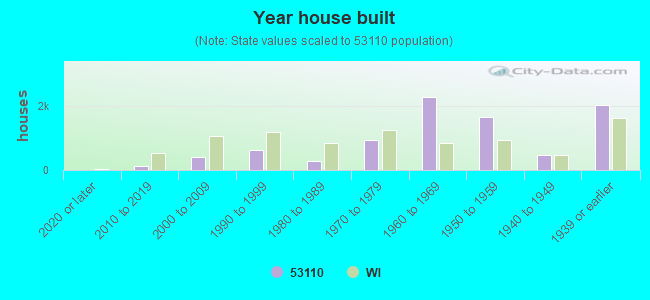


 According to the data from the years 2002 - 2018 the average number of fire incidents per year is 57. The highest number of reported fire incidents - 101 took place in 2009, and the least - 8 in 2002. The data has an increasing trend.
 When looking into fire subcategories, the most incidents belonged to: Structure Fires (57.0%), and Outside Fires (23.7%).