Estimated zip code population in 2022: 4,031 Zip code population in 2010: 4,052 Zip code population in 2000: 3,938
Houses and condos: 1,744 Renter-occupied apartments: 397
% of renters here:
24%
State:
32%
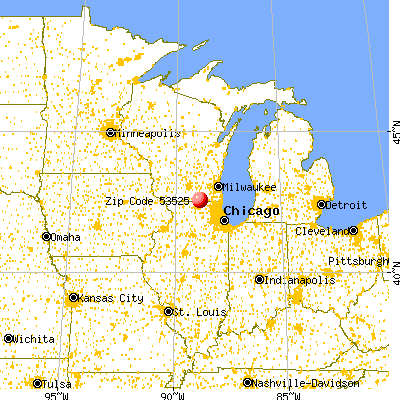
March 2022 cost of living index in zip code 53525: 87.6 (less than average, U.S. average is 100)
Land area: 55.8 sq. mi. Water area: 0.2 sq. mi.
Population density: 72 people per square mile
(very low).
OSM Map
General Map
Google Map
MSN Map
OSM Map
General Map
Google Map
MSN Map
OSM Map
General Map
Google Map
MSN Map
OSM Map
General Map
Google Map
MSN Map
Please wait while loading the map...
Real estate property taxes paid for housing units in 2022:
This zip code:
1.5% ($3,561)
Wisconsin:
1.4% ($3,497)
Median real estate property taxes paid for housing units with mortgages in 2022: $3,700 (1.5%) Median real estate property taxes paid for housing units with no mortgage in 2022: $3,287 (1.6%)
Business Search- 14 Million verified businesses
Males: 2,044
(50.7%)
Females: 1,986
(49.3%)
For population 25 years and over in 53525:
High school or higher: 90.3%
Bachelor's degree or higher: 20.3%
Graduate or professional degree: 5.3%
Unemployed: 5.2%
Mean travel time to work (commute): 23.1 minutes
For population 15 years and over in 53525:
Never married: 25.3%
Now married: 56.6%
Separated: 1.3%
Widowed: 7.3%
Divorced: 9.6%
Zip code 53525 compared to state average:
Unemployed percentage above state average.
Black race population percentage significantly below state average.
Median age above state average.
Length of stay since moving in significantly above state average.
Percentage of population with a bachelor's degree or higher below state average.
Estimated median house/condo value in 2022: $230,186
53525:
$230,186
Wisconsin:
$252,800
According to our research of Wisconsin and other state lists, there were 8 registered sex offenders living in 53525 zip code as of June 15, 2024. The ratio of all residents to sex offenders in zip code 53525 is 501 to 1. The ratio of registered sex offenders to all residents in this zip code is lower than the state average.
Median resident age:
This zip code:
46.0 years
Wisconsin median age:
40.4 years
Average household size:
This zip code:
2.4 people
Wisconsin:
2.3 people
Averages for the 2020 tax year for zip code 53525, filed in 2021:
Average Adjusted Gross Income (AGI) in 2020: $67,138 (Individual Income Tax Returns)
Here:
$67,138
State:
$72,319
Salary/wage: $52,317 (reported on 83.1% of returns)
Here:
$52,317
State:
$59,242
(% of AGI for various income ranges: 1216.2% for AGIs below $25k, 3740.3% for AGIs $25k-50k, 6767.4% for AGIs $50k-75k, 9477.9% for AGIs $75k-100k, 15570.6% for AGIs $100k-200k)
Taxable interest for individuals: $1,738 (reported on 33.3% of returns)
This zip code:
$1,738
Wisconsin:
$1,431
(% of AGI for various income ranges: 25.4% for AGIs below $25k, 28.1% for AGIs $25k-50k, 48.7% for AGIs $50k-75k, 97.1% for AGIs $75k-100k, 61.1% for AGIs $100k-200k)
Ordinary dividends: $8,134 (reported on 16.4% of returns)
Here:
$8,134
State:
$6,481
(% of AGI for various income ranges: 17.4% for AGIs below $25k, 32.2% for AGIs $25k-50k, 42.6% for AGIs $50k-75k, 76.4% for AGIs $75k-100k, 165.6% for AGIs $100k-200k)
Net capital gain/loss in AGI: +$14,600 (reported on 13.8% of returns)
Here:
+$14,600
State:
+$18,329
(% of AGI for various income ranges: 30.0% for AGIs $25k-50k, 41.7% for AGIs $50k-75k, 122.9% for AGIs $75k-100k, 765.6% for AGIs $100k-200k)
Profit/loss from business: +$10,075 (reported on 12.3% of returns)
Here:
+$10,075
State:
+$14,562
(% of AGI for various income ranges: 114.4% for AGIs below $25k, 107.3% for AGIs $25k-50k, 218.7% for AGIs $50k-75k, 197.1% for AGIs $75k-100k, 442.2% for AGIs $100k-200k)
Taxable individual retirement arrangement distribution: $33,175 (reported on 12.3% of returns)
53525:
$33,175
Wisconsin:
$19,348
(% of AGI for various income ranges: 68.2% for AGIs below $25k, 118.9% for AGIs $25k-50k, 340.4% for AGIs $50k-75k, 510.0% for AGIs $75k-100k, 1128.3% for AGIs $100k-200k)
Total itemized deductions: $30,189 (reported on 4.6% of returns)
Here:
$30,189
State:
$33,000
(% of AGI for various income ranges: 328.7% for AGIs $50k-75k, 702.9% for AGIs $75k-100k)
Charity contributions: $8,114 (reported on 3.6% of returns)
Here:
$8,114
State:
$12,044
(% of AGI for various income ranges: 219.3% for AGIs $75k-100k)
Taxes paid: $8,422 (reported on 4.6% of returns)
53525:
$8,422
State:
$8,228
(% of AGI for various income ranges: 86.1% for AGIs $50k-75k, 207.1% for AGIs $75k-100k)
Earned income credit: $2,361 (reported on 11.8% of returns)
Here:
$2,361
State:
$2,155
(% of AGI for various income ranges: 81.3% for AGIs below $25k, 61.1% for AGIs $25k-50k)
Percentage of individuals using paid preparers for their 2020 taxes: 94.9%
Here:
95%
State:
94%
(% for various income ranges: 94.6% for AGIs below $25k, 95.7% for AGIs $25k-50k, 91.2% for AGIs $50k-75k, 95.2% for AGIs $75k-100k, 100.0% for AGIs $100k-200k, 87.5% for AGIs over 200k)
Averages for the 2012 tax year for zip code 53525, filed in 2013:
Average Adjusted Gross Income (AGI) in 2012: $61,946 (Individual Income Tax Returns)
Here:
$61,946
State:
$57,939
Salary/wage: $44,999 (reported on 87.6% of returns)
Here:
$44,999
State:
$48,248
(% of AGI for various income ranges: 72.2% for AGIs below $25k, 79.7% for AGIs $25k-50k, 73.1% for AGIs $50k-75k, 82.0% for AGIs $75k-100k, 76.6% for AGIs $100k-200k, 20.9% for AGIs over 200k)
Taxable interest for individuals: $1,362 (reported on 34.3% of returns)
This zip code:
$1,362
Wisconsin:
$1,224
(% of AGI for various income ranges: 1.8% for AGIs below $25k, 0.6% for AGIs $25k-50k, 0.7% for AGIs $50k-75k, 0.3% for AGIs $75k-100k, 0.4% for AGIs $100k-200k, 1.2% for AGIs over 200k)
Ordinary dividends: $34,997 (reported on 18.5% of returns)
Here:
$34,997
State:
$5,137
(% of AGI for various income ranges: 1.8% for AGIs below $25k, 0.3% for AGIs $25k-50k, 0.8% for AGIs $50k-75k, 0.5% for AGIs $75k-100k, 0.7% for AGIs $100k-200k, 41.6% for AGIs over 200k)
Net capital gain/loss in AGI: +$5,732 (reported on 15.7% of returns)
Here:
+$5,732
State:
+$11,137
(% of AGI for various income ranges: 0.4% for AGIs below $25k, 0.3% for AGIs $25k-50k, 0.2% for AGIs $50k-75k, 0.2% for AGIs $75k-100k, 2.7% for AGIs $100k-200k, 2.9% for AGIs over 200k)
Profit/loss from business: +$9,675 (reported on 13.5% of returns)
Here:
+$9,675
State:
+$11,943
(% of AGI for various income ranges: 3.2% for AGIs below $25k, 3.1% for AGIs $25k-50k, 2.3% for AGIs $50k-75k, 3.7% for AGIs $75k-100k, 2.2% for AGIs $100k-200k)
Taxable individual retirement arrangement distribution: $23,500 (reported on 11.2% of returns)
53525:
$23,500
Wisconsin:
$14,087
(% of AGI for various income ranges: 2.8% for AGIs below $25k, 2.2% for AGIs $25k-50k, 4.3% for AGIs $50k-75k, 12.9% for AGIs $100k-200k)
Total itemized deductions: $20,064 (18% of AGI, reported on 37.6% of returns)
Here:
$20,064
State:
$22,257
Here:
18.4% of AGI
State:
20.1% of AGI
(% of AGI for various income ranges: 12.1% for AGIs below $25k, 9.3% for AGIs $25k-50k, 13.4% for AGIs $50k-75k, 13.7% for AGIs $75k-100k, 14.6% for AGIs $100k-200k, 10.0% for AGIs over 200k)
Charity contributions: $2,973 (reported on 28.7% of returns)
Here:
$2,973
State:
$3,370
(% of AGI for various income ranges: 0.9% for AGIs below $25k, 0.5% for AGIs $25k-50k, 1.4% for AGIs $50k-75k, 1.6% for AGIs $75k-100k, 2.1% for AGIs $100k-200k, 1.2% for AGIs over 200k)
Taxes paid: $10,382 (reported on 37.6% of returns)
53525:
$10,382
State:
$10,731
(% of AGI for various income ranges: 3.0% for AGIs below $25k, 3.8% for AGIs $25k-50k, 5.5% for AGIs $50k-75k, 7.1% for AGIs $75k-100k, 8.0% for AGIs $100k-200k, 7.2% for AGIs over 200k)
Earned income credit: $2,142 (reported on 13.5% of returns)
Here:
$2,142
State:
$2,094
(% of AGI for various income ranges: 4.3% for AGIs below $25k, 1.1% for AGIs $25k-50k)
Percentage of individuals using paid preparers for their 2012 taxes: 62.9%
Here:
63%
State:
54%
(% for various income ranges: 54.1% for AGIs below $25k, 62.2% for AGIs $25k-50k, 64.3% for AGIs $50k-75k, 68.4% for AGIs $75k-100k, 75.0% for AGIs $100k-200k, 100.0% for AGIs over 200k)
Averages for the 2004 tax year for zip code 53525, filed in 2005:
Average Adjusted Gross Income (AGI) in 2004: $41,121 (Individual Income Tax Returns)
Here:
$41,121
State:
$47,735
Salary/wage: $37,037 (reported on 88.0% of returns)
Here:
$37,037
State:
$41,540
(% of AGI for various income ranges: 151.6% for AGIs below $10k, 75.0% for AGIs $10k-25k, 80.9% for AGIs $25k-50k, 83.8% for AGIs $50k-75k, 82.7% for AGIs $75k-100k, 67.5% for AGIs over 100k)
Taxable interest for individuals: $1,274 (reported on 49.7% of returns)
This zip code:
$1,274
Wisconsin:
$1,420
(% of AGI for various income ranges: 7.8% for AGIs below $10k, 3.0% for AGIs $10k-25k, 1.2% for AGIs $25k-50k, 0.9% for AGIs $50k-75k, 0.6% for AGIs $75k-100k, 2.4% for AGIs over 100k)
Taxable dividends: $1,364 (reported on 22.6% of returns)
Here:
$1,364
State:
$2,869
(% of AGI for various income ranges: 4.0% for AGIs below $10k, 1.3% for AGIs $10k-25k, 0.6% for AGIs $25k-50k, 0.2% for AGIs $50k-75k, 0.3% for AGIs $75k-100k, 1.5% for AGIs over 100k)
Net capital gain/loss: +$3,908 (reported on 17.7% of returns)
Here:
+$3,908
State:
+$9,569
(% of AGI for various income ranges: -3.7% for AGIs below $10k, 0.2% for AGIs $10k-25k, 0.9% for AGIs $25k-50k, 1.5% for AGIs $50k-75k, 1.5% for AGIs $75k-100k, 3.7% for AGIs over 100k)
Profit/loss from business: +$8,487 (reported on 14.2% of returns)
Here:
+$8,487
State:
+$10,417
(% of AGI for various income ranges: -4.0% for AGIs below $10k, 4.1% for AGIs $10k-25k, 2.4% for AGIs $25k-50k, 2.3% for AGIs $50k-75k, 1.9% for AGIs $75k-100k, 4.8% for AGIs over 100k)
IRA payment deduction: $2,826 (reported on 2.4% of returns)
53525:
$2,826
Wisconsin:
$2,900
Self-employed pension: $4,857 (reported on 0.7% of returns)
Here:
$4,857
Wisconsin:
$11,934
Total itemized deductions: $15,808 (22% of AGI, reported on 36.6% of returns)
Here:
$15,808
State:
$18,160
Here:
22.3% of AGI
State:
21.1% of AGI
(% of AGI for various income ranges: 25.9% for AGIs below $10k, 7.8% for AGIs $10k-25k, 10.9% for AGIs $25k-50k, 16.3% for AGIs $50k-75k, 17.6% for AGIs $75k-100k, 13.7% for AGIs over 100k)
Charity contributions deductions: $2,123 (3% of AGI, reported on 31.6% of returns)
Here:
$2,123
State:
$2,711
Here:
2.9% of AGI
State:
3.0% of AGI
(% of AGI for various income ranges: 1.1% for AGIs below $10k, 0.9% for AGIs $10k-25k, 1.1% for AGIs $25k-50k, 1.5% for AGIs $50k-75k, 2.2% for AGIs $75k-100k, 2.1% for AGIs over 100k)
Total tax: $5,245 (reported on 75.7% of returns)
53525:
$5,245
State:
$7,114
(% of AGI for various income ranges: 3.3% for AGIs below $10k, 4.0% for AGIs $10k-25k, 6.9% for AGIs $25k-50k, 8.1% for AGIs $50k-75k, 9.5% for AGIs $75k-100k, 16.7% for AGIs over 100k)
Earned income credit: $1,543 (reported on 11.7% of returns)
Here:
$1,543
State:
$1,544
Percentage of individuals using paid preparers for their 2004 taxes: 65.9%
Here:
66%
State:
57%
(% for various income ranges: 53.8% for AGIs below $10k, 64.3% for AGIs $10k-25k, 68.6% for AGIs $25k-50k, 71.1% for AGIs $50k-75k, 70.1% for AGIs $75k-100k, 81.5% for AGIs over 100k)
Household received Food Stamps/SNAP in the past 12 months: 158 Household did not receive Food Stamps/SNAP in the past 12 months: 1,508
Women who had a birth in the past 12 months: 31 (22 now married, 8 unmarried) Women who did not have a birth in the past 12 months: 760 (361 now married, 398 unmarried)
Housing units in zip code 53525 with a mortgage: 770 (134 second mortgage, 110 both second mortgage and home equity loan) Houses without a mortgage: 6
Median monthly owner costs for units with a mortgage: $1,443 Median monthly owner costs for units without a mortgage: $586
Residents with income below the poverty level in 2022:
This zip code:
6.0%
Whole state:
10.7%
Residents with income below 50% of the poverty level in 2022:
This zip code:
3.6%
Whole state:
5.7%
Median number of rooms in houses and condos:
Here:
6.7
State:
6.5
Median number of rooms in apartments:
Here:
5.9
State:
4.1
Notable locations in this zip code not listed on our city pages
Notable locations in zip code 53525: Clinton Sewage Treatment Plant (A), Clinton Water Works (B), Clinton Village Hall (C), Clinton Fire Protection District (D). Display/hide their locations on the map
Churches in zip code 53525 include: Pella Lutheran Church (A), First United Presbyterian Church (B), Exalt Him Fellowship Church (C), Emmanuel Reformed Church (D), Christ Evangelical Lutheran Church (E). Display/hide their locations on the map
Cemeteries: East Jefferson Prairie Cemetery (1), Saint Catherine Cemetery (2), Clinton Cemetery (3), Clinton Corners Cemetery (4). Display/hide their locations on the map
In group quarters: 74 (-1 institutionalized population)
Size of family households: 601 2-persons, 245 3-persons, 203 4-persons, 68 5-persons, 58 6-persons, 14 7-or-more-persons
Size of nonfamily households: 434 1-person, 34 2-persons, 3 3-persons
532 married couples with children.
211 single-parent households (65 men, 146 women).
93.1% of residents of 53525 zip code speak English at home.
5.5% of residents speak Spanish at home (69% very well, 4% well, 15% not well, 11% not at all).
1.4% of residents speak other Indo-European language at home (58% very well, 42% well).
Foreign born population: 172 (4.3%) (50.9% of them are naturalized citizens)
This zip code:
4.3%
Whole state:
5.0%
62%Honduras
17%Grenada
3%Serbia
3%Ukraine
3%Guyana
32%German
11%Norwegian
7%American
6%Irish
6%Dutch
4%English
4%European
Year of entry for the foreign-born population
122010 or later
252000 to 2009
451990 to 1999
86Before 1990
Facilities with environmental interests located in this zip code:
CLINTON WASTEWATER TREATMENT FACILITY (100 SCOT DRIVE in CLINTON, WI)
National Pollutant Discharge Elimination System NON-MAJOR (Tracking pollutant discharge elimination systems) - permit National Pollutant Discharge Elimination System NON-MAJOR (Tracking pollutant discharge elimination systems) - permit STATE MASTER (Wisconsin database) - PCS-WI0022039, WASTEWATER FACILITY Business SIC classification: SEWERAGE SYSTEMS Organizations: CLINTON SEWAGE TREATMENT PLANT Alternative names: CLINTON SEWAGE TREATMENT PLANT, CLINTON VILLAGE, CLINTON WASTEWATER TREATMT FAC
CLINTON COMMUNITY SCHOOLS (115 MILWAUKEE RD in CLINTON, WI)
Conditionally Exempt Small Quantity Generators, less than 100 kg/month of hazardous waste (Resource Conservation and Recovery Act (tracking hazardous waste)) STATE MASTER (Wisconsin database) - RCRAINFO-WID023604721, CESQG Organizations: CLINTON COMM SCHOOL DIST (CONTACT/OPERATOR)
Alternative names: CLINTON COMMUNITY SCHOOL DIST, CLINTON COMMUNITY SCHOOL DISTRICT
BURLINGTON CONSUMER COOP - CLINTON - FEED MILL (400 N. DODGE STREET in CLINTON, WI)
CRITERIA AND HAZARDOUS AIR POLLUTANT INVENTORY (Inventory of air pollution sources) STATE MASTER (Wisconsin database) - NEI-WI154120890, AIR PROGRAM Business SIC classification: PREPARED FEEDS AND FEED INGREDIENTS FOR ANIMALS AND FOWLS, EXCEPT DOGS AND CATS Business NAICS classification: OTHER ANIMAL FOOD MANUFACTURING.
CLINTON EL (301 EAST ST in CLINTON, WI)
(National Center for Education Statistics) - STATE ID-0040 Organizations: CLINTON COMMUNITY SCH DIST (SCHOOL DISTRICT)
CLINTON HI (112 MILWAUKEE RD in CLINTON, WI)
(National Center for Education Statistics) - STATE ID-0060 Organizations: CLINTON COMMUNITY SCH DIST (SCHOOL DISTRICT)
CLINTON MID (115 MILWAUKEE RD in CLINTON, WI)
(National Center for Education Statistics) - STATE ID-0080 Organizations: CLINTON COMMUNITY SCH DIST (SCHOOL DISTRICT)
CLINTON COMMUNITY SCHOOLS (100 MILWAUKEE ROAD in CLINTON, WI)
COMPLIANCE ACTIVITY (Tracking inspections of insecticide, fungicide, and rodenticide, and toxic substances) Alternative names: CLINTON COMMUNITY SD
Housing units lacking complete kitchen facilities: 1.1%
59.5%Utility gas
26.6%Bottled, tank, or LP gas
9.8%Electricity
2.1%Wood
1.7%Fuel oil, kerosene, etc.
Population in 1990: 3,627. Population change in the 1990s: +311 (+8.6%).
Place of birth for U.S.-born residents:
This state: 2,598
Northeast: 59
Midwest: 1,057
South: 39
West: 104
59% of the 53525 zip code residents lived in the same house 5 years ago. Out of people who lived in different houses, 57% lived in this county. Out of people who lived in different counties, 50% lived in Wisconsin.
93% of the 53525 zip code residents lived in the same house 1 year ago. Out of people who lived in different houses, 60% moved from this county. Out of people who lived in different houses, 26% moved from different county within same state. Out of people who lived in different houses, 12% moved from different state.
Private vs. public school enrollment:
Students in private schools in grades 1 to 8 (elementary and middle school): 29
Here:
7.1%
Wisconsin:
16.7%
Students in private schools in grades 9 to 12 (high school): 9
Here:
3.1%
Wisconsin:
12.5%
Students in private undergraduate colleges: 13
Here:
10.4%
Wisconsin:
17.5%
Occupation by median earnings in the past 12 months ($)
111,022Computer and mathematical occupations
82,154Health diagnosing and treating practitioners and other technical occupations
68,472Architecture and engineering occupations
63,734Management occupations
63,557Installation, maintenance, and repair occupations
63,349Arts, design, entertainment, sports, and media occupations
Companies with federal contracts located in this zip code:
CUSTOM MANUFACTURING INC (606 DELCO DR in CLINTON, WI; small business) : $106,559 in 8 contractsfrom 2005 to 2006
Contracts for Motor Vehicle Maintenance and Repair Shop Specialized Equipment, Power and Hand Pumps by Defense Logistics Agency Signed by year:2000: $0; 2001: $0; 2002: $0; 2003: $0; 2004: $0; 2005: $76,806; 2006: $29,753.
Biggest contracts:
$27,054 with Defense Logistics Agency for Motor Vehicle Maintenance and Repair Shop Specialized Equipment. Signed on 2006-03-17. Completion date: 2006-06-15.
$23,151, same as above.Signed on 2005-07-29. Completion date: 2005-09-30.
$16,224, same as above.Signed on 2005-12-22. Completion date: 2006-03-08.
$15,160, same as above.Signed on 2005-08-04. Completion date: 2005-10-09.
Top industries in this zip code by the number of employees in 2005:
Health Care and Social Assistance: Nursing Care Facilities (50-99 employees: 1 establishment)
Wholesale Trade: Grain and Field Bean Merchant Wholesalers (50-99: 1)
Arts, Entertainment, and Recreation: Bowling Centers (20-49: 1)
Construction: Commercial and Institutional Building Construction (20-49: 1)
Accommodation and Food Services: Full-Service Restaurants (10-19: 1, 5-9: 2)
People in group quarters in 2010:
89 people in nursing facilities/skilled-nursing facilities
People in group quarters in 2000:
58 people in nursing homes
19 people in other group homes
Fatal accident statistics in 2013:
Fatal accident count: 1
Vehicles involved in fatal accidents: 1
Fatal accidents caused by drunken drivers: 0
Fatalities: 1
Persons involved in fatal accidents: 3
Pedestrians involved in fatal accidents: 0
Fatal accident statistics in 2012:
Fatal accident count: 2
Vehicles involved in fatal accidents: 2
Fatal accidents caused by drunken drivers: 1
Fatalities: 2
Persons involved in fatal accidents: 2
Pedestrians involved in fatal accidents: 0
Home Mortgage Disclosure Act Aggregated Statistics For Year 2009 (Based on 4 partial tracts)
A) FHA, FSA/RHS & VA Home Purchase Loans
B) Conventional Home Purchase Loans
C) Refinancings
D) Home Improvement Loans
E) Loans on Dwellings For 5+ Families
F) Non-occupant Loans on < 5 Family Dwellings (A B C & D)
G) Loans On Manufactured Home Dwelling (A B C & D)
Number
Average Value
Number
Average Value
Number
Average Value
Number
Average Value
Number
Average Value
Number
Average Value
Number
Average Value
LOANS ORIGINATED
11
$141,242
27
$121,010
234
$130,257
12
$41,384
2
$206,035
4
$62,375
1
$9,890
APPLICATIONS APPROVED, NOT ACCEPTED
0
$0
2
$157,420
15
$127,527
1
$1,750
0
$0
1
$53,540
0
$0
APPLICATIONS DENIED
0
$0
6
$69,818
92
$138,627
4
$21,890
0
$0
3
$129,220
2
$12,380
APPLICATIONS WITHDRAWN
2
$101,225
4
$122,360
53
$137,351
1
$101,850
0
$0
0
$0
0
$0
FILES CLOSED FOR INCOMPLETENESS
0
$0
1
$83,230
24
$131,631
1
$5,820
0
$0
0
$0
0
$0
Aggregated Statistics For Year 2008 (Based on 4 partial tracts)
A) FHA, FSA/RHS & VA Home Purchase Loans
B) Conventional Home Purchase Loans
C) Refinancings
D) Home Improvement Loans
E) Loans on Dwellings For 5+ Families
F) Non-occupant Loans on < 5 Family Dwellings (A B C & D)
G) Loans On Manufactured Home Dwelling (A B C & D)
Number
Average Value
Number
Average Value
Number
Average Value
Number
Average Value
Number
Average Value
Number
Average Value
Number
Average Value
LOANS ORIGINATED
6
$126,543
44
$134,375
153
$125,560
31
$26,168
4
$223,055
22
$134,014
4
$25,978
APPLICATIONS APPROVED, NOT ACCEPTED
1
$32,010
12
$136,742
20
$146,230
2
$33,810
0
$0
4
$80,622
2
$4,480
APPLICATIONS DENIED
4
$95,850
12
$110,502
107
$143,962
10
$24,146
0
$0
6
$89,995
2
$4,480
APPLICATIONS WITHDRAWN
2
$68,975
4
$157,835
43
$149,292
1
$183,330
0
$0
5
$99,972
0
$0
FILES CLOSED FOR INCOMPLETENESS
0
$0
4
$75,695
12
$129,665
0
$0
0
$0
1
$20,370
0
$0
Aggregated Statistics For Year 2007 (Based on 4 partial tracts)
A) FHA, FSA/RHS & VA Home Purchase Loans
B) Conventional Home Purchase Loans
C) Refinancings
D) Home Improvement Loans
F) Non-occupant Loans on < 5 Family Dwellings (A B C & D)
G) Loans On Manufactured Home Dwelling (A B C & D)
Number
Average Value
Number
Average Value
Number
Average Value
Number
Average Value
Number
Average Value
Number
Average Value
LOANS ORIGINATED
2
$132,580
115
$145,390
168
$110,107
38
$29,782
15
$133,107
2
$4,480
APPLICATIONS APPROVED, NOT ACCEPTED
4
$128,995
8
$74,958
23
$93,508
4
$17,050
1
$52,380
0
$0
APPLICATIONS DENIED
2
$93,165
19
$132,364
113
$130,039
4
$9,222
4
$153,335
1
$9,310
APPLICATIONS WITHDRAWN
0
$0
10
$101,070
24
$110,837
2
$93,945
2
$112,870
0
$0
FILES CLOSED FOR INCOMPLETENESS
0
$0
2
$79,725
17
$157,508
0
$0
1
$314,280
0
$0
Aggregated Statistics For Year 2006 (Based on 4 partial tracts)
A) FHA, FSA/RHS & VA Home Purchase Loans
B) Conventional Home Purchase Loans
C) Refinancings
D) Home Improvement Loans
E) Loans on Dwellings For 5+ Families
F) Non-occupant Loans on < 5 Family Dwellings (A B C & D)
G) Loans On Manufactured Home Dwelling (A B C & D)
Number
Average Value
Number
Average Value
Number
Average Value
Number
Average Value
Number
Average Value
Number
Average Value
Number
Average Value
LOANS ORIGINATED
8
$125,111
136
$135,181
138
$109,946
35
$26,961
2
$806,220
20
$102,932
1
$17,460
APPLICATIONS APPROVED, NOT ACCEPTED
0
$0
22
$117,092
30
$123,697
5
$46,116
0
$0
2
$98,540
2
$67,455
APPLICATIONS DENIED
0
$0
36
$106,016
147
$118,408
9
$46,112
0
$0
5
$48,810
5
$52,160
APPLICATIONS WITHDRAWN
0
$0
23
$115,368
40
$115,069
1
$77,410
0
$0
2
$48,890
0
$0
FILES CLOSED FOR INCOMPLETENESS
0
$0
10
$112,169
45
$125,245
0
$0
0
$0
2
$102,560
0
$0
Aggregated Statistics For Year 2005 (Based on 4 partial tracts)
A) FHA, FSA/RHS & VA Home Purchase Loans
B) Conventional Home Purchase Loans
C) Refinancings
D) Home Improvement Loans
E) Loans on Dwellings For 5+ Families
F) Non-occupant Loans on < 5 Family Dwellings (A B C & D)
G) Loans On Manufactured Home Dwelling (A B C & D)
Number
Average Value
Number
Average Value
Number
Average Value
Number
Average Value
Number
Average Value
Number
Average Value
Number
Average Value
LOANS ORIGINATED
2
$95,850
129
$100,255
208
$101,832
48
$25,815
4
$2,249,002
31
$89,683
2
$10,435
APPLICATIONS APPROVED, NOT ACCEPTED
0
$0
14
$120,134
27
$113,463
4
$19,370
0
$0
4
$92,715
2
$61,810
APPLICATIONS DENIED
0
$0
20
$73,760
131
$110,941
24
$37,513
0
$0
9
$73,147
1
$21,530
APPLICATIONS WITHDRAWN
2
$70,770
20
$81,938
84
$131,085
4
$193,985
0
$0
5
$196,002
0
$0
FILES CLOSED FOR INCOMPLETENESS
0
$0
8
$84,376
55
$142,134
2
$41,540
0
$0
0
$0
0
$0
Aggregated Statistics For Year 2004 (Based on 4 partial tracts)
A) FHA, FSA/RHS & VA Home Purchase Loans
B) Conventional Home Purchase Loans
C) Refinancings
D) Home Improvement Loans
F) Non-occupant Loans on < 5 Family Dwellings (A B C & D)
G) Loans On Manufactured Home Dwelling (A B C & D)
Number
Average Value
Number
Average Value
Number
Average Value
Number
Average Value
Number
Average Value
Number
Average Value
LOANS ORIGINATED
0
$0
115
$107,818
204
$103,742
67
$16,113
31
$98,218
4
$13,290
APPLICATIONS APPROVED, NOT ACCEPTED
0
$0
9
$88,402
24
$102,694
2
$58,165
2
$70,770
0
$0
APPLICATIONS DENIED
2
$117,350
34
$82,731
110
$104,960
23
$41,367
6
$115,030
6
$8,838
APPLICATIONS WITHDRAWN
0
$0
18
$96,546
66
$116,427
1
$14,550
0
$0
0
$0
FILES CLOSED FOR INCOMPLETENESS
0
$0
0
$0
36
$124,191
0
$0
0
$0
0
$0
Aggregated Statistics For Year 2003 (Based on 4 partial tracts)
A) FHA, FSA/RHS & VA Home Purchase Loans
B) Conventional Home Purchase Loans
C) Refinancings
D) Home Improvement Loans
E) Loans on Dwellings For 5+ Families
F) Non-occupant Loans on < 5 Family Dwellings (A B C & D)
Number
Average Value
Number
Average Value
Number
Average Value
Number
Average Value
Number
Average Value
Number
Average Value
LOANS ORIGINATED
4
$86,640
100
$112,742
467
$97,110
46
$17,242
2
$2,806,625
29
$65,966
APPLICATIONS APPROVED, NOT ACCEPTED
0
$0
3
$85,943
33
$98,714
7
$10,870
0
$0
0
$0
APPLICATIONS DENIED
4
$75,248
27
$77,780
165
$112,481
11
$7,703
2
$541,960
8
$81,059
APPLICATIONS WITHDRAWN
2
$122,725
14
$117,297
57
$118,190
0
$0
0
$0
7
$78,830
FILES CLOSED FOR INCOMPLETENESS
2
$116,455
1
$97,190
6
$120,553
0
$0
0
$0
0
$0
Aggregated Statistics For Year 2002 (Based on 4 partial tracts)
A) FHA, FSA/RHS & VA Home Purchase Loans
B) Conventional Home Purchase Loans
C) Refinancings
D) Home Improvement Loans
F) Non-occupant Loans on < 5 Family Dwellings (A B C & D)
Number
Average Value
Number
Average Value
Number
Average Value
Number
Average Value
Number
Average Value
LOANS ORIGINATED
5
$96,746
100
$96,985
360
$89,370
33
$16,868
13
$84,229
APPLICATIONS APPROVED, NOT ACCEPTED
2
$64,500
8
$130,941
25
$100,810
1
$3,490
2
$53,750
APPLICATIONS DENIED
0
$0
26
$74,470
70
$122,398
31
$15,626
13
$176,304
APPLICATIONS WITHDRAWN
0
$0
18
$155,328
68
$93,565
2
$22,395
0
$0
FILES CLOSED FOR INCOMPLETENESS
0
$0
2
$124,515
14
$120,437
0
$0
0
$0
Aggregated Statistics For Year 2001 (Based on 4 partial tracts)
A) FHA, FSA/RHS & VA Home Purchase Loans
B) Conventional Home Purchase Loans
C) Refinancings
D) Home Improvement Loans
E) Loans on Dwellings For 5+ Families
F) Non-occupant Loans on < 5 Family Dwellings (A B C & D)
Number
Average Value
Number
Average Value
Number
Average Value
Number
Average Value
Number
Average Value
Number
Average Value
LOANS ORIGINATED
4
$100,778
90
$92,887
326
$86,802
66
$20,872
1
$1,396,800
22
$79,483
APPLICATIONS APPROVED, NOT ACCEPTED
0
$0
12
$62,963
36
$85,577
7
$14,524
0
$0
0
$0
APPLICATIONS DENIED
4
$92,715
12
$56,904
83
$81,656
12
$14,684
0
$0
1
$65,770
APPLICATIONS WITHDRAWN
0
$0
8
$108,016
57
$88,346
4
$13,265
0
$0
4
$45,238
FILES CLOSED FOR INCOMPLETENESS
0
$0
2
$101,505
8
$84,155
0
$0
0
$0
0
$0
Aggregated Statistics For Year 2000 (Based on 4 partial tracts)
A) FHA, FSA/RHS & VA Home Purchase Loans
B) Conventional Home Purchase Loans
C) Refinancings
D) Home Improvement Loans
F) Non-occupant Loans on < 5 Family Dwellings (A B C & D)
Number
Average Value
Number
Average Value
Number
Average Value
Number
Average Value
Number
Average Value
LOANS ORIGINATED
6
$114,292
86
$104,552
101
$74,056
36
$24,492
14
$75,782
APPLICATIONS APPROVED, NOT ACCEPTED
0
$0
5
$87,862
21
$108,301
2
$17,915
1
$65,180
APPLICATIONS DENIED
0
$0
36
$45,171
63
$83,581
12
$8,974
2
$25,080
APPLICATIONS WITHDRAWN
0
$0
11
$70,405
31
$74,556
1
$12,800
1
$6,400
FILES CLOSED FOR INCOMPLETENESS
0
$0
2
$170,200
17
$83,571
1
$14,550
0
$0
Aggregated Statistics For Year 1999 (Based on 2 partial tracts)
A) FHA, FSA/RHS & VA Home Purchase Loans
B) Conventional Home Purchase Loans
C) Refinancings
D) Home Improvement Loans
E) Loans on Dwellings For 5+ Families
F) Non-occupant Loans on < 5 Family Dwellings (A B C & D)
Detailed PMIC statistics for the following Tracts:0026.02
, 0033.00
2002 - 2018 National Fire Incident Reporting System (NFIRS) incidents
According to the data from the years 2002 - 2018 the average number of fires per year is 15. The highest number of fires - 50 took place in 2015, and the least - 1 in 2002. The data has an increasing trend.
When looking into fire subcategories, the most reports belonged to: Structure Fires (60.0%), and Outside Fires (24.7%).
Fire incident types reported to NFIRS in Zip Code 53525


 Nearest zip codes: 53114, 53505, 53546, 61080, 53585, 61065.


 According to the data from the years 2002 - 2018 the average number of fires per year is 15. The highest number of fires - 50 took place in 2015, and the least - 1 in 2002. The data has an increasing trend.
 When looking into fire subcategories, the most reports belonged to: Structure Fires (60.0%), and Outside Fires (24.7%).