Estimated zip code population in 2022: 419 Zip code population in 2010: 367 Zip code population in 2000: 412
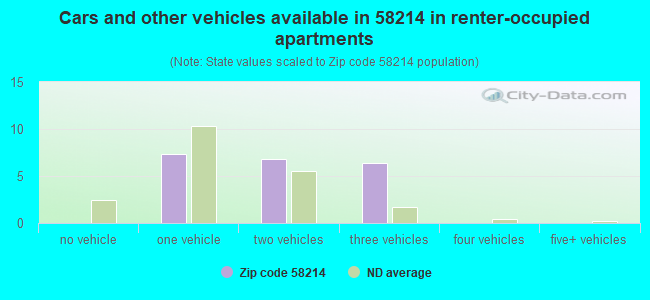
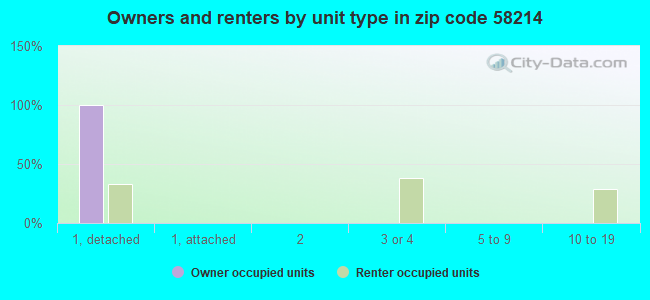
Houses and condos: 285 Renter-occupied apartments: 20
% of renters here:
11%
State:
35%
March 2022 cost of living index in zip code 58214: 79.5 (low, U.S. average is 100)
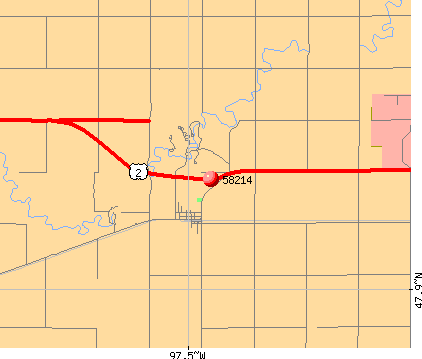
Land area: 69.0 sq. mi. Water area: 0.0 sq. mi.
Population density: 6 people per square mile
(very low).
OSM Map
General Map
Google Map
MSN Map
OSM Map
General Map
Google Map
MSN Map
OSM Map
General Map
Google Map
MSN Map
OSM Map
General Map
Google Map
MSN Map
Please wait while loading the map...
Real estate property taxes paid for housing units in 2022:
This zip code:
0.8% ($1,590)
North Dakota:
1.0% ($2,347)
Median real estate property taxes paid for housing units with mortgages in 2022: $1,859 (0.7%) Median real estate property taxes paid for housing units with no mortgage in 2022: $964 (1.0%)
Business Search- 14 Million verified businesses
Males: 207
(49.5%)
Females: 211
(50.5%)
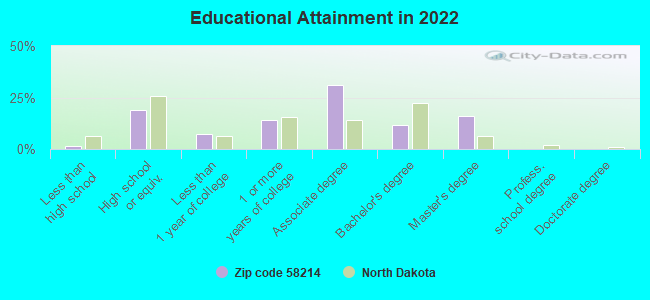
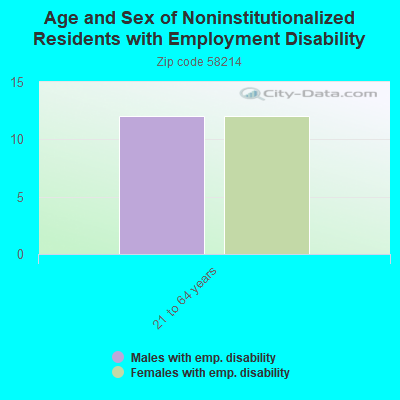
For population 25 years and over in 58214:
High school or higher: 98.6%
Bachelor's degree or higher: 27.4%
Graduate or professional degree: 15.8%
Mean travel time to work (commute): 34.0 minutes
For population 15 years and over in 58214:
Never married: 12.6%
Now married: 79.9%
Separated: 0.0%
Widowed: 3.1%
Divorced: 4.4%
Zip code 58214 compared to state average:
Unemployed percentage significantly below state average.
Black race population percentage significantly below state average.
Hispanic race population percentage significantly below state average.
Median age significantly above state average.
Foreign-born population percentage significantly below state average.
Renting percentage significantly below state average.
Length of stay since moving in significantly above state average.
Number of college students significantly below state average.
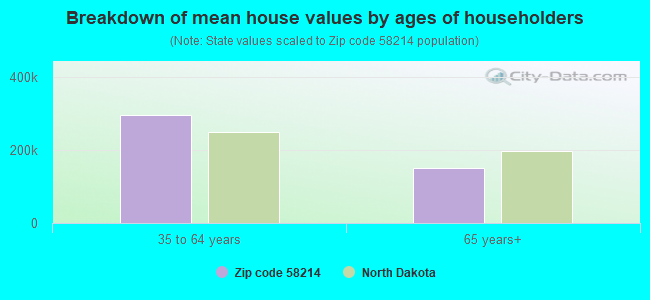
Estimated median house/condo value in 2022: $210,478
58214:
$210,478
North Dakota:
$243,100
Median resident age:
This zip code:
50.2 years
North Dakota median age:
36.2 years
Average household size:
This zip code:
2.2 people
North Dakota:
2.3 people
Averages for the 2020 tax year for zip code 58214, filed in 2021:
Average Adjusted Gross Income (AGI) in 2020: $83,294 (Individual Income Tax Returns)
Here:
$83,294
State:
$77,891
Salary/wage: $60,838 (reported on 76.5% of returns)
Here:
$60,838
State:
$59,202
(% of AGI for various income ranges: 1345.0% for AGIs below $25k, 2940.0% for AGIs $25k-50k, 4950.0% for AGIs $75k-100k)
Taxable interest for individuals: $1,100 (reported on 35.3% of returns)
This zip code:
$1,100
North Dakota:
$2,112
(% of AGI for various income ranges: 20.0% for AGIs below $25k)
Ordinary dividends: $5,767 (reported on 17.6% of returns)
Here:
$5,767
State:
$5,239
(% of AGI for various income ranges: 576.7% for AGIs $75k-100k)
Net capital gain/loss in AGI: +$16,250 (reported on 11.8% of returns)
Here:
+$16,250
State:
+$17,618
(% of AGI for various income ranges: 1083.3% for AGIs $25k-50k)
Profit/loss from business: +$300 (reported on 11.8% of returns)
Here:
+$300
State:
+$12,375
(% of AGI for various income ranges: 30.0% for AGIs below $25k)
Percentage of individuals using paid preparers for their 2020 taxes: 88.2%
Here:
88%
State:
95%
(% for various income ranges: 80.0% for AGIs below $25k, 100.0% for AGIs $25k-50k, 66.7% for AGIs $50k-75k, 100.0% for AGIs $75k-100k, 100.0% for AGIs $100k-200k)
Averages for the 2012 tax year for zip code 58214, filed in 2013:
Average Adjusted Gross Income (AGI) in 2012: $54,795 (Individual Income Tax Returns)
Here:
$54,795
State:
$70,683
Salary/wage: $40,653 (reported on 81.0% of returns)
Here:
$40,653
State:
$48,615
(% of AGI for various income ranges: 76.8% for AGIs below $25k, 70.6% for AGIs $25k-50k, 73.1% for AGIs $50k-75k, 83.1% for AGIs $75k-100k, 34.5% for AGIs $100k-200k)
Taxable interest for individuals: $314 (reported on 33.3% of returns)
This zip code:
$314
North Dakota:
$1,659
Ordinary dividends: $1,067 (reported on 14.3% of returns)
Here:
$1,067
State:
$4,855
Net capital gain/loss in AGI: +$400 (reported on 9.5% of returns)
Here:
+$400
State:
+$26,078
Profit/loss from business: +$700 (reported on 9.5% of returns)
Here:
+$700
State:
+$14,112
Earned income credit: $2,150 (reported on 9.5% of returns)
Here:
$2,150
State:
$1,989
(% of AGI for various income ranges: 4.9% for AGIs below $25k)
Percentage of individuals using paid preparers for their 2012 taxes: 52.4%
Here:
52%
State:
59%
(% for various income ranges: 37.5% for AGIs below $25k, 75.0% for AGIs $25k-50k, 100.0% for AGIs $50k-75k, 66.7% for AGIs $100k-200k)
Averages for the 2004 tax year for zip code 58214, filed in 2005:
Average Adjusted Gross Income (AGI) in 2004: $36,730 (Individual Income Tax Returns)
Here:
$36,730
State:
$40,108
Salary/wage: $32,528 (reported on 81.5% of returns)
Here:
$32,528
State:
$33,868
(% of AGI for various income ranges: 138.0% for AGIs below $10k, 64.0% for AGIs $10k-25k, 69.8% for AGIs $25k-50k, 82.5% for AGIs $50k-75k, 64.2% for AGIs $75k-100k)
Taxable interest for individuals: $702 (reported on 47.0% of returns)
This zip code:
$702
North Dakota:
$1,652
(% of AGI for various income ranges: 1.9% for AGIs below $10k, 0.9% for AGIs $10k-25k, 2.0% for AGIs $25k-50k, 0.6% for AGIs $50k-75k, 0.2% for AGIs $75k-100k)
Taxable dividends: $450 (reported on 20.0% of returns)
Here:
$450
State:
$2,207
Net capital gain/loss: +$250 (reported on 14.0% of returns)
Here:
+$250
State:
+$6,573
Profit/loss from business: +$1,167 (reported on 9.0% of returns)
Here:
+$1,167
State:
+$8,636
Profit/loss from farming: +$19,312 (reported on 8.0% of returns)
Here:
+$19,312
State:
+$1,979
Total itemized deductions: $13,636 (26% of AGI, reported on 11.0% of returns)
Here:
$13,636
State:
$16,683
Here:
26.0% of AGI
State:
18.6% of AGI
Charity contributions deductions: $500 (1% of AGI, reported on 6.0% of returns)
Here:
$500
State:
$3,523
Here:
0.9% of AGI
State:
3.6% of AGI
Total tax: $4,267 (reported on 80.5% of returns)
58214:
$4,267
State:
$5,748
(% of AGI for various income ranges: 4.6% for AGIs below $10k, 5.0% for AGIs $10k-25k, 7.0% for AGIs $25k-50k, 9.2% for AGIs $50k-75k, 13.5% for AGIs $75k-100k)
Earned income credit: $1,737 (reported on 9.5% of returns)
Here:
$1,737
State:
$1,558
Percentage of individuals using paid preparers for their 2004 taxes: 64.5%
Here:
64%
State:
63%
(% for various income ranges: 65.8% for AGIs below $10k, 65.4% for AGIs $10k-25k, 63.0% for AGIs $25k-50k, 70.6% for AGIs $50k-75k, 54.5% for AGIs $75k-100k)
Size of family households: 71 2-persons, 43 3-persons, 21 4-persons, 7 7-or-more-persons
Size of nonfamily households: 43 1-person
72 married couples with children.
14 single-parent households (14 women).
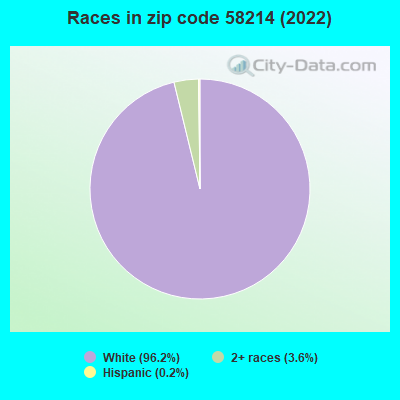
98.3% of residents of 58214 zip code speak English at home.
1.4% of residents speak other Indo-European language at home (100% very well).
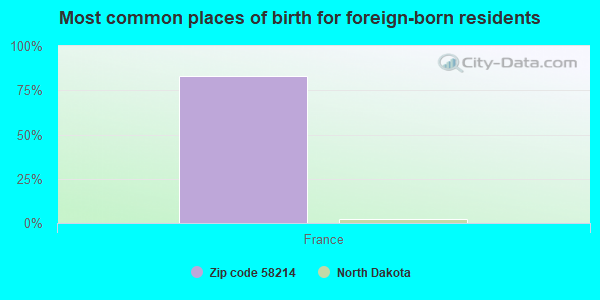
Foreign born population: 6 (1.5%) (100.0% of them are naturalized citizens)
This zip code:
1.5%
Whole state:
4.9%
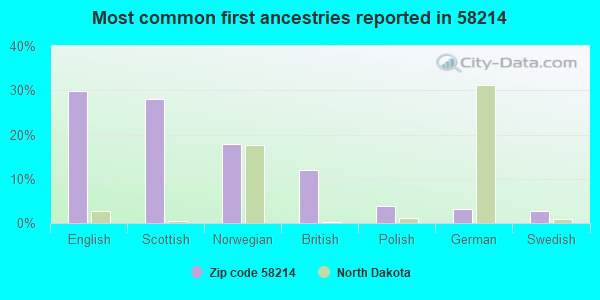
83%France
30%English
28%Scottish
18%Norwegian
12%British
4%Polish
3%German
3%Swedish
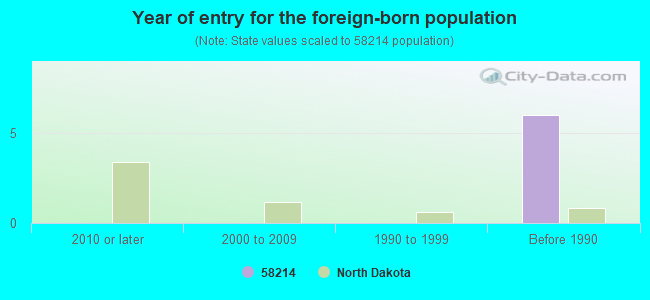
Year of entry for the foreign-born population
02010 or later
02000 to 2009
01990 to 1999
6Before 1990
Housing units lacking complete plumbing facilities: 1.6%
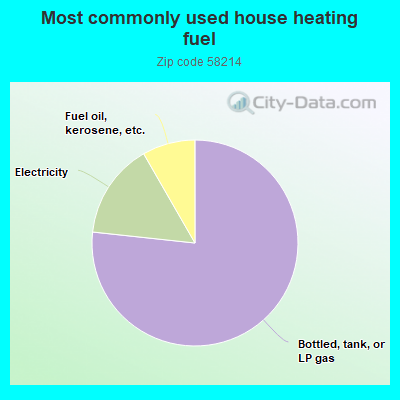
77.7%Bottled, tank, or LP gas
15.2%Electricity
8.4%Fuel oil, kerosene, etc.
Population in 1990: 529.
Place of birth for U.S.-born residents:
This state: 212
Northeast: 91
Midwest: 34
South: 60
West: 12
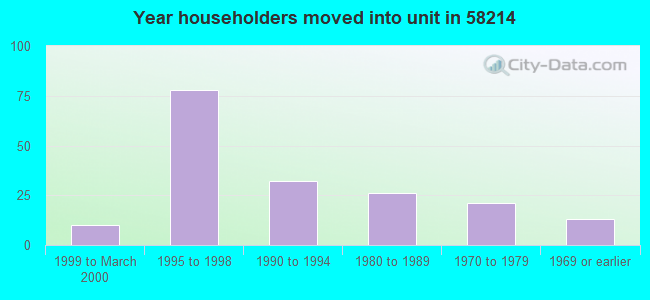
59% of the 58214 zip code residents lived in the same house 5 years ago. Out of people who lived in different houses, 73% lived in this county. Out of people who lived in different counties, 50% lived in North Dakota.
102% of the 58214 zip code residents lived in the same house 1 year ago.
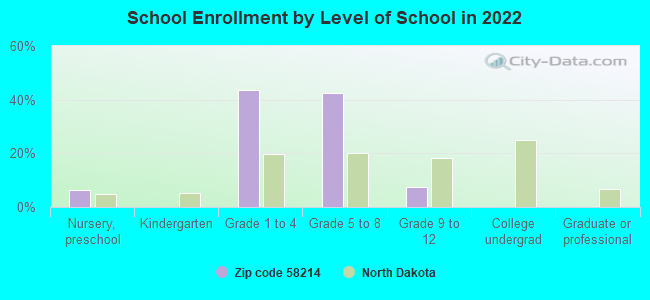
Private vs. public school enrollment:
Students in private schools in grades 1 to 8 (elementary and middle school):
Here:
0.0%
North Dakota:
8.4%
Students in private schools in grades 9 to 12 (high school):
Here:
0.0%
North Dakota:
8.2%
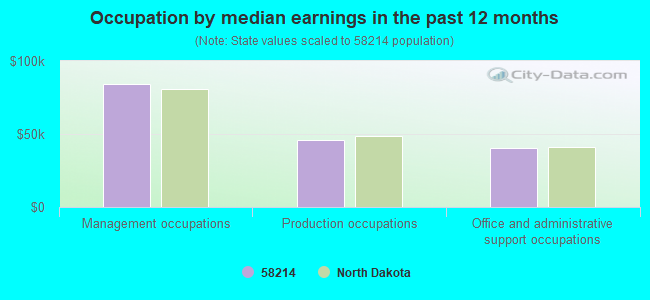
Occupation by median earnings in the past 12 months ($)
84,050Management occupations
45,631Production occupations
40,576Office and administrative support occupations
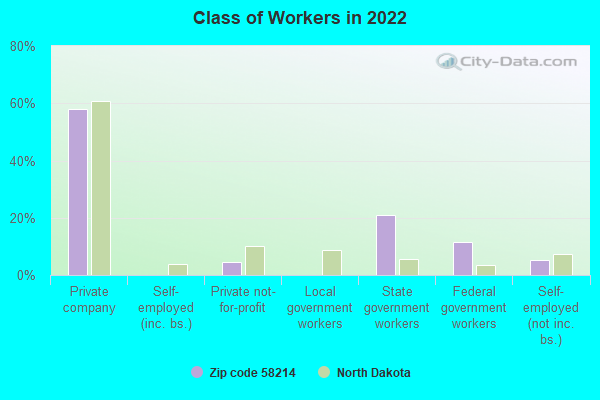
Top industries in this zip code by the number of employees in 2005:
Wholesale Trade: Grain and Field Bean Merchant Wholesalers (10-19 employees: 1 establishment)
Construction: Site Preparation Contractors (5-9: 1)
Professional, Scientific, and Technical Services: Other Accounting Services (1-4: 1)
Other Services (except Public Administration): Business Associations (1-4: 1)
Other Services (except Public Administration): Religious Organizations (1-4: 1)
Accommodation and Food Services: Drinking Places (Alcoholic Beverages) (1-4: 1)
Fatal accident statistics in 2013:
Fatal accident count: 1
Vehicles involved in fatal accidents: 2
Fatal accidents caused by drunken drivers: 0
Fatalities: 1
Persons involved in fatal accidents: 3
Pedestrians involved in fatal accidents: 0
Fatal accident statistics in 2010:
Fatal accident count: 1
Vehicles involved in fatal accidents: 2
Fatal accidents caused by drunken drivers: 0
Fatalities: 1
Persons involved in fatal accidents: 9
Pedestrians involved in fatal accidents: 0
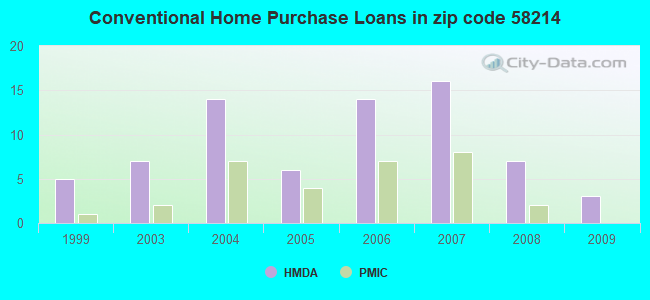
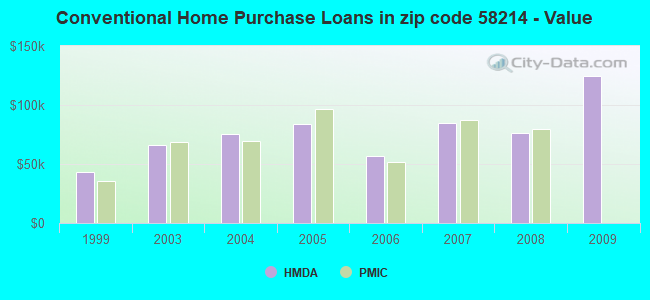
Home Mortgage Disclosure Act Aggregated Statistics For Year 2009 (Based on 2 partial tracts)
A) FHA, FSA/RHS & VA Home Purchase Loans
B) Conventional Home Purchase Loans
C) Refinancings
D) Home Improvement Loans
E) Loans on Dwellings For 5+ Families
F) Non-occupant Loans on < 5 Family Dwellings (A B C & D)
G) Loans On Manufactured Home Dwelling (A B C & D)
Number
Average Value
Number
Average Value
Number
Average Value
Number
Average Value
Number
Average Value
Number
Average Value
Number
Average Value
LOANS ORIGINATED
8
$97,379
3
$124,643
18
$111,438
3
$56,460
1
$118,110
2
$77,150
1
$49,250
APPLICATIONS APPROVED, NOT ACCEPTED
1
$69,860
0
$0
1
$94,490
1
$6,030
0
$0
0
$0
0
$0
APPLICATIONS DENIED
2
$77,150
0
$0
8
$100,771
1
$5,030
0
$0
0
$0
0
$0
APPLICATIONS WITHDRAWN
2
$122,130
0
$0
3
$79,913
1
$7,540
0
$0
0
$0
0
$0
FILES CLOSED FOR INCOMPLETENESS
0
$0
0
$0
2
$85,695
1
$36,190
0
$0
0
$0
0
$0
Aggregated Statistics For Year 2008 (Based on 2 partial tracts)
A) FHA, FSA/RHS & VA Home Purchase Loans
B) Conventional Home Purchase Loans
C) Refinancings
D) Home Improvement Loans
F) Non-occupant Loans on < 5 Family Dwellings (A B C & D)
G) Loans On Manufactured Home Dwelling (A B C & D)
Number
Average Value
Number
Average Value
Number
Average Value
Number
Average Value
Number
Average Value
Number
Average Value
LOANS ORIGINATED
11
$92,433
7
$76,610
11
$75,573
3
$34,513
3
$65,003
2
$37,190
APPLICATIONS APPROVED, NOT ACCEPTED
0
$0
0
$0
2
$48,250
1
$45,230
0
$0
0
$0
APPLICATIONS DENIED
2
$85,945
1
$79,910
4
$78,658
4
$32,670
1
$69,860
1
$50,260
APPLICATIONS WITHDRAWN
1
$55,290
1
$32,670
5
$72,978
4
$68,730
0
$0
0
$0
FILES CLOSED FOR INCOMPLETENESS
0
$0
1
$3,520
1
$67,350
0
$0
0
$0
0
$0
Aggregated Statistics For Year 2007 (Based on 2 partial tracts)
A) FHA, FSA/RHS & VA Home Purchase Loans
B) Conventional Home Purchase Loans
C) Refinancings
D) Home Improvement Loans
F) Non-occupant Loans on < 5 Family Dwellings (A B C & D)
G) Loans On Manufactured Home Dwelling (A B C & D)
Number
Average Value
Number
Average Value
Number
Average Value
Number
Average Value
Number
Average Value
Number
Average Value
LOANS ORIGINATED
6
$96,332
16
$85,128
14
$64,154
5
$34,578
1
$110,070
2
$33,170
APPLICATIONS APPROVED, NOT ACCEPTED
0
$0
3
$91,977
3
$50,597
0
$0
0
$0
0
$0
APPLICATIONS DENIED
0
$0
2
$85,695
8
$83,620
2
$21,360
0
$0
1
$128,160
APPLICATIONS WITHDRAWN
1
$33,670
1
$66,340
3
$96,667
0
$0
0
$0
1
$41,720
FILES CLOSED FOR INCOMPLETENESS
1
$139,720
0
$0
1
$36,190
1
$61,820
0
$0
0
$0
Aggregated Statistics For Year 2006 (Based on 2 partial tracts)
A) FHA, FSA/RHS & VA Home Purchase Loans
B) Conventional Home Purchase Loans
C) Refinancings
D) Home Improvement Loans
E) Loans on Dwellings For 5+ Families
F) Non-occupant Loans on < 5 Family Dwellings (A B C & D)
G) Loans On Manufactured Home Dwelling (A B C & D)
Number
Average Value
Number
Average Value
Number
Average Value
Number
Average Value
Number
Average Value
Number
Average Value
Number
Average Value
LOANS ORIGINATED
8
$81,986
14
$56,506
12
$69,903
4
$30,910
1
$3,020
2
$56,795
2
$42,470
APPLICATIONS APPROVED, NOT ACCEPTED
0
$0
2
$45,735
3
$41,883
2
$27,140
0
$0
0
$0
1
$68,860
APPLICATIONS DENIED
0
$0
2
$27,645
9
$70,141
3
$47,913
0
$0
0
$0
1
$21,610
APPLICATIONS WITHDRAWN
0
$0
3
$71,200
2
$53,525
1
$45,230
0
$0
0
$0
1
$51,770
FILES CLOSED FOR INCOMPLETENESS
0
$0
0
$0
4
$105,922
0
$0
0
$0
0
$0
0
$0
Aggregated Statistics For Year 2005 (Based on 2 partial tracts)
A) FHA, FSA/RHS & VA Home Purchase Loans
B) Conventional Home Purchase Loans
C) Refinancings
D) Home Improvement Loans
F) Non-occupant Loans on < 5 Family Dwellings (A B C & D)
G) Loans On Manufactured Home Dwelling (A B C & D)
Number
Average Value
Number
Average Value
Number
Average Value
Number
Average Value
Number
Average Value
Number
Average Value
LOANS ORIGINATED
7
$74,959
6
$84,018
16
$75,359
6
$44,898
0
$0
1
$41,720
APPLICATIONS APPROVED, NOT ACCEPTED
0
$0
2
$29,905
3
$49,590
2
$14,825
0
$0
1
$38,200
APPLICATIONS DENIED
0
$0
4
$59,935
13
$53,546
3
$28,480
1
$30,660
2
$48,250
APPLICATIONS WITHDRAWN
1
$76,900
1
$75,890
4
$73,758
2
$47,745
0
$0
0
$0
FILES CLOSED FOR INCOMPLETENESS
0
$0
0
$0
2
$101,025
0
$0
0
$0
0
$0
Aggregated Statistics For Year 2004 (Based on 2 partial tracts)
A) FHA, FSA/RHS & VA Home Purchase Loans
B) Conventional Home Purchase Loans
C) Refinancings
D) Home Improvement Loans
F) Non-occupant Loans on < 5 Family Dwellings (A B C & D)
G) Loans On Manufactured Home Dwelling (A B C & D)
Number
Average Value
Number
Average Value
Number
Average Value
Number
Average Value
Number
Average Value
Number
Average Value
LOANS ORIGINATED
9
$80,192
14
$75,139
20
$73,631
6
$16,670
3
$42,890
1
$40,710
APPLICATIONS APPROVED, NOT ACCEPTED
0
$0
1
$76,400
5
$49,054
0
$0
0
$0
1
$74,890
APPLICATIONS DENIED
0
$0
3
$64,167
12
$58,552
2
$42,220
1
$31,160
2
$34,930
APPLICATIONS WITHDRAWN
1
$35,680
1
$22,110
9
$59,698
0
$0
1
$39,200
0
$0
FILES CLOSED FOR INCOMPLETENESS
0
$0
0
$0
6
$74,720
1
$37,690
0
$0
0
$0
Aggregated Statistics For Year 2003 (Based on 2 partial tracts)
A) FHA, FSA/RHS & VA Home Purchase Loans
B) Conventional Home Purchase Loans
C) Refinancings
D) Home Improvement Loans
F) Non-occupant Loans on < 5 Family Dwellings (A B C & D)
Number
Average Value
Number
Average Value
Number
Average Value
Number
Average Value
Number
Average Value
LOANS ORIGINATED
7
$59,737
7
$66,127
40
$70,716
3
$17,927
2
$59,055
APPLICATIONS APPROVED, NOT ACCEPTED
1
$44,230
1
$30,660
3
$64,837
2
$19,100
0
$0
APPLICATIONS DENIED
0
$0
3
$63,997
13
$56,021
2
$27,645
1
$55,290
APPLICATIONS WITHDRAWN
1
$89,460
2
$179,930
2
$51,515
0
$0
1
$153,800
FILES CLOSED FOR INCOMPLETENESS
1
$40,710
0
$0
1
$48,750
0
$0
0
$0
Aggregated Statistics For Year 1999 (Based on 1 partial tract)
A) FHA, FSA/RHS & VA Home Purchase Loans
B) Conventional Home Purchase Loans
C) Refinancings
D) Home Improvement Loans
F) Non-occupant Loans on < 5 Family Dwellings (A B C & D)

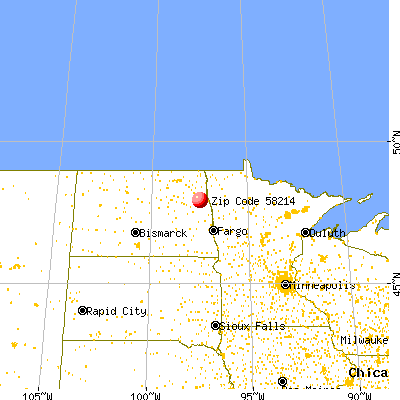


 Nearest zip codes: 58204, 58205, 58228, 58258, 58235, 58251.