Estimated zip code population in 2022: 945 Zip code population in 2010: 692 Zip code population in 2000: 442
Houses and condos: 389 Renter-occupied apartments: 15
% of renters here:
4%
State:
31%
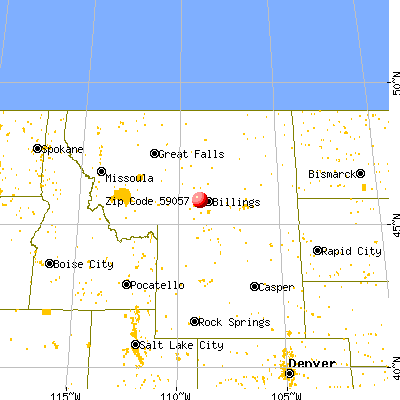
March 2022 cost of living index in zip code 59057: 88.6 (less than average, U.S. average is 100)
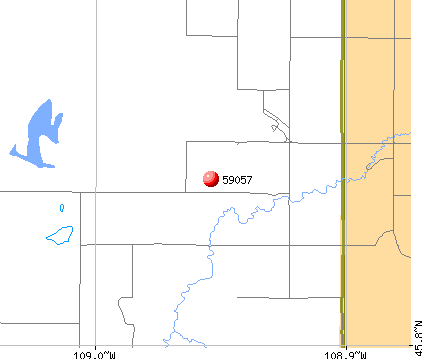
Land area: 264.1 sq. mi. Water area: 0.3 sq. mi.
Population density: 4 people per square mile
(very low).
OSM Map
General Map
Google Map
MSN Map
OSM Map
General Map
Google Map
MSN Map
OSM Map
General Map
Google Map
MSN Map
OSM Map
General Map
Google Map
MSN Map
Please wait while loading the map...
Real estate property taxes paid for housing units in 2022:
This zip code:
0.5% ($2,894)
Montana:
0.7% ($2,498)
Median real estate property taxes paid for housing units with mortgages in 2022: $3,193 (0.6%) Median real estate property taxes paid for housing units with no mortgage in 2022: $2,031 (0.4%)
Business Search- 14 Million verified businesses
Males: 554
(58.7%)
Females: 390
(41.3%)
For population 25 years and over in 59057:
High school or higher: 98.3%
Bachelor's degree or higher: 31.9%
Graduate or professional degree: 1.5%
Unemployed: 0.2%
Mean travel time to work (commute): 36.4 minutes
For population 15 years and over in 59057:
Never married: 31.3%
Now married: 61.8%
Separated: 0.0%
Widowed: 2.6%
Divorced: 4.2%
Zip code 59057 compared to state average:
Unemployed percentage significantly below state average.
Black race population percentage significantly below state average.
Hispanic race population percentage significantly below state average.
Median age above state average.
Foreign-born population percentage significantly below state average.
Renting percentage significantly below state average.
Length of stay since moving in significantly above state average.
Averages for the 2020 tax year for zip code 59057, filed in 2021:
Average Adjusted Gross Income (AGI) in 2020: $82,372 (Individual Income Tax Returns)
Here:
$82,372
State:
$70,533
Salary/wage: $71,019 (reported on 81.2% of returns)
Here:
$71,019
State:
$52,258
(% of AGI for various income ranges: 1037.5% for AGIs below $25k, 3480.0% for AGIs $25k-50k, 7633.3% for AGIs $50k-75k, 9950.0% for AGIs $75k-100k, 23462.0% for AGIs $100k-200k)
Taxable interest for individuals: $246 (reported on 40.6% of returns)
This zip code:
$246
Montana:
$1,928
(% of AGI for various income ranges: 15.0% for AGIs below $25k, 26.7% for AGIs $50k-75k, 13.3% for AGIs $75k-100k, 28.0% for AGIs $100k-200k)
Ordinary dividends: $1,014 (reported on 21.9% of returns)
Here:
$1,014
State:
$7,554
(% of AGI for various income ranges: 100.0% for AGIs $50k-75k, 82.0% for AGIs $100k-200k)
Net capital gain/loss in AGI: +$6,186 (reported on 21.9% of returns)
Here:
+$6,186
State:
+$26,730
(% of AGI for various income ranges: 333.3% for AGIs $50k-75k, 666.0% for AGIs $100k-200k)
Profit/loss from business: +$6,017 (reported on 18.8% of returns)
Here:
+$6,017
State:
+$13,757
(% of AGI for various income ranges: 433.3% for AGIs $25k-50k, 462.0% for AGIs $100k-200k)
Taxable individual retirement arrangement distribution: $10,800 (reported on 9.4% of returns)
59057:
$10,800
Montana:
$19,575
(% of AGI for various income ranges: 1080.0% for AGIs $25k-50k)
Total itemized deductions: $28,567 (reported on 9.4% of returns)
Here:
$28,567
State:
$33,125
(% of AGI for various income ranges: 1714.0% for AGIs $100k-200k)
Charity contributions: $9,300 (reported on 9.4% of returns)
Here:
$9,300
State:
$12,481
(% of AGI for various income ranges: 930.0% for AGIs $75k-100k)
Taxes paid: $7,067 (reported on 9.4% of returns)
59057:
$7,067
State:
$7,689
(% of AGI for various income ranges: 424.0% for AGIs $100k-200k)
Earned income credit: $1,950 (reported on 6.2% of returns)
Here:
$1,950
State:
$2,035
(% of AGI for various income ranges: 97.5% for AGIs below $25k)
Percentage of individuals using paid preparers for their 2020 taxes: 93.8%
Here:
94%
State:
94%
(% for various income ranges: 100.0% for AGIs below $25k, 100.0% for AGIs $25k-50k, 100.0% for AGIs $50k-75k, 80.0% for AGIs $75k-100k, 87.5% for AGIs $100k-200k, 100.0% for AGIs over 200k)
Averages for the 2012 tax year for zip code 59057, filed in 2013:
Average Adjusted Gross Income (AGI) in 2012: $60,956 (Individual Income Tax Returns)
Here:
$60,956
State:
$53,401
Salary/wage: $51,514 (reported on 87.5% of returns)
Here:
$51,514
State:
$40,976
(% of AGI for various income ranges: 82.8% for AGIs below $25k, 75.1% for AGIs $25k-50k, 78.3% for AGIs $50k-75k, 79.3% for AGIs $75k-100k, 68.9% for AGIs $100k-200k)
Taxable interest for individuals: $650 (reported on 37.5% of returns)
This zip code:
$650
Montana:
$1,689
(% of AGI for various income ranges: 1.2% for AGIs below $25k, 1.0% for AGIs $50k-75k, 0.3% for AGIs $75k-100k, 0.2% for AGIs $100k-200k)
Ordinary dividends: $571 (reported on 21.9% of returns)
Here:
$571
State:
$5,585
(% of AGI for various income ranges: 0.9% for AGIs below $25k, 0.4% for AGIs $50k-75k, 0.2% for AGIs $100k-200k)
Net capital gain/loss in AGI: +$3,686 (reported on 21.9% of returns)
Here:
+$3,686
State:
+$14,401
Profit/loss from business: +$8,700 (reported on 18.8% of returns)
Here:
+$8,700
State:
+$10,980
Taxable individual retirement arrangement distribution: $7,567 (reported on 9.4% of returns)
59057:
$7,567
Montana:
$13,434
Total itemized deductions: $21,083 (20% of AGI, reported on 37.5% of returns)
Here:
$21,083
State:
$21,750
Here:
20.3% of AGI
State:
20.5% of AGI
(% of AGI for various income ranges: 14.9% for AGIs $25k-50k, 12.4% for AGIs $50k-75k, 12.6% for AGIs $75k-100k, 14.5% for AGIs $100k-200k)
Charity contributions: $3,989 (reported on 28.1% of returns)
Here:
$3,989
State:
$3,989
(% of AGI for various income ranges: 4.6% for AGIs $25k-50k, 1.9% for AGIs $75k-100k, 2.0% for AGIs $100k-200k)
Taxes paid: $7,450 (reported on 37.5% of returns)
59057:
$7,450
State:
$7,640
(% of AGI for various income ranges: 2.6% for AGIs $25k-50k, 3.6% for AGIs $50k-75k, 4.1% for AGIs $75k-100k, 6.3% for AGIs $100k-200k)
Earned income credit: $1,767 (reported on 9.4% of returns)
Here:
$1,767
State:
$2,015
(% of AGI for various income ranges: 4.4% for AGIs below $25k)
Percentage of individuals using paid preparers for their 2012 taxes: 68.8%
Here:
69%
State:
57%
(% for various income ranges: 54.5% for AGIs below $25k, 71.4% for AGIs $25k-50k, 80.0% for AGIs $50k-75k, 75.0% for AGIs $75k-100k, 80.0% for AGIs $100k-200k)
Averages for the 2004 tax year for zip code 59057, filed in 2005:
Average Adjusted Gross Income (AGI) in 2004: $42,713 (Individual Income Tax Returns)
Here:
$42,713
State:
$37,845
Salary/wage: $40,512 (reported on 84.6% of returns)
Here:
$40,512
State:
$31,190
(% of AGI for various income ranges: 79.9% for AGIs $10k-25k, 77.4% for AGIs $25k-50k, 86.4% for AGIs $50k-75k, 70.0% for AGIs $75k-100k, 71.8% for AGIs over 100k)
Taxable interest for individuals: $760 (reported on 52.6% of returns)
This zip code:
$760
Montana:
$1,879
(% of AGI for various income ranges: 1.1% for AGIs $10k-25k, 0.5% for AGIs $25k-50k, 0.8% for AGIs $50k-75k, 0.1% for AGIs $75k-100k, 0.9% for AGIs over 100k)
Taxable dividends: $848 (reported on 27.0% of returns)
Here:
$848
State:
$3,070
(% of AGI for various income ranges: 0.3% for AGIs $25k-50k, 0.8% for AGIs $50k-75k, 0.5% for AGIs over 100k)
Net capital gain/loss: +$7,526 (reported on 25.9% of returns)
Here:
+$7,526
State:
+$10,237
(% of AGI for various income ranges: 0.9% for AGIs $25k-50k, -0.6% for AGIs $50k-75k, 4.3% for AGIs $75k-100k, 9.4% for AGIs over 100k)
Profit/loss from business: +$5,429 (reported on 19.1% of returns)
Here:
+$5,429
State:
+$8,849
Total itemized deductions: $18,176 (23% of AGI, reported on 34.8% of returns)
Here:
$18,176
State:
$17,258
Here:
22.8% of AGI
State:
23.1% of AGI
(% of AGI for various income ranges: 15.9% for AGIs $25k-50k, 18.7% for AGIs $50k-75k, 16.8% for AGIs $75k-100k, 13.5% for AGIs over 100k)
Charity contributions deductions: $2,519 (3% of AGI, reported on 27.6% of returns)
Here:
$2,519
State:
$2,921
Here:
3.2% of AGI
State:
3.7% of AGI
(% of AGI for various income ranges: 2.0% for AGIs $25k-50k, 2.0% for AGIs $50k-75k, 1.0% for AGIs $75k-100k, 1.8% for AGIs over 100k)
Total tax: $5,921 (reported on 77.8% of returns)
59057:
$5,921
State:
$5,485
(% of AGI for various income ranges: 5.1% for AGIs $10k-25k, 7.2% for AGIs $25k-50k, 7.0% for AGIs $50k-75k, 9.7% for AGIs $75k-100k, 16.1% for AGIs over 100k)
Earned income credit: $1,550 (reported on 13.7% of returns)
Here:
$1,550
State:
$1,604
Percentage of individuals using paid preparers for their 2004 taxes: 64.8%
Here:
65%
State:
63%
(% for various income ranges: 51.3% for AGIs below $10k, 70.4% for AGIs $10k-25k, 66.7% for AGIs $25k-50k, 66.0% for AGIs $50k-75k, 77.3% for AGIs $75k-100k, 76.0% for AGIs over 100k)
Household received Food Stamps/SNAP in the past 12 months: 0 Household did not receive Food Stamps/SNAP in the past 12 months: 367
Women who had a birth in the past 12 months: 1 (1 now married, 0 unmarried) Women who did not have a birth in the past 12 months: 137 (75 now married, 62 unmarried)
Housing units in zip code 59057 with a mortgage: 219 (59 second mortgage) Houses without a mortgage: 87
Median monthly owner costs for units with a mortgage: $2,386 Median monthly owner costs for units without a mortgage: $584
Residents with income below the poverty level in 2022:
This zip code:
2.8%
Whole state:
12.1%
Residents with income below 50% of the poverty level in 2022:
This zip code:
0.3%
Whole state:
6.3%
Median number of rooms in houses and condos:
Here:
8.2
State:
6.4
Median number of rooms in apartments:
Here:
4.7
State:
4.2
Notable locations in this zip code not listed on our city pages
Notable locations in zip code 59057: Ballard Ranch (A), Wheat Basin (B), Lane Ranch (C), Lazy K T Ranch (D), Luckey Homestead (E), Schroder Ranch (F), Popelka Ranch (G), Molt Volunteer Fire Department (H). Display/hide their locations on the map
Creeks: Cedar Creek (A), Lost Creek (B), North Fork Canyon Creek (C), South Fork Canyon Creek (D), South Fork Valley Creek (E), North Fork Valley Creek (F). Display/hide their locations on the map
Size of family households: 129 2-persons, 39 3-persons, 91 4-persons, 29 5-persons
Size of nonfamily households: 73 1-person
80 married couples with children.
0 single-parent households ().
98.9% of residents of 59057 zip code speak English at home.
Foreign born population: 0 (0.0%)
:
0.0%
Whole state:
2.3%
56%German
20%American
12%Norwegian
4%Italian
2%French
1%Irish
0%English
Year of entry for the foreign-born population
02010 or later
02000 to 2009
01990 to 1999
1Before 1990
Facilities with environmental interests located in this zip code:
BLACKSTONE OPERATING (NW1/4,NE1/4,SEC. 14,T1N,R21E in MOLT, MT)
AIR MINOR (AIRS/AFS) STATE MASTER (Montana air and water quality tracking) - MT-CEDARS-100021, AIR PROGRAM CRITERIA AND HAZARDOUS AIR POLLUTANT INVENTORY (Inventory of air pollution sources) Business SIC classification: NATURAL GAS TRANSMISSION Alternative names: BIG WEST OIL & GAS, EQUITABLE RESOURCES ENERGY - LAKE BASIN
MOLT SCHOOL (215 LAKE AVE in MOLT, MT)
(Geographic Names Information System) (National Center for Education Statistics) - STATE ID-1115 Organizations: MOLT ELEM (SCHOOL DISTRICT)
Housing units lacking complete plumbing facilities: 4.0% Housing units lacking complete kitchen facilities: 3.4%
54.6%Bottled, tank, or LP gas
34.7%Electricity
6.9%No fuel used
3.5%Wood
0.6%Coal or coke
Population in 1990: 524.
Place of birth for U.S.-born residents:
This state: 417
Northeast: 60
Midwest: 129
South: 74
West: 268
46% of the 59057 zip code residents lived in the same house 5 years ago. Out of people who lived in different houses, 39% lived in this county. Out of people who lived in different counties, 50% lived in Montana.
92% of the 59057 zip code residents lived in the same house 1 year ago. Out of people who lived in different houses, 94% moved from this county.
Private vs. public school enrollment:
Students in private schools in grades 1 to 8 (elementary and middle school): 2
Here:
7.2%
Montana:
15.3%
Students in private schools in grades 9 to 12 (high school):
Here:
0.0%
Montana:
12.2%
Students in private undergraduate colleges: 82
Here:
80.6%
Montana:
15.0%
Occupation by median earnings in the past 12 months ($)
247,619Management occupations
80,240Business and financial operations occupations
68,992Education, training, and library occupations
54,369Sales and related occupations
42,413Material moving occupations
38,025Food preparation and serving related occupations
Top industries in this zip code by the number of employees in 2005:
Construction: New Single-Family Housing Construction (except Operative Builders) (1-4 employees: 2 establishments)
Professional, Scientific, and Technical Services: Building Inspection Services (1-4: 1)
Professional, Scientific, and Technical Services: Marketing Consulting Services (1-4: 1)
Real Estate and Rental and Leasing: Offices of Real Estate Agents and Brokers (1-4: 1)
Construction: Painting and Wall Covering Contractors (1-4: 1)
Professional, Scientific, and Technical Services: Other Scientific and Technical Consulting Services (1-4: 1)
Construction: All Other Specialty Trade Contractors (1-4: 1)
Construction: Site Preparation Contractors (1-4: 1)
Home Mortgage Disclosure Act Aggregated Statistics For Year 2009 (Based on 2 partial tracts)
A) FHA, FSA/RHS & VA Home Purchase Loans
B) Conventional Home Purchase Loans
C) Refinancings
D) Home Improvement Loans
F) Non-occupant Loans on < 5 Family Dwellings (A B C & D)
G) Loans On Manufactured Home Dwelling (A B C & D)
Number
Average Value
Number
Average Value
Number
Average Value
Number
Average Value
Number
Average Value
Number
Average Value
LOANS ORIGINATED
30
$201,979
41
$212,730
191
$202,338
15
$102,525
6
$171,842
9
$95,800
APPLICATIONS APPROVED, NOT ACCEPTED
2
$165,955
3
$232,880
15
$245,939
0
$0
1
$79,000
1
$40,380
APPLICATIONS DENIED
3
$155,057
4
$162,292
29
$226,890
4
$59,755
1
$120,650
3
$65,120
APPLICATIONS WITHDRAWN
4
$190,625
4
$240,728
38
$201,129
3
$184,000
1
$365,980
1
$127,210
FILES CLOSED FOR INCOMPLETENESS
0
$0
0
$0
6
$219,167
0
$0
0
$0
0
$0
Aggregated Statistics For Year 2008 (Based on 2 partial tracts)
A) FHA, FSA/RHS & VA Home Purchase Loans
B) Conventional Home Purchase Loans
C) Refinancings
D) Home Improvement Loans
F) Non-occupant Loans on < 5 Family Dwellings (A B C & D)
G) Loans On Manufactured Home Dwelling (A B C & D)
Number
Average Value
Number
Average Value
Number
Average Value
Number
Average Value
Number
Average Value
Number
Average Value
LOANS ORIGINATED
20
$215,386
59
$211,408
72
$199,740
18
$93,248
5
$195,408
6
$94,692
APPLICATIONS APPROVED, NOT ACCEPTED
1
$185,010
4
$321,305
9
$205,089
1
$143,360
0
$0
1
$93,640
APPLICATIONS DENIED
1
$117,110
4
$129,732
29
$206,794
6
$56,453
1
$82,030
4
$66,130
APPLICATIONS WITHDRAWN
3
$168,013
7
$151,873
28
$209,005
3
$51,490
1
$89,350
3
$105,670
FILES CLOSED FOR INCOMPLETENESS
0
$0
1
$125,950
3
$146,307
1
$46,190
0
$0
0
$0
Aggregated Statistics For Year 2007 (Based on 2 partial tracts)
A) FHA, FSA/RHS & VA Home Purchase Loans
B) Conventional Home Purchase Loans
C) Refinancings
D) Home Improvement Loans
F) Non-occupant Loans on < 5 Family Dwellings (A B C & D)
G) Loans On Manufactured Home Dwelling (A B C & D)
Number
Average Value
Number
Average Value
Number
Average Value
Number
Average Value
Number
Average Value
Number
Average Value
LOANS ORIGINATED
10
$191,143
91
$181,162
64
$174,353
18
$57,547
9
$150,262
10
$94,499
APPLICATIONS APPROVED, NOT ACCEPTED
0
$0
8
$172,831
8
$211,006
4
$65,812
1
$223,630
1
$106,010
APPLICATIONS DENIED
2
$159,645
14
$145,797
32
$208,474
9
$88,817
2
$235,365
6
$51,448
APPLICATIONS WITHDRAWN
1
$276,130
8
$179,204
21
$197,040
6
$113,328
0
$0
2
$109,795
FILES CLOSED FOR INCOMPLETENESS
0
$0
3
$185,260
3
$216,223
1
$57,040
0
$0
0
$0
Aggregated Statistics For Year 2006 (Based on 2 partial tracts)
A) FHA, FSA/RHS & VA Home Purchase Loans
B) Conventional Home Purchase Loans
C) Refinancings
D) Home Improvement Loans
F) Non-occupant Loans on < 5 Family Dwellings (A B C & D)
G) Loans On Manufactured Home Dwelling (A B C & D)
Number
Average Value
Number
Average Value
Number
Average Value
Number
Average Value
Number
Average Value
Number
Average Value
LOANS ORIGINATED
12
$181,055
94
$169,428
66
$153,750
15
$62,629
7
$147,690
8
$90,139
APPLICATIONS APPROVED, NOT ACCEPTED
0
$0
9
$165,799
5
$124,888
2
$28,645
0
$0
1
$63,100
APPLICATIONS DENIED
1
$211,760
11
$124,479
37
$210,959
6
$46,568
1
$216,310
4
$55,338
APPLICATIONS WITHDRAWN
1
$209,240
7
$154,686
22
$169,682
2
$85,940
0
$0
2
$73,825
FILES CLOSED FOR INCOMPLETENESS
0
$0
2
$108,025
4
$195,420
0
$0
0
$0
0
$0
Aggregated Statistics For Year 2005 (Based on 2 partial tracts)
A) FHA, FSA/RHS & VA Home Purchase Loans
B) Conventional Home Purchase Loans
C) Refinancings
D) Home Improvement Loans
F) Non-occupant Loans on < 5 Family Dwellings (A B C & D)
G) Loans On Manufactured Home Dwelling (A B C & D)
Number
Average Value
Number
Average Value
Number
Average Value
Number
Average Value
Number
Average Value
Number
Average Value
LOANS ORIGINATED
11
$159,930
88
$168,073
68
$152,873
15
$46,745
4
$145,698
8
$81,556
APPLICATIONS APPROVED, NOT ACCEPTED
1
$71,180
8
$133,268
8
$137,684
1
$70,670
0
$0
2
$92,505
APPLICATIONS DENIED
1
$91,620
16
$146,786
30
$162,419
7
$43,089
2
$149,545
7
$54,483
APPLICATIONS WITHDRAWN
0
$0
10
$177,210
20
$167,038
2
$74,835
2
$118,880
2
$77,235
FILES CLOSED FOR INCOMPLETENESS
0
$0
1
$177,440
3
$200,320
0
$0
0
$0
0
$0
Aggregated Statistics For Year 2004 (Based on 2 partial tracts)
A) FHA, FSA/RHS & VA Home Purchase Loans
B) Conventional Home Purchase Loans
C) Refinancings
D) Home Improvement Loans
F) Non-occupant Loans on < 5 Family Dwellings (A B C & D)
G) Loans On Manufactured Home Dwelling (A B C & D)
Number
Average Value
Number
Average Value
Number
Average Value
Number
Average Value
Number
Average Value
Number
Average Value
LOANS ORIGINATED
9
$130,716
73
$164,485
75
$152,477
12
$47,703
6
$145,635
8
$81,115
APPLICATIONS APPROVED, NOT ACCEPTED
1
$63,100
7
$178,014
10
$114,514
1
$18,170
0
$0
2
$67,515
APPLICATIONS DENIED
1
$167,850
9
$119,610
29
$133,241
5
$44,876
2
$159,645
7
$65,516
APPLICATIONS WITHDRAWN
1
$69,160
5
$172,894
24
$130,018
1
$100,960
2
$130,110
2
$62,470
FILES CLOSED FOR INCOMPLETENESS
0
$0
2
$153,965
4
$158,065
1
$15,140
0
$0
1
$70,920
Aggregated Statistics For Year 2003 (Based on 2 partial tracts)
A) FHA, FSA/RHS & VA Home Purchase Loans
B) Conventional Home Purchase Loans
C) Refinancings
D) Home Improvement Loans
F) Non-occupant Loans on < 5 Family Dwellings (A B C & D)
Number
Average Value
Number
Average Value
Number
Average Value
Number
Average Value
Number
Average Value
LOANS ORIGINATED
8
$134,466
54
$162,929
184
$133,506
12
$28,058
5
$114,084
APPLICATIONS APPROVED, NOT ACCEPTED
0
$0
4
$197,188
13
$139,829
1
$22,210
0
$0
APPLICATIONS DENIED
2
$197,630
8
$100,991
39
$117,314
4
$47,010
1
$97,430
APPLICATIONS WITHDRAWN
1
$66,380
4
$174,408
31
$128,748
2
$30,920
1
$170,120
FILES CLOSED FOR INCOMPLETENESS
0
$0
1
$335,940
6
$112,487
1
$32,560
0
$0
Aggregated Statistics For Year 2002 (Based on 2 partial tracts)
A) FHA, FSA/RHS & VA Home Purchase Loans
B) Conventional Home Purchase Loans
C) Refinancings
D) Home Improvement Loans
F) Non-occupant Loans on < 5 Family Dwellings (A B C & D)
Number
Average Value
Number
Average Value
Number
Average Value
Number
Average Value
Number
Average Value
LOANS ORIGINATED
10
$125,796
55
$144,708
123
$133,544
10
$29,127
3
$125,273
APPLICATIONS APPROVED, NOT ACCEPTED
0
$0
7
$109,144
11
$112,869
0
$0
1
$66,630
APPLICATIONS DENIED
1
$45,430
7
$98,184
22
$113,867
5
$18,324
0
$0
APPLICATIONS WITHDRAWN
0
$0
3
$162,883
24
$136,096
2
$30,160
0
$0
FILES CLOSED FOR INCOMPLETENESS
0
$0
1
$58,560
3
$124,013
0
$0
0
$0
Aggregated Statistics For Year 2001 (Based on 2 partial tracts)
A) FHA, FSA/RHS & VA Home Purchase Loans
B) Conventional Home Purchase Loans
C) Refinancings
D) Home Improvement Loans
F) Non-occupant Loans on < 5 Family Dwellings (A B C & D)
Number
Average Value
Number
Average Value
Number
Average Value
Number
Average Value
Number
Average Value
LOANS ORIGINATED
10
$119,108
44
$138,200
82
$113,177
8
$27,638
4
$96,352
APPLICATIONS APPROVED, NOT ACCEPTED
1
$95,150
8
$83,608
9
$86,237
1
$7,820
0
$0
APPLICATIONS DENIED
1
$54,520
12
$67,012
18
$99,656
4
$22,590
1
$51,740
APPLICATIONS WITHDRAWN
2
$77,110
6
$102,727
16
$118,123
2
$13,250
0
$0
FILES CLOSED FOR INCOMPLETENESS
0
$0
1
$167,340
3
$76,477
0
$0
0
$0
Aggregated Statistics For Year 2000 (Based on 2 partial tracts)
A) FHA, FSA/RHS & VA Home Purchase Loans
B) Conventional Home Purchase Loans
C) Refinancings
D) Home Improvement Loans
F) Non-occupant Loans on < 5 Family Dwellings (A B C & D)
Number
Average Value
Number
Average Value
Number
Average Value
Number
Average Value
Number
Average Value
LOANS ORIGINATED
8
$107,428
43
$126,975
31
$89,016
11
$31,045
2
$56,160
APPLICATIONS APPROVED, NOT ACCEPTED
0
$0
10
$71,783
8
$71,745
1
$18,170
1
$44,930
APPLICATIONS DENIED
0
$0
20
$68,198
16
$92,315
2
$32,055
2
$70,295
APPLICATIONS WITHDRAWN
1
$114,840
4
$118,188
7
$87,114
0
$0
0
$0
FILES CLOSED FOR INCOMPLETENESS
0
$0
1
$85,560
3
$63,603
0
$0
0
$0
Aggregated Statistics For Year 1999 (Based on 1 partial tract)
A) FHA, FSA/RHS & VA Home Purchase Loans
B) Conventional Home Purchase Loans
C) Refinancings
D) Home Improvement Loans
F) Non-occupant Loans on < 5 Family Dwellings (A B C & D)


 Nearest zip codes: 59063, 59106, 59015, 59044, 59002, 59067.


